
Managed Cloud Carbon Optimization Services Market Size and Share
Market Overview
| Study Period | 2021 - 2032 |
|---|---|
| Market Size (2027) | USD 1.46 Billion |
| Market Size (2032) | USD 4.39 Billion |
| Growth Rate (2027 - 2032) | 24.74 % |
| Fastest Growing Market | Asia-Pacific |
| Largest Market | North America |
| Market Concentration | Low |
Major Players *Disclaimer: Major Players sorted in no particular order Image © Mordor Intelligence. Reuse requires attribution under CC BY 4.0. | |
Managed Cloud Carbon Optimization Services Market Analysis by Mordor Intelligence
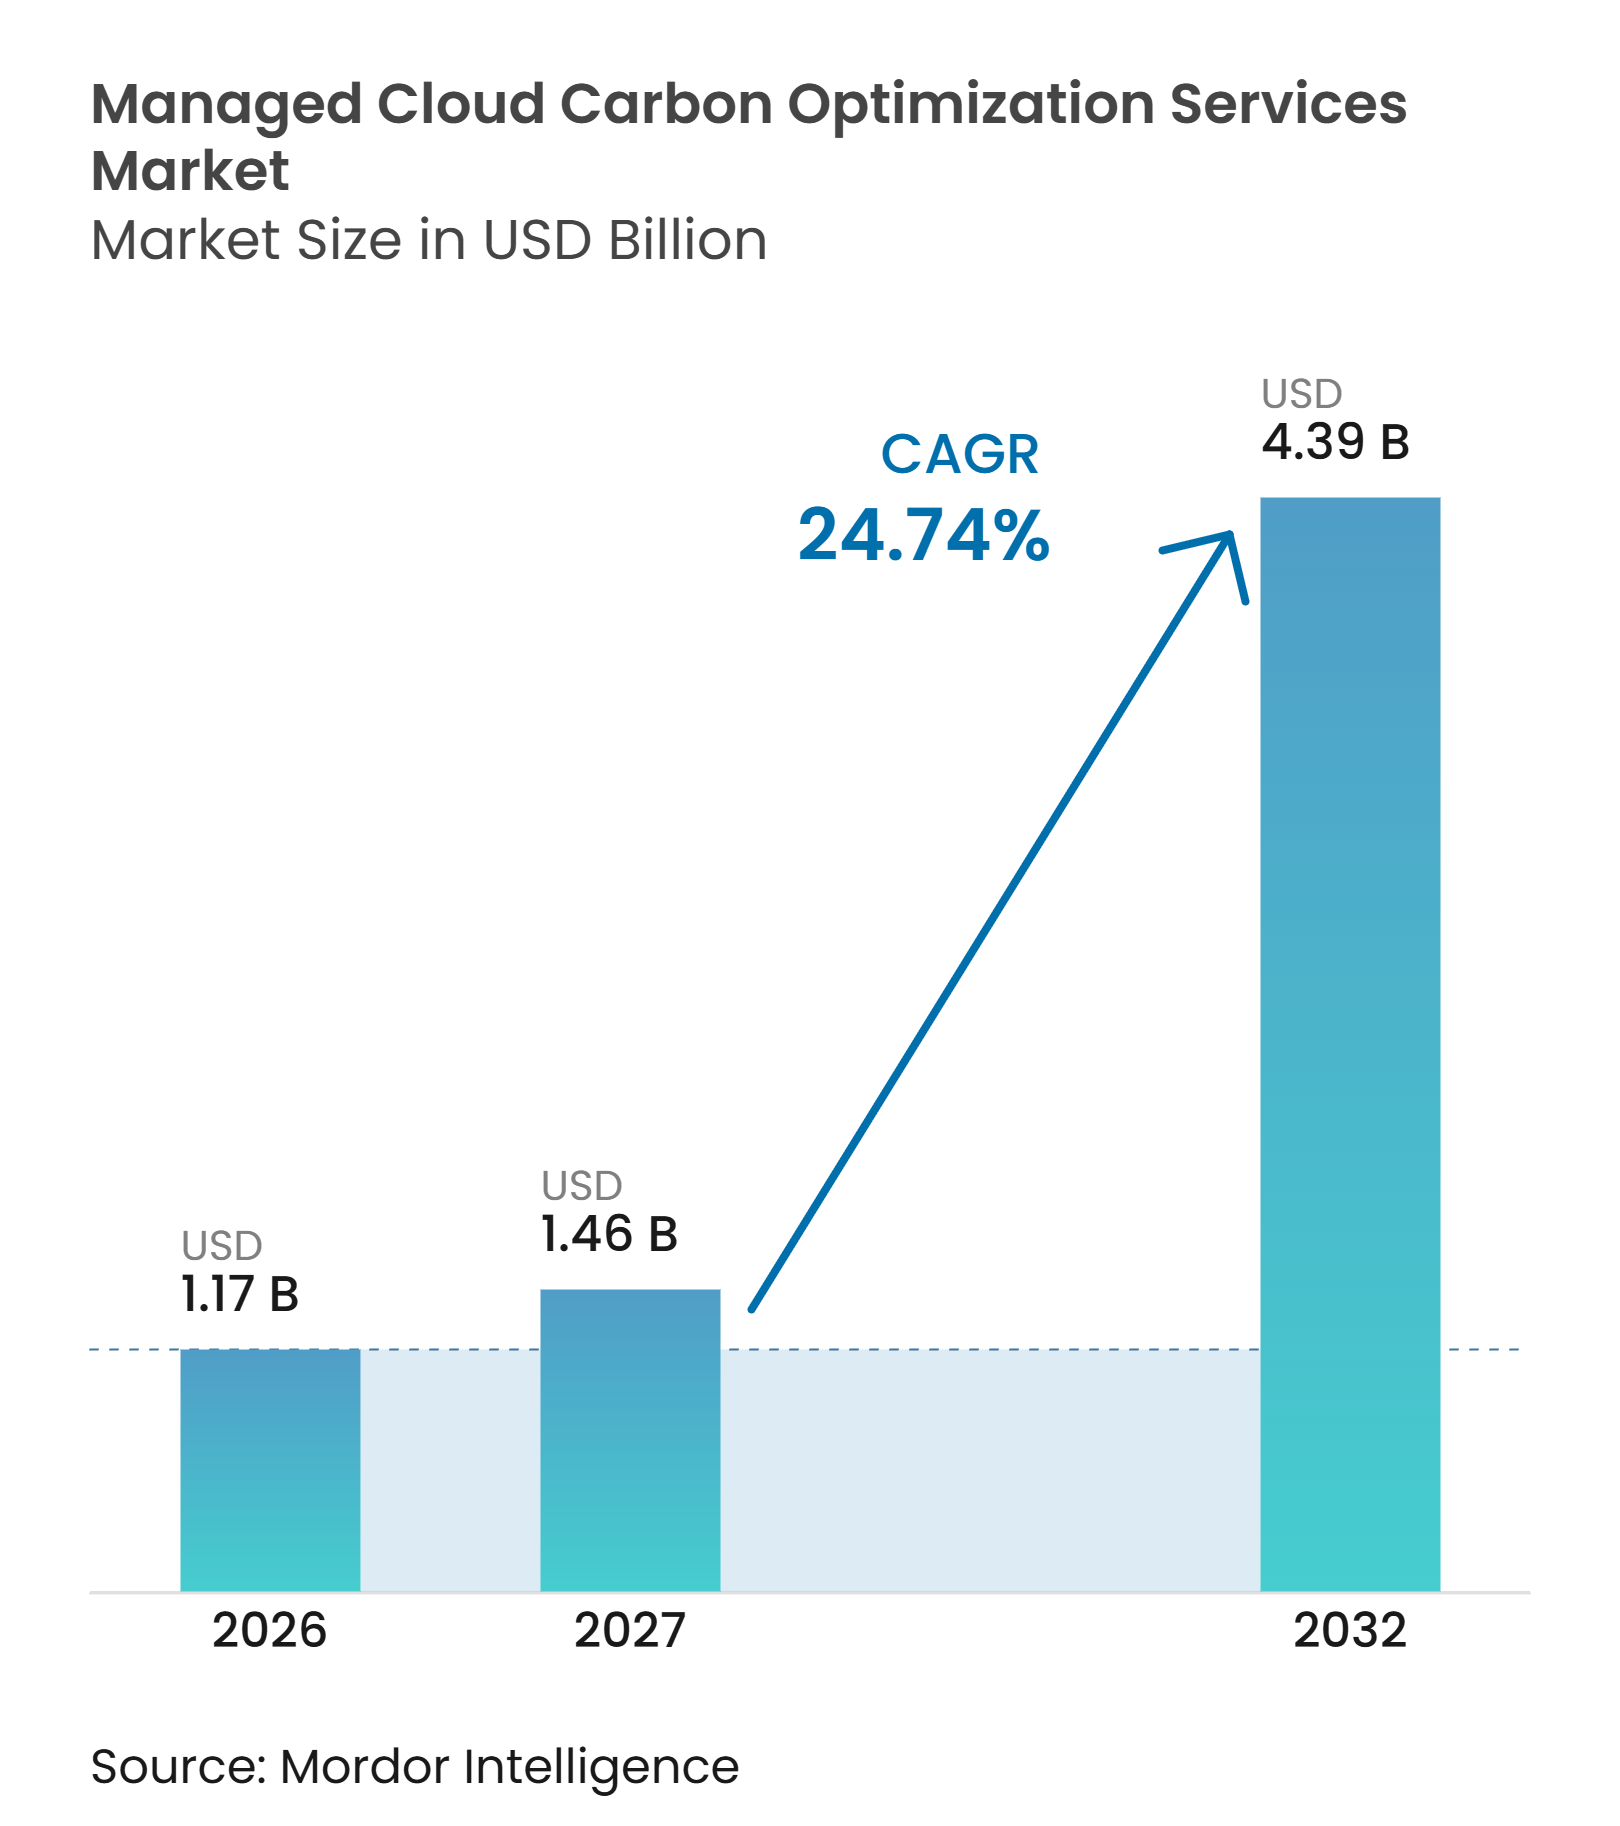
The managed cloud carbon optimization services market size is projected to expand from USD 1.17 billion in 2026 to USD 1.46 billion in 2027, and to USD 4.39 billion by 2032, registering a CAGR of 24.74% between 2027 and 2032. Rising data center electricity use is making cloud infrastructure a measurable environmental liability as well as a cost center. AI workloads increase the need for controls that measure and reduce emissions at the workload level during daily operations. Providers are responding by linking cost optimization, emissions measurement, reporting, and scheduling within managed services. Native cloud dashboards are making basic telemetry more common, while multi-cloud normalization, audit readiness, and AI workload attribution remain areas where specialist providers can differentiate. Data inconsistency, data residency rules, and application performance requirements limit how far buyers can shift workloads, creating demand for services that can work within those constraints.
Key Report Takeaways
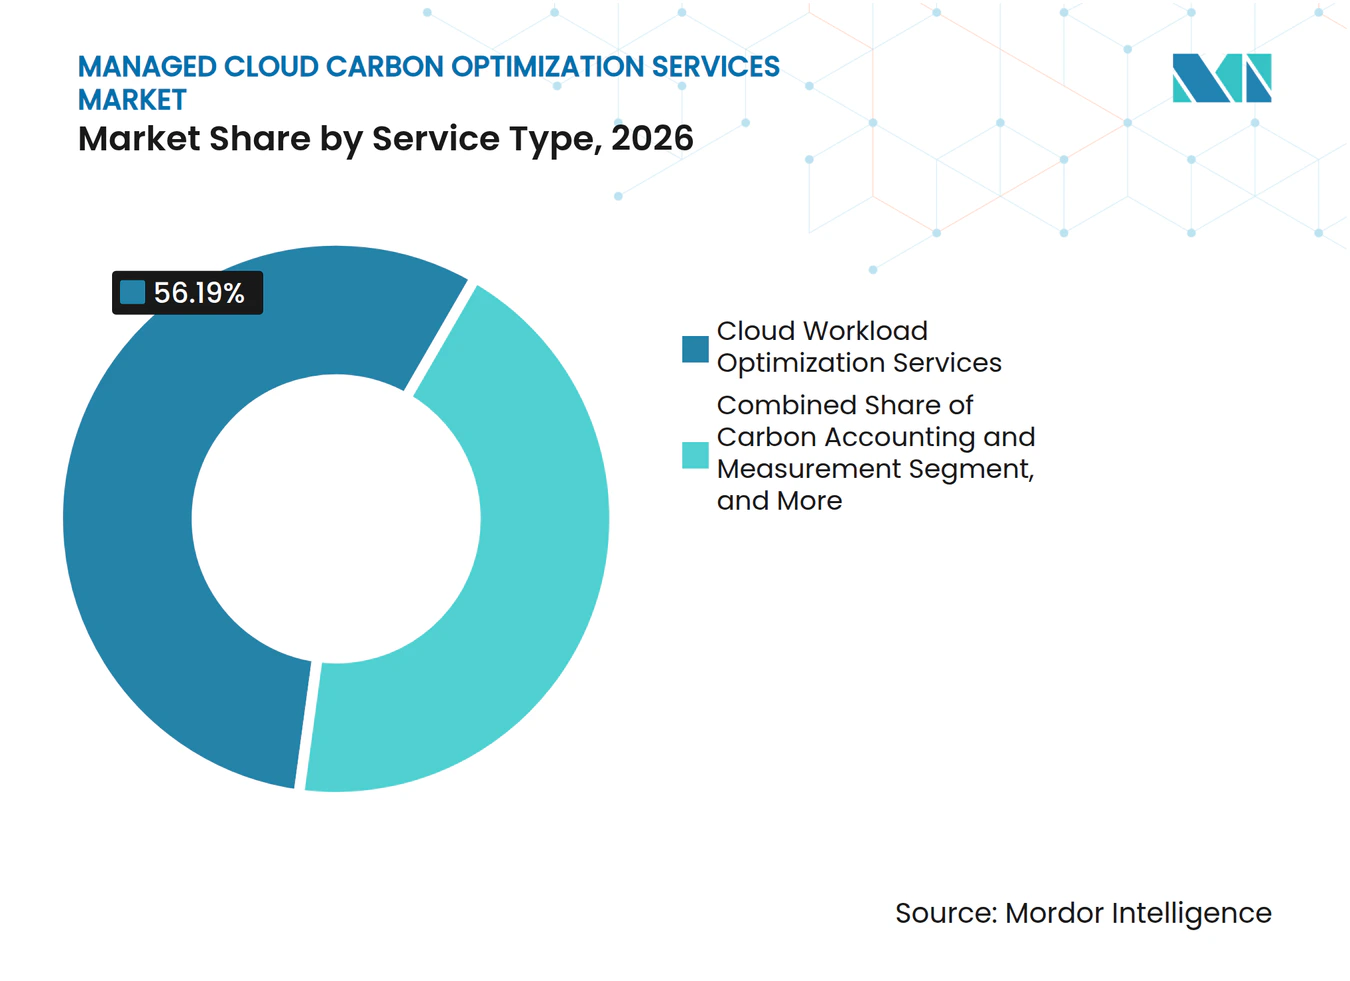
- By service type, Cloud Workload Optimization Services held 56.19% of the managed cloud carbon optimization services market share in 2026, while GreenOps and FinOps Integration Services are projected to expand at a 25.68% CAGR through 2032.
- By deployment mode, on-premises held 67.18% of the managed cloud carbon optimization services market in 2026, while cloud-based deployment is projected to expand at a 25.91% CAGR through 2032.
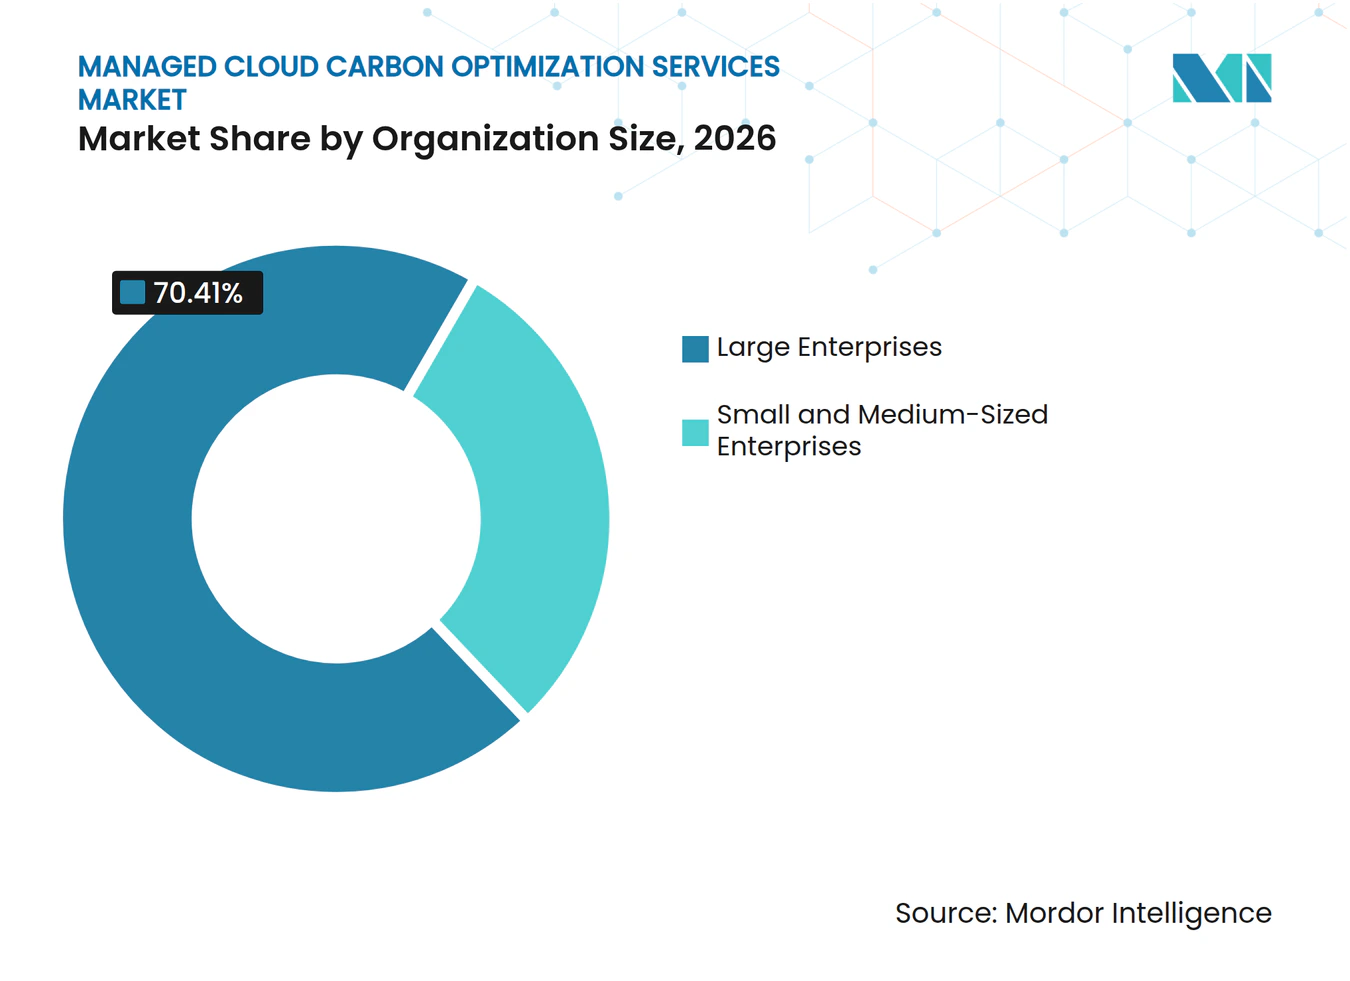
- By organization size, large enterprises accounted for 70.41% of the managed cloud carbon optimization services market size in 2026, while SMEs are projected to expand at a 26.11% CAGR through 2032.
- By end-user industry, IT and telecommunication led with 29.66% of the managed cloud carbon optimization services market share in 2026, while government and public administration is projected to expand at a 25.05% CAGR through 2032.
- By geography, North America held 37.81% of the managed cloud carbon optimization services market share in 2026, while Asia-Pacific is projected to expand at a 25.33% CAGR through 2032.
Note: Market numbers in this report are based on Mordor Intelligence's proprietary estimation framework, which combines nine months of actuals with Q4 projections for base year 2026.
Global Managed Cloud Carbon Optimization Services Market Trends and Insights
Drivers Impact Analysis*
| Driver | (~) % Impact on CAGR Forecast | Geographic Relevance | Impact Timeline |
|---|---|---|---|
| Rising AI Workloads Increase Demand for Carbon-Aware Cloud Operations | +2.5% | Global, concentrated in North America and Asia-Pacific data center hubs | Short term (≤ 2 years) |
| Convergence of FinOps and GreenOps Creates Joint Cost and Carbon Budgets | +2.0% | Global, strongest in North America and Europe | Medium term (2-4 years) |
| Mandatory Climate Disclosure Increases Demand for Audit-Ready Cloud Emissions Data | +1.8% | Europe and global investor-led reporting pressure | Short term (≤ 2 years) |
| Expansion of Renewable-Powered Cloud Regions Enables Workload Relocation Services | +1.2% | Europe and North America, with spillover to Asia-Pacific | Medium term (2-4 years) |
| Carbon-Aware Kubernetes and Batch Scheduling Converts Flexibility Into Optimization Demand | +0.9% | Global, with early adoption in North America and Northern Europe | Medium term (2-4 years) |
| Cloud Procurement and Supplier Reporting Extend Carbon Accountability Into IT Operations | +0.7% | Europe, Asia-Pacific government procurement, and global enterprises | Long term (≥ 4 years) |
| Source: Mordor Intelligence | |||
Rising AI Workloads Increase Demand for Carbon-Aware Cloud Operations
The managed cloud carbon optimization services market is gaining support as AI workloads turn power use into a board-level issue for cloud buyers. Global data center electricity demand rose 17% in 2025, compared with 3% growth in total electricity demand, according to the International Energy Agency. The agency also expects electricity demand from AI-focused data centers to triple by 2030. GPU-heavy model training and inference make broad power averages less useful for operational choices. Buyers, therefore, need attribution at the model, token-type, and billing-meter levels to determine where optimization can occur. Flexera made its AI Sustainability capability generally available in October 2026, enabling carbon, electricity, and water attribution across connected AWS, Azure, and Google Cloud accounts.
Convergence of FinOps and GreenOps Creates Joint Cost and Carbon Budgets
The managed cloud carbon optimization services market benefits when finance, engineering, and sustainability teams use a shared operating process. The FinOps Foundation reported that 53% of European FinOps practices tracked carbon metrics in 2025, an 18% year-over-year increase. Only 3% of FinOps practices globally used carbon information to drive cloud optimization, showing that measurement was ahead of operational action. SoftwareOne reported that continuous tracking of its environmental footprint within its FinOps practice produced USD 448,000 in savings, alongside a 30% reduction in total cloud emissions. Existing FinOps tools can give enterprises a starting point for carbon optimization without a separate infrastructure program. Managed providers can use this gap to convert carbon telemetry into actions without requiring a dedicated sustainability engineering team at each customer.
Mandatory Climate Disclosure Increases Demand for Audit-Ready Cloud Emissions Data
The managed cloud carbon optimization services market is supported by reporting requirements that make traceable cloud emissions data more valuable. The Corporate Sustainability Reporting Directive requires qualifying companies operating in the European Union to report under the European Sustainability Reporting Standards, including Scope 2 information that is subject to external assurance review. Monthly and differently formatted cloud-provider reports require normalization before they can support an audit process. The U.S. Securities and Exchange Commission proposed rescinding its 2024 climate disclosure rules in June 2026. California climate reporting laws and institutional investor expectations still require many large U.S. companies to report. Providers that align outputs with the GHG Protocol and preserve data lineage can serve both mandatory European reporting and continuing U.S. investor needs.
Expansion of Renewable-Powered Cloud Regions Enables Workload Relocation Services
The managed cloud carbon optimization services market also relies on differences in carbon-free electricity across cloud locations. Amazon matched 100% of its global electricity consumption with renewable energy in 2025 for the third consecutive year, including 25 AWS data center regions.[1] Google Cloud reported 100% carbon-free energy in Stockholm, 98% in Finland, and 96% in Paris during 2025, compared with 2% in Hong Kong. This range provides a practical option for moving flexible batch workloads and AI training jobs to lower-carbon locations. Internal FinOps teams often lack the data integration and staffing needed to plan these moves continuously. Managed providers can make this capability repeatable while accounting for cost, capacity, latency, and compliance requirements.
Restraints Impact Analysis*
| Restraint | (~) % Impact on CAGR Forecast | Geographic Relevance | Impact Timeline |
|---|---|---|---|
| Inconsistent Carbon-Intensity Data and Forecast Accuracy Limits Optimization Confidence | -1.5% | Global, most acute in multi-cloud environments spanning North America and Europe | Short term (≤ 2 years) |
| Hybrid and Multi-Cloud Telemetry Integration Increases Implementation Complexity | -1.0% | Global, with a higher burden in Asia-Pacific and the Middle East and Africa | Medium term (2-4 years) |
| Data Residency and Sovereignty Rules Constrain Cross-Region Workload Shifting | -0.8% | Europe and Asia-Pacific national cloud policy environments | Long term (≥ 4 years) |
| Service-Level and Performance Risk Limits Aggressive Workload Deferral | -0.5% | Global, most acute in latency-sensitive sectors such as financial services | Medium term (2-4 years) |
| Source: Mordor Intelligence | |||
Inconsistent Carbon-Intensity Data and Forecast Accuracy Limits Optimization Confidence
The managed cloud carbon optimization services market faces a basic data-quality challenge across multi-cloud environments. AWS, Azure, and Google Cloud provide carbon data on different schedules and use different methodologies, Scope 2 boundaries, and approaches to renewable energy attribution. The Green Software Foundation noted that cloud providers have released customer carbon data monthly, limiting its use for real-time decision-making. This leaves organizations with reports that require normalization before a unified emissions baseline can be created. Electricity Maps expanded real-time carbon-intensity data to more than 200 countries and territories in January 2025. WattTime strengthened its AOER model in July 2026 with flow tracing, energy-storage handling, and non-CO₂ factors across 15 new European regions, but hourly workload-level attribution remains difficult across a full multi-cloud estate.
Hybrid and Multi-Cloud Telemetry Integration Increases Implementation Complexity
Hybrid and multi-cloud environments make managed deployments more difficult because monitoring systems do not, by default, exchange telemetry. AWS CloudWatch, Azure Monitor, and Google Cloud Monitoring operate within separate environments, requiring a layer that can ingest, normalize, and reconcile their data. Research published by ACM in 2025 identified fair carbon disaggregation in shared infrastructure as a difficult methodological task. This affects how emissions can be assigned to individual applications, teams, and services. The resulting integration work can lengthen time to value and raise engagement costs, especially where customers lack sustainability engineering resources. ISO 14064-based audit expectations also require documentation of the normalization process, adding effort where on-premises meters and cloud billing exports use different data models.
*Our forecasts treat driver/restraint impacts as directional, not additive. The impact forecasts reflect baseline growth, mix effects, and variable interactions.
Segment Analysis
By Service Type: Workload Optimization Anchors Revenue While Integration Drives Faster Adoption
Cloud Workload Optimization Services commanded 56.19% of revenue in 2026, making them the central entry point for the managed cloud carbon optimization services market. The service provides a direct financial benefit by identifying idle compute and by moving flexible work to lower-carbon regions during the same billing cycle. GreenOps and FinOps Integration Services are projected to expand at a 25.68% CAGR through 2032, the fastest rate among service types. This service addresses the absence of a shared data layer for finance, engineering, and sustainability teams. Carbon Accounting and Measurement Services provide the emissions baseline on which optimization depends. Sustainability Reporting and Compliance Services support recurring work linked to disclosure cycles and external assurance needs.
The managed cloud carbon optimization services industry is moving beyond basic cloud provider dashboards toward services that normalize data across environments. Within the managed cloud carbon optimization services market, basic telemetry is becoming more common as hyperscalers improve native reporting tools. Managed providers can therefore differentiate through audit trails, predictive carbon budgets, and more detailed AI workload attribution. Carbon-aware Kubernetes scheduling has been shown to reduce CO₂ emissions by 10%-30% without a meaningful impact on performance in the referenced research. This evidence helps customers place a financial and operating value on scheduling services. GreenOps and FinOps Integration Services are becoming part of the core FinOps workflow rather than a separate sustainability add-on.



By Deployment Mode: On-Premises Leadership Reflects Data Governance Needs While Cloud Delivery Advances
On-premises deployment accounted for 67.18% of revenue in the managed cloud carbon optimization services market in 2026. Regulated organizations use this model to keep carbon intelligence infrastructure and operational telemetry within controlled data boundaries. Cloud-based deployment is projected to expand at a 25.91% CAGR through 2032, the highest rate among deployment models. Providers are building multi-tenant designs that can deliver workload-level intelligence without persistent access to sensitive infrastructure information. The hybrid model serves organizations with both legacy on-premises systems and cloud-native workloads. These buyers often require the most extensive telemetry integration and may derive the greatest value from a managed service.
Cloud-based delivery can reduce the burden of maintaining an internal platform, but it requires confidence in data handling and supplier controls. The European Union Data Act requires cloud providers to waive data transfer charges for service switching by January 2027. This change can reduce lock-in concerns for buyers considering cloud-delivered carbon optimization tools. It may also encourage competitive procurement, as customers can switch providers with lower cost exposure. On-premises deployments remain relevant where national rules or internal policies limit external processing of telemetry. The managed cloud carbon optimization services market, therefore, needs delivery options that reflect different security and compliance positions rather than a single architecture.
By Organization Size: Large Enterprises Lead While SMEs Gain Access Through Managed Tiers
Large enterprises accounted for 70.41% of the managed cloud carbon optimization services market share in 2026. They have the largest cloud estates, more mature FinOps functions, and earlier exposure to climate disclosure obligations. SMEs are projected to expand at a 26.11% CAGR through 2032. Supply-chain reporting obligations can extend climate data requests from large buyers to smaller suppliers. This creates pressure on SMEs that lack dedicated reporting teams and internal engineering resources. Their adoption case depends on low-complexity services that can connect to existing cloud billing and monitoring tools.
Platform vendors can meet this need with lower-instrumentation tiers, application programming interface-based connections, and preconfigured reports aligned with the GHG Protocol. These features can reduce the effort needed to create basic emissions information and support customer questionnaires. Manufacturing, logistics, and technology suppliers are relevant demand pools because their large enterprise customers increasingly require supply chain information. Within the managed cloud carbon optimization services market, declining platform costs and rising reporting exposure can shorten the decision process for a managed offering. Large enterprises will remain important because their scale supports more complex multi-cloud and workload-level programs.

By End-User Industry: IT and Telecommunication Leads While Government Procurement Expands
IT and telecommunications accounted for 29.66% of revenue in the managed cloud carbon optimization services market in 2026. The sector owns and operates large volumes of cloud infrastructure and has established FinOps practices. Government and public administration are projected to expand at a 25.05% CAGR through 2032. Green procurement requirements are encouraging public buyers to consider energy performance and renewable energy sourcing when purchasing cloud services. Singapore’s GovTech confirmed plans to incorporate SS 715:2025 energy-efficiency baselines into government IT bulk tenders.[2] The Philippines Procurement Service listed Google Cloud Computing Services as a green technology product on its eMarketplace in June 2026.
BFSI is the second-largest end-user segment and needs investor-grade ESG reporting alongside strict service-level controls. Its latency-sensitive workloads favor scheduling-layer improvements over aggressive deferral. Healthcare and life sciences, retail and e-commerce, industrial manufacturing, and education and research institutions represent smaller segments with distinct confidentiality and compliance needs. Healthcare and manufacturing are showing interest in cloud procurement reporting as carbon accountability expands across IT supply chains. This supports recurring demand for carbon accounting services that work within sector-specific controls. The managed cloud carbon optimization services market must therefore combine common measurement methods with deployment and reporting practices suited to each sector.
Geography Analysis
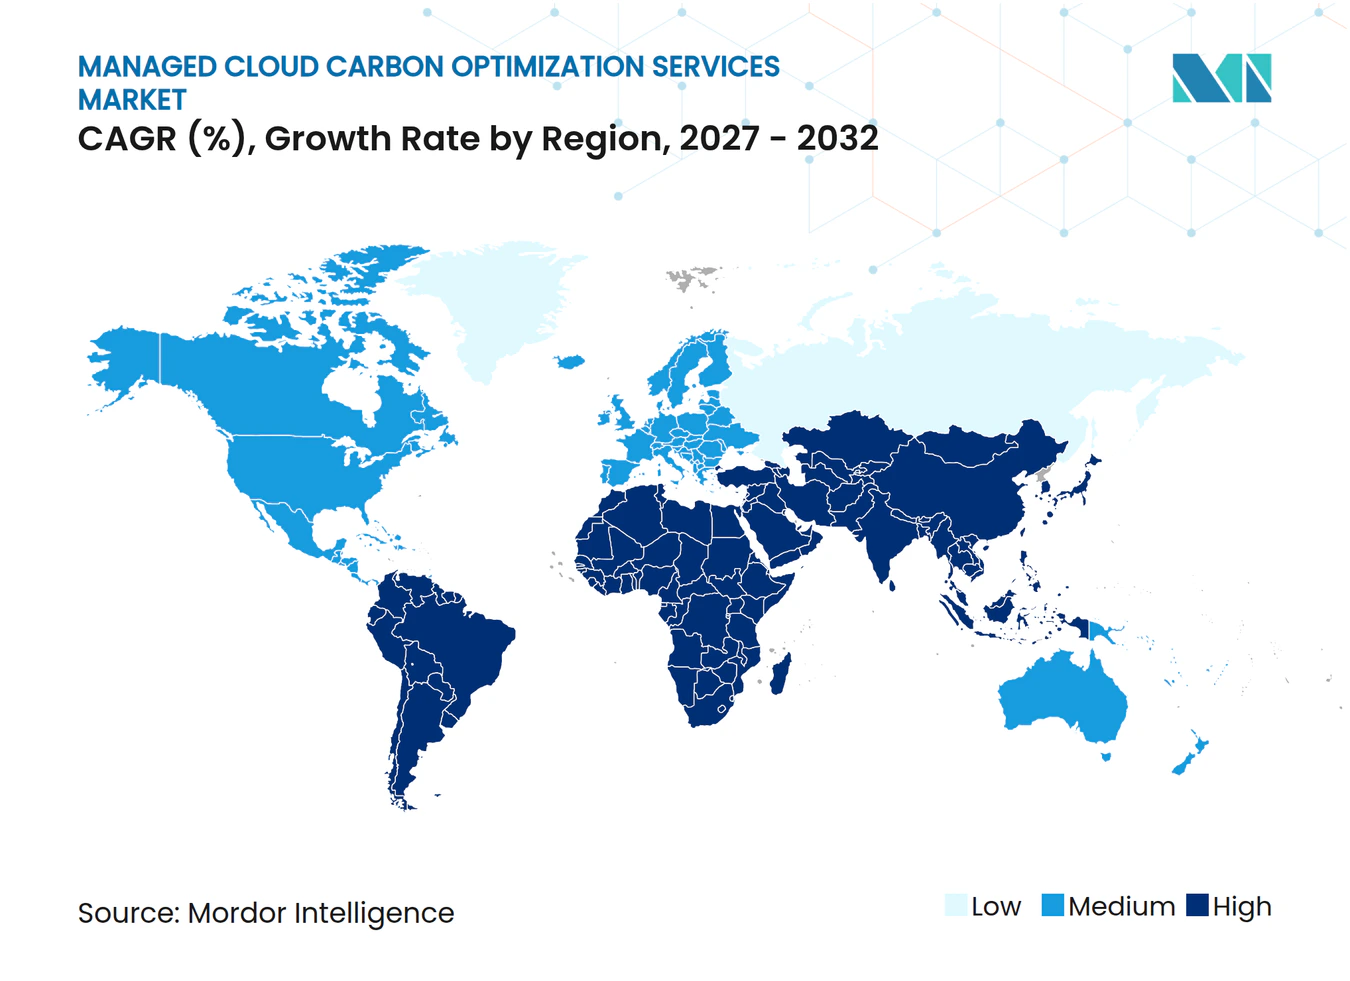
North America accounted for 37.81% of revenue in 2026. The United States and Canada combine dense hyperscaler capacity, a large FinOps practitioner base, and continuing investor-led reporting expectations. The SEC proposal to rescind mandatory climate disclosure rules did not remove the need for reporting among companies subject to California requirements or investor requests.[3] Canada is both a source of demand and a potential location for lower-carbon workloads. Google reported 97% carbon-free energy in its Montréal region, while AWS Canadian regions have low grid carbon intensity within North America. These conditions support cross-border workload planning where customer data rules allow it.
Europe is supported by the CSRD and its requirement for auditable Scope 2 disclosure. Northern European cloud locations provide lower-carbon options, including Google Cloud regions in Stockholm, Finland, and Paris. The operational value of these regions depends on scheduling services that can document the effect of emissions in a form suitable for reporting. Germany and the United Kingdom are the largest country markets within Europe because they have significant concentrations of CSRD wave 1 filers. The Data Act’s cloud switching provisions can increase supplier choice and encourage procurement activity as switching charges are phased out. Data residency rules still require providers to limit workload relocation where data cannot cross permitted locations.
Asia-Pacific is projected to expand at a 25.33% CAGR through 2032, the fastest regional rate in the managed cloud carbon optimization services market. Singapore launched SS 715:2025 in August 2025 as a tropical-climate data center IT energy-efficiency standard targeting at least 30% energy savings and operation at temperatures up to 35°C. China applies a Green Data Center Government Procurement Requirements Standard to state-directed cloud procurement. Japan’s software carbon footprint guidance, India’s SEBI reporting framework, and South Korean conglomerates' net-zero commitments are driving interest in workload-level accounting and joint FinOps-GreenOps programs. In the managed cloud carbon optimization services market, these policies make procurement requirements an important route to adoption. South America, the Middle East, and Africa remain at an earlier stage, with demand in Brazil and South Africa concentrated among multinational subsidiaries and government entities.
Competitive Landscape
Market Concentration
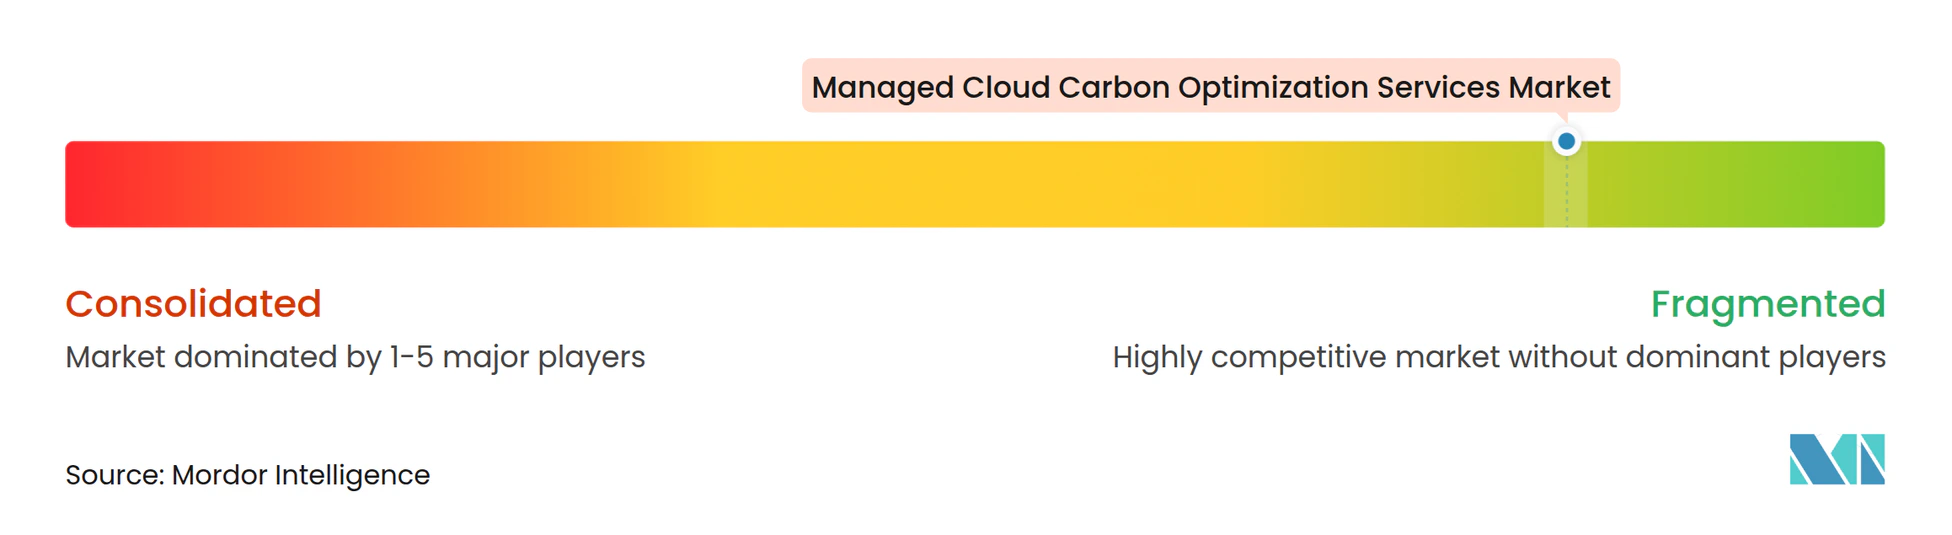
The managed cloud carbon optimization services market is fragmented across carbon-intensity data providers, workload optimization platforms, FinOps-GreenOps tools, and managed service integrators. Electricity Maps and WattTime provide data that support location-based carbon signals. CloudBolt, Densify, Zesty, and Cirrus Nexus operate in workload optimization, while Flexera and Finout support FinOps and GreenOps activities. Accenture, IBM, Claranet, and Xebia provide broader service and integration capabilities. No company has a dominant position across this full set of activities. Basic cloud provider dashboards put pressure on providers that offer only standard emissions telemetry.
Specialists are competing through multi-cloud data normalization, audit-ready evidence, and detailed attribution for AI workloads. Flexera made its AI Sustainability feature generally available in October 2026, enabling customers to attribute carbon emissions, electricity use, and water use to individual AI models and token types across AWS, Azure, and Google Cloud. Context Labs partnered with New Era Energy and Digital, Sharon AI, and Mawgan Capital in September 2025 to integrate its platform into an AI-focused data center campus in Texas.[4] That approach links carbon accounting to the energy supply chain that powers AI infrastructure. WattTime upgraded its AOER model in July 2026, adding flow tracing and improved storage handling across 15 European regions.
Larger providers are embedding carbon management in established enterprise software and advisory environments. Accenture’s myNav Green Cloud Advisor uses cost, performance, energy, and CO₂ data to support scenario planning. SAP connects carbon management to enterprise resource planning data, supporting product-level emissions and Scope 3 work for large accounts. Opportunities remain in SME-focused service tiers, sovereign cloud settings, and AI-specific carbon attribution. Providers that can operate within data residency restrictions can address customers who cannot use unrestricted cross-region scheduling.
Managed Cloud Carbon Optimization Services Industry Leaders
-
FlexiDAO S.L.
-
Cirrus Nexus, Inc.
-
CloudBolt Software, Inc.
-
Finout, Inc.
-
Claranet Limited
- *Disclaimer: Major Players sorted in no particular order
Recent Industry Developments
- October 2026: Flexera made its AI Sustainability dashboard generally available to all Cloud Sustainability customers, enabling attribution of carbon emissions, electricity consumption, and water usage to individual AI models and token types across connected AWS, Azure, and Google Cloud accounts. This is the first FinOps platform feature to offer token-level AI environmental impact attribution, directly addressing enterprise demand for AI carbon accountability as AI workloads become the largest driver of data center emissions growth.
- September 2026: The Philippines' Procurement Service-Department of Budget and Management formally listed Google Cloud Computing Services as a green technology product on its government eMarketplace, following a Memorandum of Agreement signed May 25, 2026. Government agencies can now procure cloud services at committed-use discounts of up to 30% while satisfying green technology procurement requirements.
- August 2026: WattTime upgraded its AOER model, version 2026-04-01, with flow-tracing of electricity imports, improved energy storage handling, and non-CO₂ factor accounting across 15 new European regions. The upgrade aligns the model with the current GHG Protocol Scope 2 location-based guidance, raising the data-quality floor for carbon-aware scheduling platforms globally.
- June 2026: The SEC published a proposed rulemaking to rescind its March 2024 climate-related disclosure rules, with a comment period through August 3, 2026. The proposal shifts federal U.S. regulatory posture without eliminating enterprise demand, as investor-driven reporting obligations and California state climate disclosure laws maintain a compliance floor for large public companies.
Global Managed Cloud Carbon Optimization Services Market Report Scope
The Managed Cloud Carbon Optimization Services Market comprises outsourced services that help organizations measure, monitor, manage, reduce, and report carbon emissions associated with cloud computing environments. These services include cloud workload optimization, carbon accounting and measurement, sustainability reporting, GreenOps and FinOps integration, emissions monitoring, carbon-aware operational management, and ongoing optimization of cloud resources to balance environmental sustainability, regulatory compliance, and operational efficiency objectives.
The Managed Cloud Carbon Optimization Services Market Report is Segmented by Service Type (Cloud Workload Optimization Services, Carbon Accounting and Measurement Services, Sustainability Reporting and Compliance Services, GreenOps and FinOps Integration Services, and Other Service Types), Deployment Mode (On-Premises, Cloud-Based, and Hybrid), Organization Size (Large Enterprises, and Small and Medium-Sized Enterprises), End-User Industry (Banking, Financial Services, and Insurance [BFSI], Government and Public Administration, Healthcare and Life Sciences, IT and Telecommunication, Industrial Manufacturing, Retail and E-commerce, Education and Research Institutions, and Other End-User Industries), and Geography (North America, South America, Europe, Asia-Pacific, Middle East, and Africa). The Market Forecasts are Provided in Terms of Value (USD).
| Cloud Workload Optimization Services |
| Carbon Accounting and Measurement Services |
| Sustainability Reporting and Compliance Services |
| GreenOps and FinOps Integration Services |
| Other Service Types |
| On-Premises |
| Cloud-Based |
| Hybrid |
| Large Enterprises |
| Small and Medium-Sized Enterprises |
| Banking, Financial Services, and Insurance (BFSI) |
| Government and Public Administration |
| Healthcare and Life Sciences |
| IT and Telecommunication |
| Industrial Manufacturing |
| Retail and E-commerce |
| Education and Research Institutions |
| Other End-User Industries |
| North America | United States |
| Canada | |
| Mexico | |
| South America | Brazil |
| Argentina | |
| Rest of South America | |
| Europe | Germany |
| United Kingdom | |
| France | |
| Italy | |
| Russia | |
| Rest of Europe | |
| Asia-Pacific | China |
| Japan | |
| India | |
| South Korea | |
| Rest of Asia-Pacific | |
| Middle East | Saudi Arabia |
| United Arab Emirates | |
| Rest of Middle East | |
| Africa | South Africa |
| Nigeria | |
| Rest of Africa |
| By Service Type | Cloud Workload Optimization Services | |
| Carbon Accounting and Measurement Services | ||
| Sustainability Reporting and Compliance Services | ||
| GreenOps and FinOps Integration Services | ||
| Other Service Types | ||
| By Deployment Mode | On-Premises | |
| Cloud-Based | ||
| Hybrid | ||
| By Organization Size | Large Enterprises | |
| Small and Medium-Sized Enterprises | ||
| By End-User Industry | Banking, Financial Services, and Insurance (BFSI) | |
| Government and Public Administration | ||
| Healthcare and Life Sciences | ||
| IT and Telecommunication | ||
| Industrial Manufacturing | ||
| Retail and E-commerce | ||
| Education and Research Institutions | ||
| Other End-User Industries | ||
| By Geography | North America | United States |
| Canada | ||
| Mexico | ||
| South America | Brazil | |
| Argentina | ||
| Rest of South America | ||
| Europe | Germany | |
| United Kingdom | ||
| France | ||
| Italy | ||
| Russia | ||
| Rest of Europe | ||
| Asia-Pacific | China | |
| Japan | ||
| India | ||
| South Korea | ||
| Rest of Asia-Pacific | ||
| Middle East | Saudi Arabia | |
| United Arab Emirates | ||
| Rest of Middle East | ||
| Africa | South Africa | |
| Nigeria | ||
| Rest of Africa | ||
Key Questions Answered in the Report
What is the managed cloud carbon optimization services market size?
The managed cloud carbon optimization services market size is projected to rise from USD 1.46 billion in 2027 to USD 4.39 billion by 2032, at a 24.74% CAGR.
What is driving demand for managed cloud carbon optimization services?
AI-related data center electricity demand, disclosure needs, and the integration of cost and carbon controls are increasing demand for managed services.
Which service type leads managed cloud carbon optimization services?
Cloud Workload Optimization Services held 56.19% revenue share in 2026 because they can reduce idle compute and support lower-carbon workload placement.
Which deployment model is expanding fastest?
Cloud-based deployment is projected to expand at a 25.91% CAGR through 2032, supported by multi-tenant delivery models and lower internal platform requirements.
Which organizations are adopting these services fastest?
SMEs are projected to expand at a 26.11% CAGR through 2032 as supply-chain reporting expectations reach smaller organizations.
Which region is expanding fastest for these services?
Asia-Pacific is projected to expand at a 25.33% CAGR through 2032, supported by procurement standards and data center energy-efficiency policies.