
Managed GreenOps Services Market Size and Share
Market Overview
| Study Period | 2021 - 2032 |
|---|---|
| Market Size (2027) | USD 2.86 Billion |
| Market Size (2032) | USD 7.32 Billion |
| Growth Rate (2027 - 2032) | 20.68 % |
| Fastest Growing Market | Asia-Pacific |
| Largest Market | North America |
| Market Concentration | Medium |
Major Players *Disclaimer: Major Players sorted in no particular order Image © Mordor Intelligence. Reuse requires attribution under CC BY 4.0. | |
Managed GreenOps Services Market Analysis by Mordor Intelligence
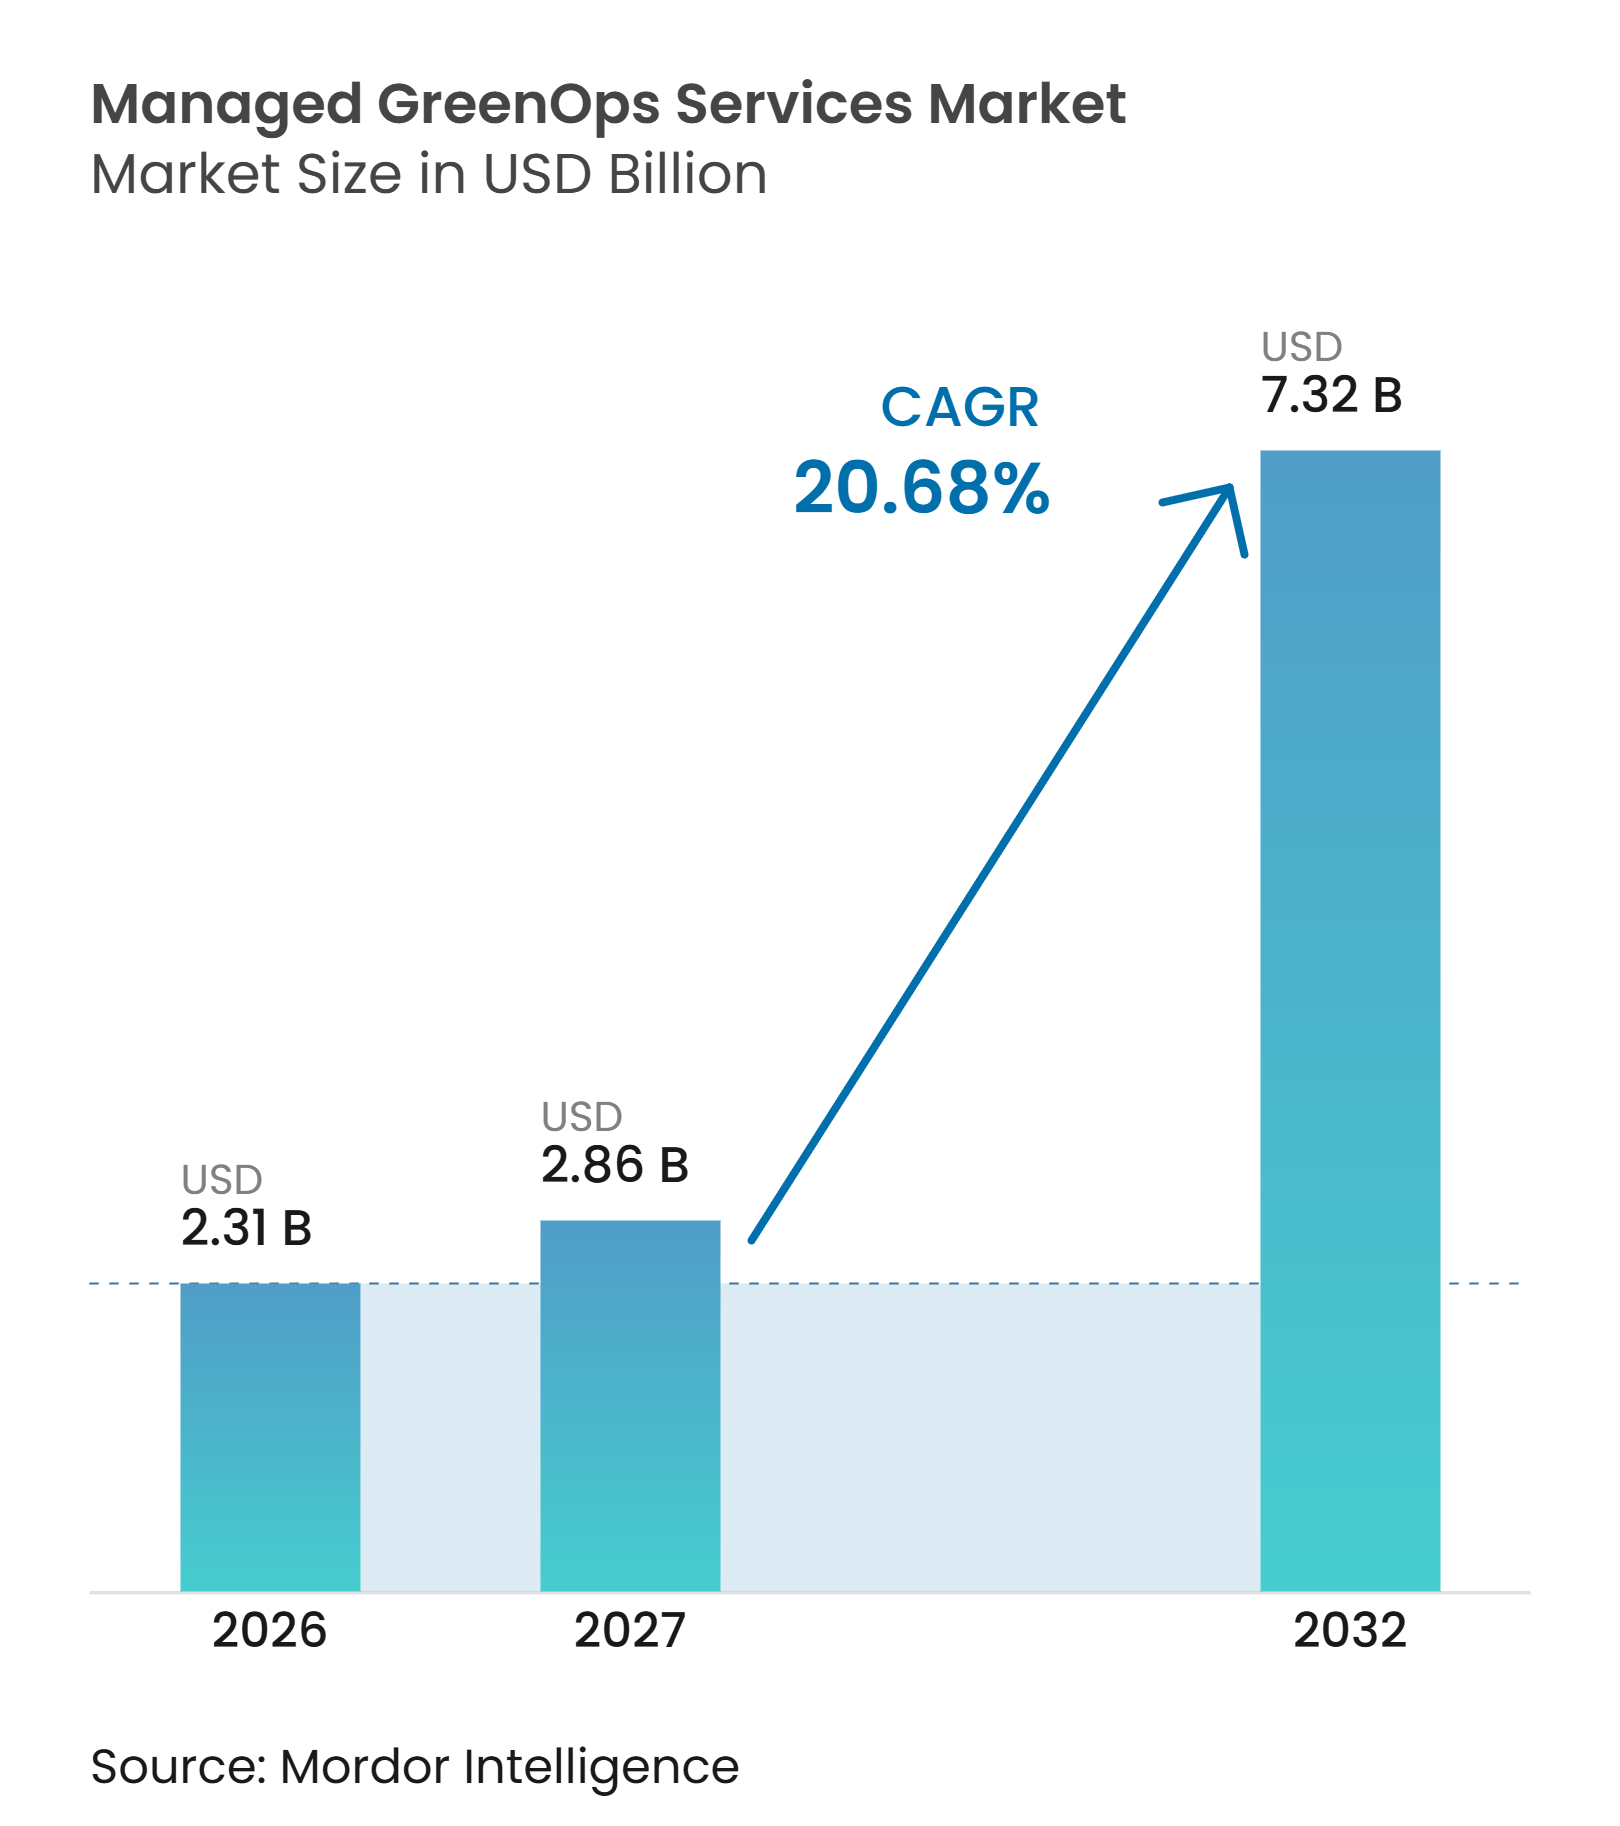
The managed greenops services market size is expected to grow from USD 2.31 billion in 2026 to USD 2.86 billion in 2027, and is forecast to reach USD 7.32 billion by 2032, at a 20.68% CAGR over 2027-2032. The managed GreenOps services market is moving from occasional green-IT reviews toward recurring operational support that enterprises can govern through technology budgets. Climate disclosure rules, AI-related electricity demand, and supply-chain reporting duties are increasing the need for reliable emissions and energy data. Providers can address this need by combining measurement, reporting, optimization, and assurance support within longer contracts. The managed GreenOps services market also benefits when energy savings make sustainability work easier to justify within IT investment plans.
Key Report Takeaways
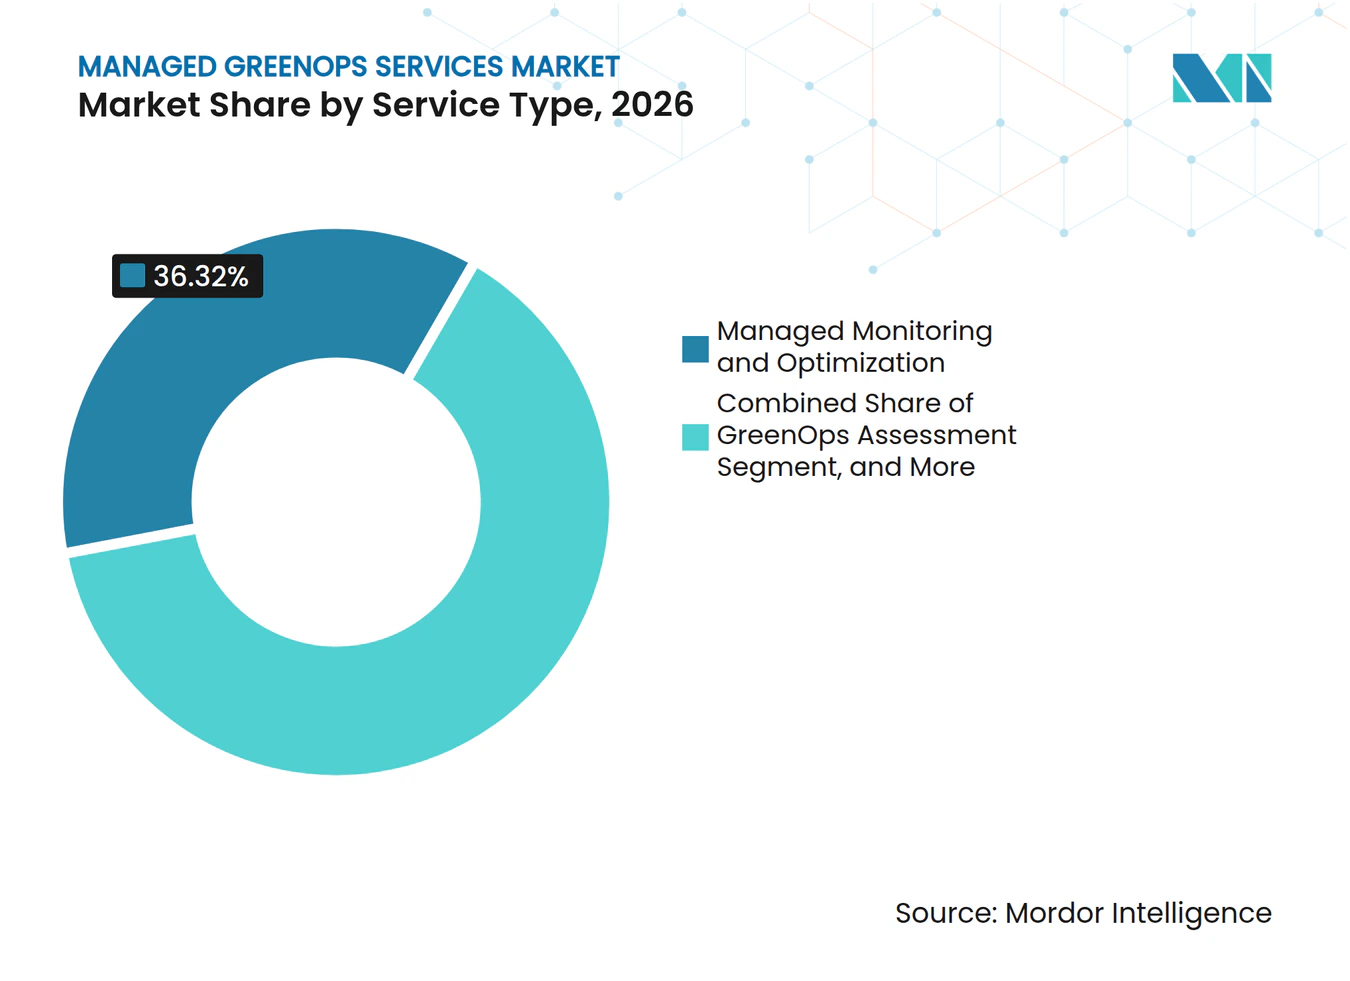
- By service type, Managed Monitoring and Optimization held 36.32% of the managed greenops services market share in 2026, while Carbon, Energy, and Water Reporting and Assurance Support is projected to expand at a 22.73% CAGR through 2032.
- By delivery model, Fully Managed GreenOps accounted for 47.21% of revenue in 2026, while Co-Managed GreenOps is expected to expand at a 23.61% CAGR through 2032.
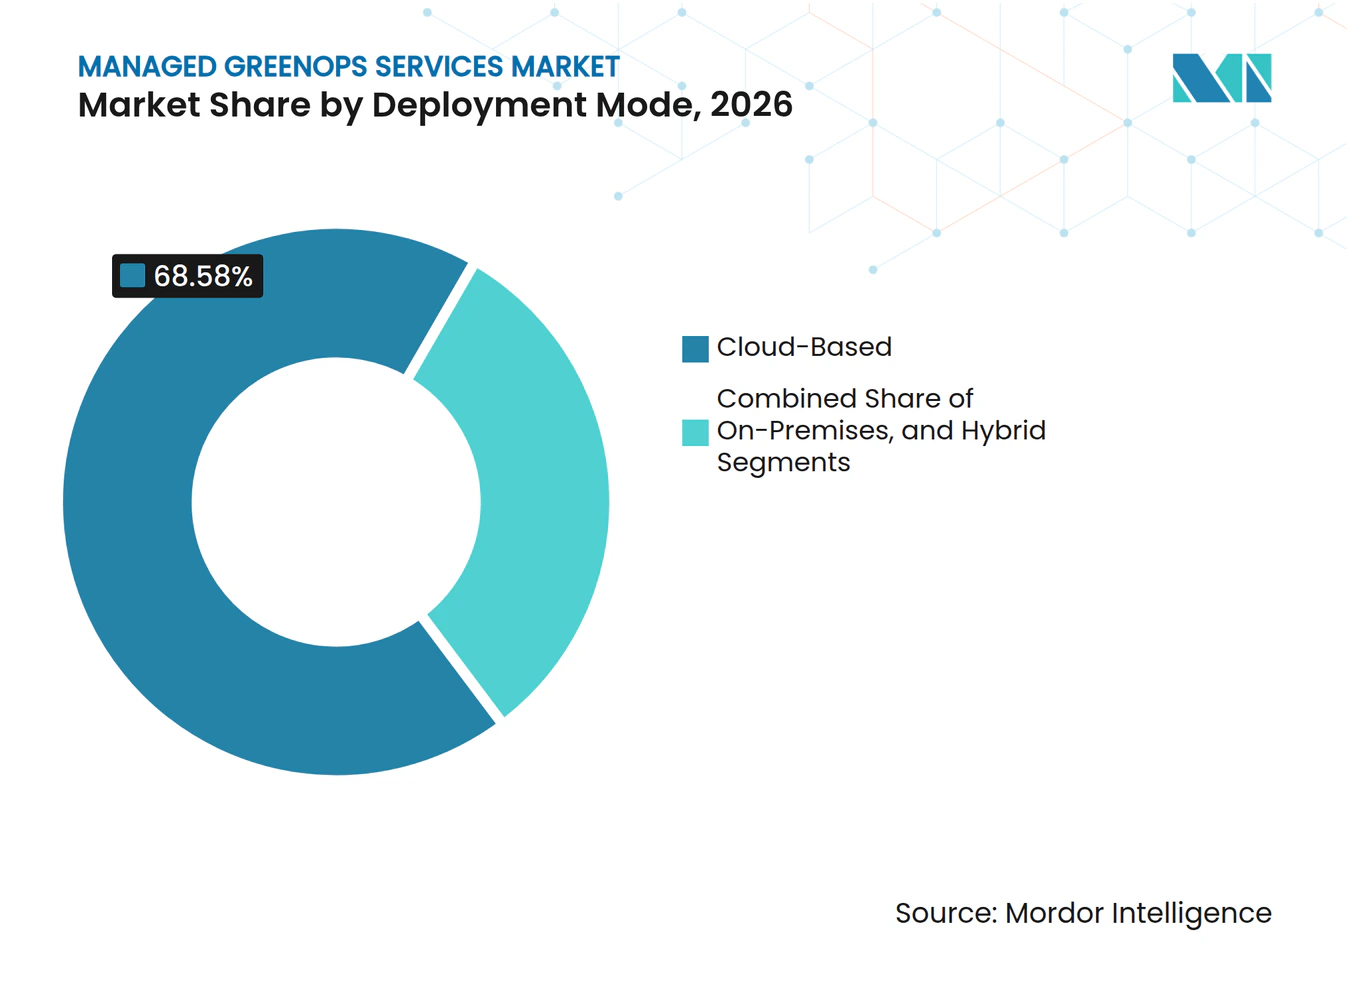
- By deployment mode, Cloud-Based deployment accounted for 68.58% of revenue in 2026 and is projected to grow at a 23.92% CAGR through 2032.
- By organization size, Large Enterprises represented 71.54% of demand in 2026, while Small and Medium-Sized Enterprises are expected to expand at a 23.82% CAGR through 2032.
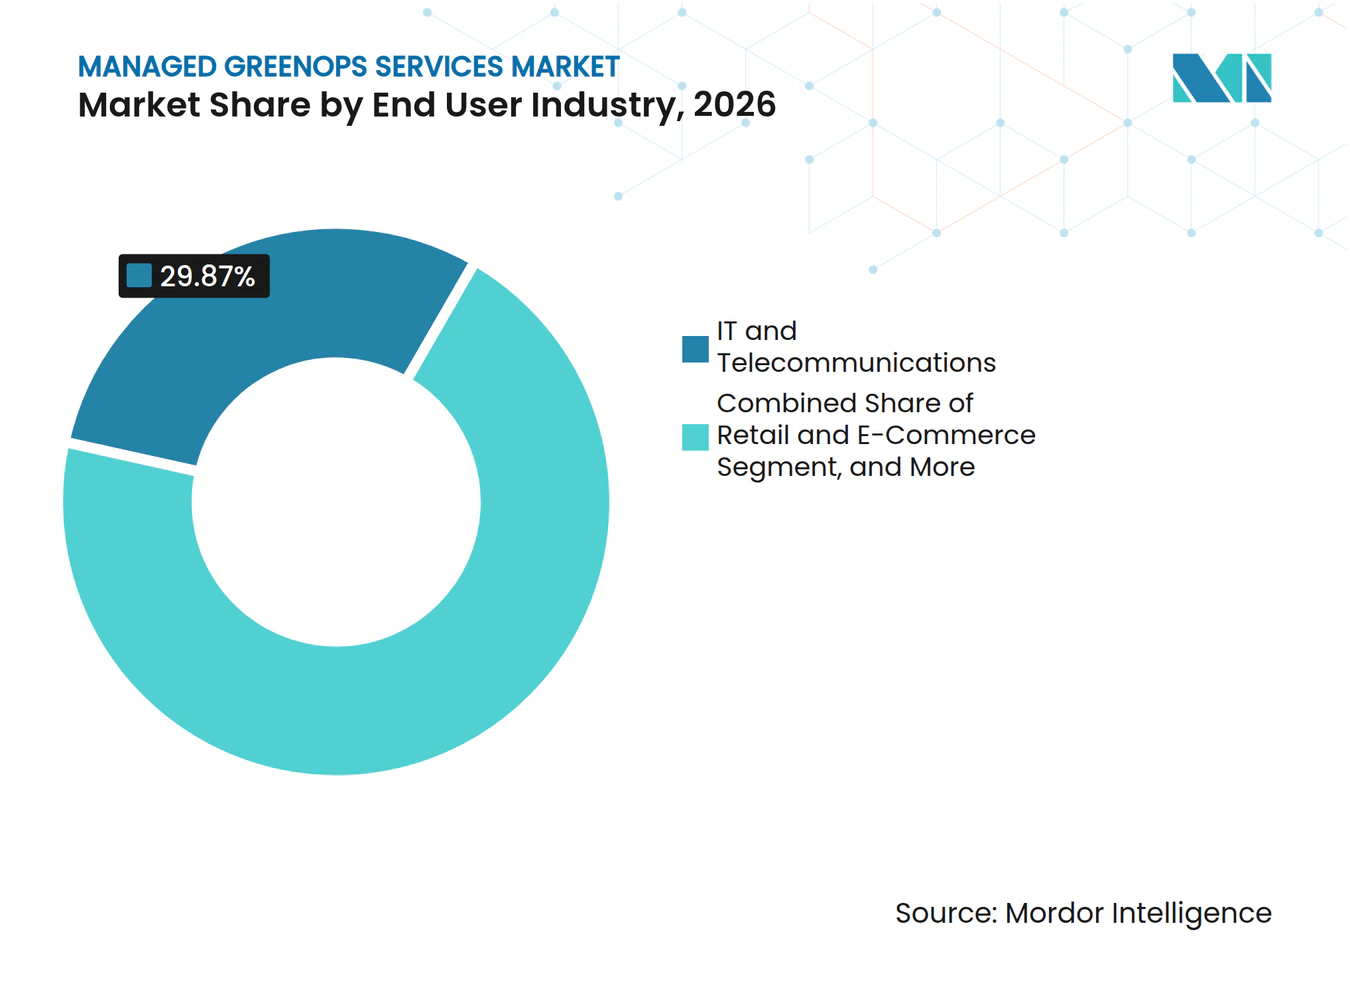
- By industry vertical, IT and Telecommunications accounted for 29.87% of managed greenops services market revenue in 2026, while the healthcare and life sciences industry is projected to expand at a 22.71% CAGR through 2032.
- By sustainability focus area, Carbon and GHG Management held 34.69% of revenue in 2026, while Renewable Energy and Carbon-Free Energy Matching is expected to expand at a 22.86% CAGR through 2032.
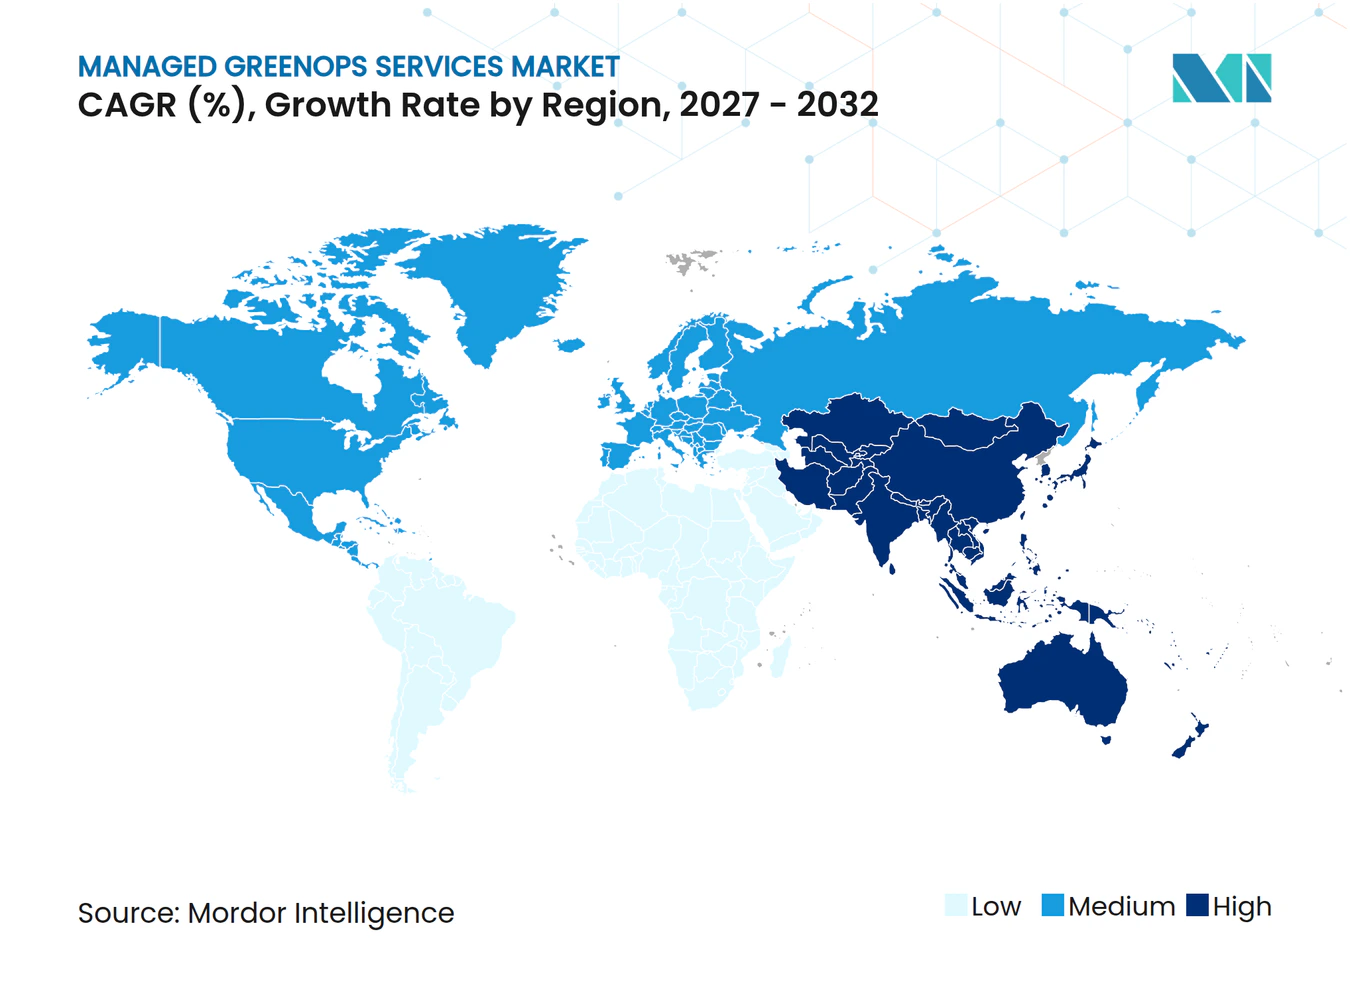
- By geography, North America held 38.64% of the managed greenops services market revenue in 2026, while Asia-Pacific is projected to expand at a 24.86% CAGR through 2032.
Note: Market numbers in this report are based on Mordor Intelligence's proprietary estimation framework, which combines nine months of actuals with Q4 projections for base year 2026.
Market Trends and Insights
Drivers Impact Analysis of Managed GreenOps Services Market*
| Driver | (~) % Impact on CAGR Forecast | Geographic Relevance | Impact Timeline |
|---|---|---|---|
| Mandatory Climate and Digital Sustainability Disclosure | +5.5% | European Union, North America, and Asia-Pacific ISSB adopters | Short term (≤ 2 years) |
| AI and Hyperscale Data Center Electricity Growth | +4.8% | Global, especially North America, East Asia, and Singapore | Medium term (2-4 years) |
| Rising Energy Costs and Faster Green-IT Payback | +4.2% | Europe, North America, and grid-constrained Asia-Pacific markets | Short term (≤ 2 years) |
| Corporate Net-Zero Commitments and Supplier Decarbonization | +3.6% | Global, with early activity in North America and the European Union | Medium term (2-4 years) |
| Carbon-Aware Workload Scheduling Becoming an Operating Control | +2.1% | North America, the European Union, and Asia-Pacific hyperscale hubs | Medium term (2-4 years) |
| Water and Scope 3 Visibility as a Procurement Differentiator | +1.8% | Water-stressed Asia-Pacific, the European Union, and the Middle East | Long term (≥ 4 years) |
| Source: Mordor Intelligence | |||
Mandatory Climate and Digital Sustainability Disclosure
The managed GreenOps services market is supported by reporting rules that require more complete environmental data from large organizations and their suppliers. The first group of companies covered by the European Union’s Corporate Sustainability Reporting Directive reported on financial year 2024 under the European Sustainability Reporting Standards.[1] The revised standards published during 2026 included a value-chain cap that applies from January 2027 and defines the minimum information suppliers need to provide. Double materiality requires organizations to consider environmental effects and climate-related financial risk. That requirement creates separate data workflows that many enterprise systems cannot manage without integration and operating support. Managed providers can therefore help clients establish repeatable processes for collecting, checking, and reporting IT-related information.
AI and Hyperscale Data Center Electricity Growth
The managed GreenOps services market is also shaped by the power needs of AI and hyperscale computing. Global data center electricity demand rose 17% in 2025, while total electricity demand rose 3%, and the IEA expects data center consumption to reach 945 TWh by 2030.[2] AI-focused facilities place additional pressure on organizations to understand the energy and emissions effects of individual workloads. The technology sector’s infrastructure investment has shortened the time available to establish baselines before computing footprints grow. In Germany, data center electricity use reached 25.9 TWh in 2025 and is projected to reach 41.3 TWh by 2035. These conditions increase the value of continuous monitoring and carbon-aware operating controls.
Rising Energy Costs and Faster Green-IT Payback
Higher electricity costs strengthen the financial case for managed energy optimization in large IT estates. A TNO analysis found that moving and consolidating workloads into efficient facilities can deliver 25% total energy savings. This allows organizations to evaluate GreenOps work through operating savings as well as reporting requirements. Schneider Electric reported a 30% reduction in energy consumption and emissions from its own IT infrastructure transformation, compared with its earlier 25% five-year target. Energy cost recovery can make phased service engagements more practical for organizations with constrained technology budgets. It also supports contracts that link monitoring work to measurable operational results.
Corporate Net-Zero Commitments and Supplier Decarbonization
Supplier requirements are extending the managed GreenOps services market beyond direct operations into value-chain data management. A World Bank study found that high-emission suppliers to customers with validated climate targets reduced emissions intensity by 12%. Large customers increasingly need supplier emissions information to support Scope 3 reporting and target delivery. Smaller suppliers often lack the tools and specialist staff needed to meet these requests. Schneider Electric had engaged more than 2,700 supplier companies in its decarbonization programs by September 2025. This relationship creates demand for services that collect supplier data and translate it into usable reporting records.
Restraints Impact Analysis of Managed GreenOps Services Market*
| Restraint | (~) % Impact on CAGR Forecast | Geographic Relevance | Impact Timeline |
|---|---|---|---|
| High Upfront Cost of Sustainable Infrastructure and Retrofitting | -1.2% | Global, especially South and Southeast Asia, the Middle East and Africa, and South America | Medium term (2-4 years) |
| Shortage of GreenOps Engineering and Carbon-Accounting Talent | -0.8% | Global, especially South Asia, the Middle East and Africa, and South America | Medium term (2-4 years) |
| Inconsistent Multi-Cloud Emissions Factors and Allocation Rules | -0.5% | North America, the European Union, and Asia-Pacific multi-cloud environments | Short term (≤ 2 years) |
| Jevons Rebound and Difficulty Proving Absolute Emissions Reduction | -0.3% | Global, especially hyperscale-heavy North America and East Asia | Long term (≥ 4 years) |
| Source: Mordor Intelligence | |||
High Upfront Cost of Sustainable Infrastructure and Retrofitting
The upfront cost of infrastructure renewal can delay managed GreenOps services market adoption. Schneider Electric reported that 36% of United States data centers were more than 10 years old and lacked facility-wide proactive asset management. Cooling, power distribution, and monitoring upgrades compete with AI capacity spending for capital budgets. Organizations may prioritize revenue-producing compute investments when their returns appear sooner. Research published in Nature found that advanced cooling technologies can reduce data center GHG emissions by 15-21% and blue-water use by 31-52%. Providers must therefore structure phased services that recognize both the infrastructure need and the client’s capital constraints.
Shortage of GreenOps Engineering and Carbon-Accounting Talent
A shortage of people who understand both IT operations and carbon accounting limits service capacity. The Institute of Sustainability and Environmental Professionals announced a global Register of Carbon Accountants and Auditors planned for 2026. Formal credentialing can improve trust in reported data, but may also make qualified specialists more difficult and costly to recruit. Providers need teams that can connect emissions methodology, financial assurance, enterprise data, and cloud operations. Thin specialist pools are particularly challenging in regions with fewer established sustainability professions. Co-managed delivery and training services can help clients retain knowledge while providers supply scarce technical expertise.
*Our forecasts treat driver/restraint impacts as directional, not additive. The impact forecasts reflect baseline growth, mix effects, and variable interactions.
Managed GreenOps Services Market Segment Analysis
By Service Type:
Disclosure Needs Change the Service MixManaged Monitoring and Optimization held 36.32% of 2026 revenue. The service supports continuous tracking of IT energy use, emissions, and infrastructure performance. Long-cycle monitoring contracts provide clients with a clearer record of operating conditions over time. Carbon, Energy, and Water Reporting and Assurance Support is expected to expand at a 22.73% CAGR through 2032. Reporting support is strengthened by disclosure rules that require auditable environmental data. IBM made its Envizi Emissions API generally available in April 2026.[3] The release allows providers to integrate GHG Protocol-aligned calculations into enterprise workflows. This can reduce the effort required to link emissions data with existing ERP records. It also gives clients a way to apply the same calculation logic across reporting cycles.
Training, Change Management, and Capability Transfer addresses the skills gap that can undermine technology-led programs. It is especially relevant to co-managed engagements that require client teams to take on defined responsibilities. Training also helps organizations use reporting tools and operational data consistently after the initial implementation. Other services include circular IT asset tracking and water stewardship program management. These activities gain relevance when clients must address resource-use and water disclosure requirements. The managed GreenOps services industry can use these adjacent services to extend engagement scope without separating sustainability data from IT operations. A broader service mix also helps providers respond when clients face different compliance deadlines. It gives buyers a route from limited reporting support to more continuous operational management. This gradual transition can help clients align service scope with their internal capability and reporting timetable.



By Delivery Model:
Co-Managed Services Build Internal CapabilityFully Managed GreenOps accounted for 47.21% of 2026 revenue. Large enterprises often select this approach when they want a provider to operate the full sustainability function for IT. This model can centralize data collection, monitoring, reporting, and optimization under a single service arrangement. Co-Managed GreenOps is projected to expand at a 23.61% CAGR through 2032. The model allows companies to keep governance and decision rights while providers carry out technical work. This arrangement fits organizations that need outside capability but do not want to lose internal visibility. It can also support named accountability roles under corporate reporting frameworks. The combination of shared responsibility and knowledge transfer explains its appeal. It can also make provider support easier to integrate with existing governance structures and internal reporting responsibilities.
Staff Augmentation and Expert-on-Demand serves organizations facing short compliance deadlines or narrow supplier assessments. These customers may not need a full managed services commitment for every requirement. Specialist support can fill gaps in emissions methods, assurance preparation, and cloud operations. The managed GreenOps services market therefore includes engagements with different levels of provider responsibility. Co-managed structures also reflect a preference for building knowledge within the client organization. Buyers may treat this capability as a strategic asset that should remain available after a contract ends. Providers that document processes and transfer skills can make this preference part of the service design. This creates a practical bridge between short-term support and longer managed engagements. It allows organizations to increase provider involvement when their operating requirements become more complex or more frequent.
By Deployment Mode:
Cloud Scale Raises Accountability NeedsCloud-Based deployment held 68.58% of 2026 revenue. It is also projected to expand at a 23.92% CAGR through 2032. Cloud-native estates generate substantial volumes of usage and cost data that can support emissions measurement. Yet organizations using several cloud providers can face inconsistent allocation methods and reporting outputs. Managed services can normalize these inputs and create a clearer operating view. The managed GreenOps services market is supported when buyers need a single process across different cloud environments. Providers can also connect cloud data with enterprise reporting and supplier information. This is important when technology teams and sustainability teams use different systems. A common operating process can reduce duplication and make reported information easier for both groups to review.
On-premises and hybrid deployments remain important for organizations with data sovereignty, latency, or legacy system requirements. Banking, government, and industrial manufacturing can retain significant local infrastructure for these reasons. Germany’s Energy Efficiency Act requires a Power Usage Effectiveness value of no more than 1.2 for new data centers from 2026.[4] This requirement increases attention on facility monitoring and efficiency management. Hybrid estates need consistent data methods across local assets and cloud services. That operating complexity can create a role for managed monitoring teams. It also encourages services that link infrastructure decisions with corporate disclosure requirements. Organizations can then assess performance without treating each hosting environment as a separate reporting problem. The approach is useful where local infrastructure remains important alongside cloud workloads and externally hosted applications.

By Organization Size:
Supplier Requirements Extend Demand to SMEsLarge Enterprises represented 71.54% of the managed GreenOps services market demand in 2026. These organizations were early adopters because many had public climate targets and more complex IT estates. They also have the resources to establish broader reporting and assurance processes. Small and Medium-Sized Enterprises are projected to expand at a 23.82% CAGR through 2032. Supplier data requests from larger customers are drawing smaller organizations into climate reporting. The January 2027 value-chain cap under the revised European standards also establishes a clearer minimum information request for suppliers. This reduces uncertainty about the data that SMEs may need to produce. It also makes managed packages more accessible and relevant. Smaller organizations can focus on the records requested by customers instead of attempting a broad platform implementation at the outset.
The World Bank found that supplier relationships with validated climate-target customers were associated with a 12% reduction in emissions intensity. This evidence shows why supply-chain requirements can influence operations beyond the largest companies. SMEs need services that provide credible calculations without the cost of a large enterprise platform. Subscription pricing and limited-scope implementation can match that need. Schneider Electric’s Zeigo Activate is designed to help SMEs estimate, track, and reduce Scope 3 supply-chain emissions. The managed GreenOps services industry can use similar offerings to serve clients with limited internal resources. Simpler packages may also help suppliers meet customer requests before they become a barrier to commercial relationships. This widens adoption while keeping the service aligned with the customer’s level of maturity. It also lets providers offer a clear progression from basic emissions calculations to more detailed supplier and operational reporting.
By End User Industry:
Disclosure Requirements Create Different Adoption PatternsIT and Telecommunications held 29.87% of 2026 revenue. The sector is both a major electricity user and a provider of digital infrastructure for other industries. Its companies also manage complex cloud, network, and data center footprints. The healthcare and life sciences industry is projected to expand at a 22.71% CAGR through 2032. The sector faces investor attention on pharmaceutical supply-chain emissions and energy-intensive equipment. It also depends on reliable data practices in regulated operating environments. These conditions increase the need for controls that connect environmental data with established reporting processes. Managed support can help organizations maintain that connection across facilities and suppliers. Sector-specific operating requirements can determine which data sources receive attention first and which controls require regular review.
Banking, Financial Services, and Insurance (BFSI) organizations are incorporating sustainability data into climate-risk analysis and financed emissions reporting. Their requirements can include data center and cloud Scope 3 Category 15 calculations. The work can link IT operations with risk functions and board reporting. This makes vertical knowledge important to the managed GreenOps services market. Providers need to understand the data structures and assurance expectations that apply to financial institutions. They also need to translate operational measurements into information that risk teams can use. Healthcare, finance, and telecommunications may therefore adopt managed services in different sequences. The shared need is a consistent record that can withstand internal review and external reporting expectations. Providers that adapt their delivery model to each vertical can avoid treating every client as a generic infrastructure account. This approach recognizes that reporting expectations and technology estates differ across regulated and infrastructure-intensive sectors.
By Sustainability Focus Areas:
Carbon Reporting Remains the FoundationCarbon and GHG Management held 34.69% of 2026 revenue. It provides the base for Scope 1, Scope 2, and Scope 3 inventories, verification, and reporting across several frameworks. Most managed engagements begin with data collection and a dependable emissions record. Renewable Energy and Carbon-Free Energy Matching is projected to expand at a 22.86% CAGR through 2032. Hour-by-hour matching requires more detailed measurement than annual accounting of renewable energy certificates. The IEA reported that the technology sector accounted for 40% of corporate renewable power purchase agreements signed in 2025. This expands the number of energy commitments that organizations need to monitor. Managed services can support the data and operating controls required for those commitments. They can also help clients connect contractual renewable-energy commitments with the electricity data used in corporate reporting.
Water Stewardship is becoming increasingly important as AI-focused data center development puts pressure on local water resources. CDP has highlighted the need for companies to use water-related information in long-term resilience planning. Energy Efficiency and Workload Optimization addresses operational emissions through facility efficiency and carbon-aware scheduling. Circular IT and E-Waste Management also gains relevance where resource-use and circular economy disclosures apply. These focus areas show that the managed GreenOps services market is not limited to carbon inventories. They require data that moves between facilities, cloud operations, procurement teams, and reporting functions. Providers can use that connection to make sustainability work more useful to operating teams. The scope of the engagement can then extend from compliance records to day-to-day resource decisions. This broader remit reflects the links between cloud workloads, facilities management, procurement, and environmental reporting.
Geography Analysis
The Americas Managed GreenOps Services Market
North America held 38.64% of the Managed GreenOps Services market share in 2026. The region has the largest concentration of hyperscale data center capacity and a large base of organizations with complex cloud estates. The United States accounted for 45% of global data center electricity consumption. Data centers are also expected to account for nearly half of the United States electricity demand growth through 2030. These conditions make energy measurement, workload optimization, and cloud reporting practical priorities. South America is an emerging area of demand, with Brazil supported by a renewables-dominant electricity mix and expanding multinational manufacturing activity. Cross-border supply chains can increase the need for supplier information among companies serving customers in Europe and the United States.
Europe Managed GreenOps Services Market
Europe is the most regulation-focused geography for the managed GreenOps services market. CSRD, ESRS, and national energy-efficiency rules create overlapping requirements that can produce continuing disclosure work. The revised ESRS, published in 2026, retained double materiality and introduced phased relief for certain reporting requirements. Germany’s data center electricity use reached 25.9 TWh in 2025 and is projected to reach 41.3 TWh by 2035. The country’s data center register found that 80% of registered facilities would source 100% of their electricity bilaterally from renewables in 2026.
APAC and Middle East Managed GreenOps Services Market
Asia-Pacific is projected to expand at a 24.86% CAGR through 2032. Data center construction and carbon-neutrality policies are progressing simultaneously in China, India, Japan, South Korea, Singapore, and Australia. Japan’s Watt-Bit Coordination initiative, published in June 2025, connected data center build-out with renewable-energy grid integration. Japan also launched a zero-emission data center promotion program in July 2025 that supports renewable energy adoption and resilience upgrades. The managed GreenOps services market can support this policy direction through workload-level accounting and assurance activities. Middle East demand is growing alongside investment in hyperscale AI and digital sovereignty infrastructure. These projects create an operating base for GreenOps services before disclosure obligations become more widespread.
Competitive Landscape
Market Concentration
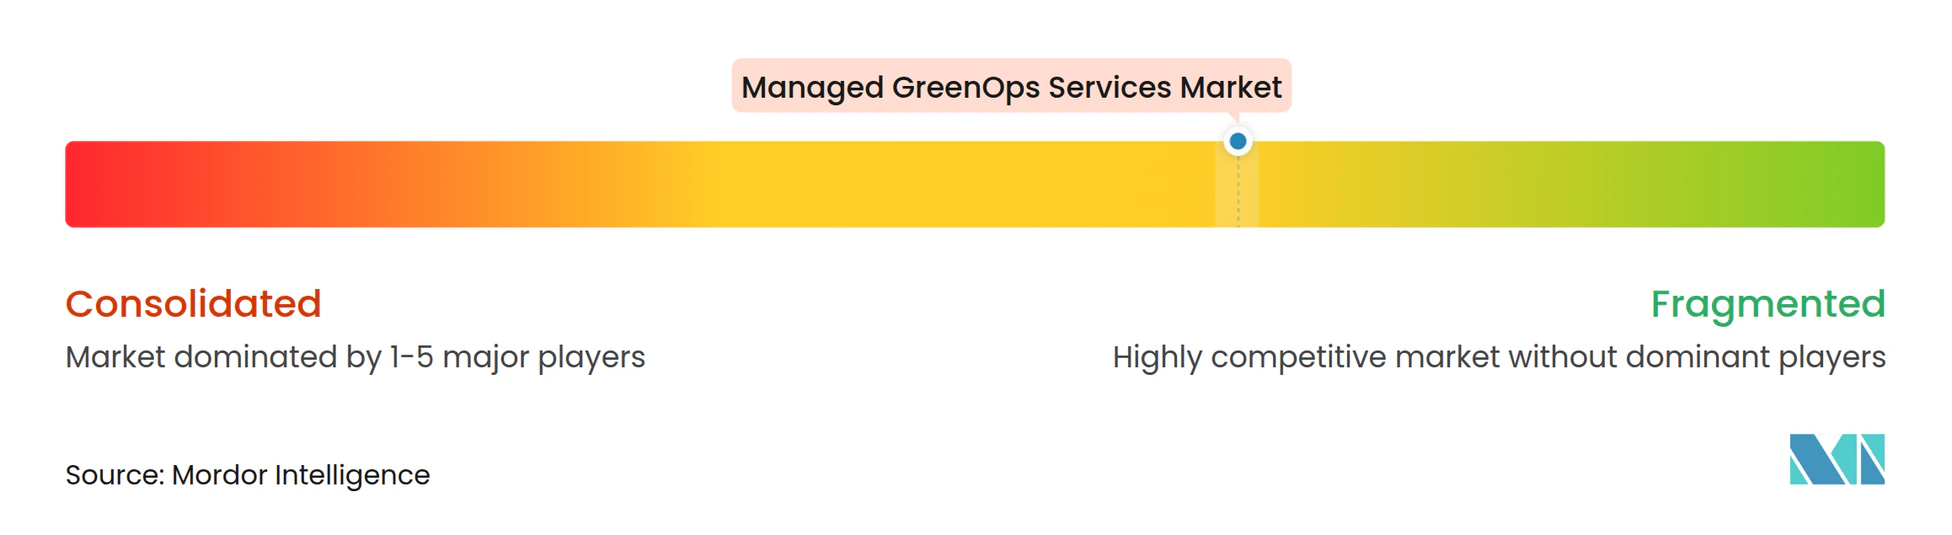
The managed GreenOps services market is moderately fragmented. Global IT services integrators, cloud hyperscalers, energy-management specialists, and focused GreenOps platforms compete across different parts of the service stack. Large providers compete through broad portfolios, cloud partnerships, and integrations with established disclosure frameworks. Specialist vendors compete through more detailed workload measurement, real-time carbon signals, and outcome-linked pricing. Kyndryl received the Google Cloud Ready, Energy and Carbon designation in June 2025. The designation supports Kyndryl’s work on carbon-efficient workload mapping and sustainable AI services. Partnerships of this kind can give providers access to cloud-native enterprise buyers.
Technological depth is becoming an increasingly important basis for competition in the managed GreenOps services market. Providers are investing in carbon-aware scheduling, supplier data intake, and automated sustainability reporting. IBM launched the Envizi Emissions API on April 28, 2026. The API allows organizations and service providers to embed GHG Protocol-aligned calculations into their own systems. This move supports a model in which managed providers use calculation engines within their service workflows. Focused vendors such as Greenpixie, SYNYEGA, and Nordcloud seek to differentiate through cloud-native, workload-level emissions data. Their position reflects continued demand for measurement detail that may not be consistent across standard cloud footprint tools.
Accenture completed the acquisition of a 65% majority stake in DLB Associates in January 2026. The transaction added data center engineering capability that can support energy optimization and site planning. Schneider Electric introduced EcoConsult for Data Centers in April 2025 with a network of more than 250 consultants and 6,500 service representatives. These moves show that providers are combining software, infrastructure expertise, and operational services. The managed GreenOps services market does not include a reported combined market share for the leading providers.
Managed GreenOps Services Industry Leaders
-
Accenture plc
-
Atos SE
-
Capgemini SE
-
Deloitte Touche Tohmatsu Limited
-
IBM Corporation
- *Disclaimer: Major Players sorted in no particular order
Managed GreenOps Services Market Companies Covered in this Report
- Accenture plc
- Atos SE
- Capgemini SE
- Deloitte Touche Tohmatsu Limited
- IBM Corporation
- HCL Technologies Limited
- Hewlett Packard Enterprise Company
- Cognizant Technology Solutions Corporation
- Infosys Limited
- Kyndryl Holdings, Inc.
- LTIMindtree Limited
- NTT DATA Group Corporation
- Tata Consultancy Services Limited
- Tech Mahindra Limited
- Wipro Limited
- Amazon Web Services, Inc.
- Microsoft Corporation
- Google LLC
- Flexera Software LLC
- Greenpixie Ltd.
- SYNYEGA LIMITED
- Xebia Group N.V.
- Version 1 Group Limited
- Nordcloud Oy
- Schneider Electric SE
Recent Industry Developments in Managed GreenOps Services Market
- April 2026: IBM announced the general availability of the Envizi Emissions API, making its GHG Protocol-aligned emissions calculation engine available as an embeddable API for organizations, developers, and managed service providers. The release enables third-party GreenOps service platforms to integrate verified emissions calculations directly into ERP workflows without deploying the full IBM Envizi ESG Suite, significantly reducing integration complexity and client onboarding timelines.
- September 2025: Schneider Electric announced expanded global supply chain decarbonization programs at Climate Week NYC, having engaged more than 2,700 supplier companies worldwide and facilitated procurement of 752,000 MWh of renewable electricity via Energy Attribute Certificates. Additionally, 19 companies participating in 4 multi-buyer PPA cohorts collectively secured over 1.3 TWh of aggregate renewable electricity, demonstrating the managed services throughput required to operationalize supplier-level decarbonization at enterprise scale.
- June 2025: Kyndryl achieved the Google Cloud Ready - Energy and Carbon designation and expanded collaboration with Google Cloud, enabling Kyndryl Consult to partner on customer sustainability projects including carbon-efficient workload mapping and sustainable LLM development via the Kyndryl Bridge AI platform. The designation made Kyndryl 1 of the first managed services providers offering validated AI-powered carbon-efficiency services in the Google Cloud Partner Advantage Program.
- April 2025: Schneider Electric unveiled EcoConsult for Data Centers at Data Center World in Washington, D.C., a consulting service backed by a global network of more than 250 consultants and 6,500+ service representatives, delivering infrastructure efficiency assessments and actionable roadmaps for data center energy, uptime, and lifecycle optimization.
Global Managed GreenOps Services Market Report Scope
Managed GreenOps services market to help organizations measure, manage, and reduce the environmental impact of their digital infrastructure, particularly cloud, data center, and AI workloads. Services typically include carbon, energy, and water-usage tracking; workload and architecture optimization; sustainability reporting; and alignment with environmental, regulatory, and cost-efficiency goals.
The Managed GreenOps Services Market Report is Segmented by Service Type (GreenOps Assessment and Maturity Benchmarking, GreenOps Strategy and Operating-Model Design, Implementation and Systems Integration, Managed Monitoring and Optimization, Carbon, Energy, and Water Reporting and Assurance Support, Training, Change Management, and Capability Transfer, and Other Service Types), Delivery Model (Fully Managed GreenOps, Co-Managed GreenOps, and Staff Augmentation and Expert-on-Demand), Deployment Mode (Cloud-Based, On-Premises, and Hybrid), Organization Size (Large Enterprises, and Small and Medium-Sized Enterprises), End User Industry (Banking, Financial Services and Insurance (BFSI), IT and Telecommunications, Healthcare and Life Sciences, Government and Public Administration, Industrial Manufacturing, Retail and E-Commerce, and Other End-User Industries), Sustainability Focus Areas (Carbon and GHG Management, Energy Efficiency and Workload Optimization, Water Stewardship, Renewable Energy and Carbon-Free Energy Matching, Circular IT and E-Waste Management, and Other Sustainability Focus Areas), and Geography (North America, South America, Europe, Asia-Pacific, Middle East, and Africa). The Market Forecasts are Provided in Terms of Value (USD).
Segmentation Overview
| GreenOps Assessment and Maturity Benchmarking |
| GreenOps Strategy and Operating-Model Design |
| Implementation and Systems Integration |
| Managed Monitoring and Optimization |
| Carbon, Energy, and Water Reporting and Assurance Support |
| Training, Change Management, and Capability Transfer |
| Other Service Types |
| Fully Managed GreenOps |
| Co-Managed GreenOps |
| Staff Augmentation and Expert-on-Demand |
| Cloud-Based |
| On-Premises |
| Hybrid |
| Large Enterprises |
| Small and Medium Enterprises |
| Banking, Financial Services and Insurance (BFSI) |
| IT and Telecommunications |
| Healthcare and Life Sciences |
| Government and Public Administration |
| Industrial Manufacturing |
| Retail and E-Commerce |
| Other End-User Industries |
| Carbon and GHG Management |
| Energy Efficiency and Workload Optimization |
| Water Stewardship |
| Renewable Energy and Carbon-Free Energy Matching |
| Circular IT and E-Waste Management |
| Other Sustainability Focus Areas |
| North America | United States |
| Canada | |
| Mexico | |
| South America | Brazil |
| Argentina | |
| Rest of South America | |
| Europe | Germany |
| United Kingdom | |
| France | |
| Italy | |
| Rest of Europe | |
| Asia-Pacific | China |
| India | |
| Japan | |
| South Korea | |
| Rest of Asia-Pacific | |
| Middle East | Saudi Arabia |
| United Arab Emirates | |
| Rest of Middle East | |
| Africa | South Africa |
| Nigeria | |
| Rest of Africa |
| By Service Type | GreenOps Assessment and Maturity Benchmarking | |
| GreenOps Strategy and Operating-Model Design | ||
| Implementation and Systems Integration | ||
| Managed Monitoring and Optimization | ||
| Carbon, Energy, and Water Reporting and Assurance Support | ||
| Training, Change Management, and Capability Transfer | ||
| Other Service Types | ||
| By Delivery Model | Fully Managed GreenOps | |
| Co-Managed GreenOps | ||
| Staff Augmentation and Expert-on-Demand | ||
| By Deployment Mode | Cloud-Based | |
| On-Premises | ||
| Hybrid | ||
| By Organization Size | Large Enterprises | |
| Small and Medium Enterprises | ||
| By End User Industry | Banking, Financial Services and Insurance (BFSI) | |
| IT and Telecommunications | ||
| Healthcare and Life Sciences | ||
| Government and Public Administration | ||
| Industrial Manufacturing | ||
| Retail and E-Commerce | ||
| Other End-User Industries | ||
| By Sustainability Focus Areas | Carbon and GHG Management | |
| Energy Efficiency and Workload Optimization | ||
| Water Stewardship | ||
| Renewable Energy and Carbon-Free Energy Matching | ||
| Circular IT and E-Waste Management | ||
| Other Sustainability Focus Areas | ||
| By Geography | North America | United States |
| Canada | ||
| Mexico | ||
| South America | Brazil | |
| Argentina | ||
| Rest of South America | ||
| Europe | Germany | |
| United Kingdom | ||
| France | ||
| Italy | ||
| Rest of Europe | ||
| Asia-Pacific | China | |
| India | ||
| Japan | ||
| South Korea | ||
| Rest of Asia-Pacific | ||
| Middle East | Saudi Arabia | |
| United Arab Emirates | ||
| Rest of Middle East | ||
| Africa | South Africa | |
| Nigeria | ||
| Rest of Africa | ||
Key Questions Answered in the Report
What is the Managed GreenOps Services market size?
The Managed GreenOps Services market size is expected to grow from USD 2.31 billion in 2026 to USD 2.86 billion in 2027 and is forecast to reach USD 7.32 billion by 2032 at 20.68% CAGR over 2027-2032.
What is driving demand for managed GreenOps services?
Climate disclosure requirements, AI-related data center electricity demand, energy costs, and Scope 3 supplier requirements are increasing demand for continuous measurement and reporting support.
Which service type leads Managed GreenOps Services?
Managed Monitoring and Optimization leads with 36.32% revenue share in 2026, while reporting and assurance support has the highest projected CAGR at 22.73%.
Why are cloud-based GreenOps services important?
Cloud-Based deployment held 68.58% of revenue in 2026 and has the highest projected CAGR at 23.92%, reflecting the complexity of measuring emissions across multi-cloud environments.
Which organizations are adopting managed GreenOps services fastest?
Small and Medium-Sized Enterprises have the highest projected CAGR at 23.82% as supply-chain reporting expectations extend beyond large corporate buyers.
Which region has the strongest outlook for managed GreenOps services?
Asia-Pacific has the highest projected CAGR at 24.86% through 2032, supported by data center expansion and changing carbon-neutrality policies.