
Network Cloud Cost Optimization Market Size and Share
Market Overview
| Study Period | 2020 - 2031 |
|---|---|
| Market Size (2026) | USD 2.23 Billion |
| Market Size (2031) | USD 4.79 Billion |
| Growth Rate (2026 - 2031) | 16.52 % |
| Fastest Growing Market | Asia-Pacific |
| Largest Market | North America |
| Market Concentration | Medium |
Major Players *Disclaimer: Major Players sorted in no particular order Image © Mordor Intelligence. Reuse requires attribution under CC BY 4.0. | |
Network Cloud Cost Optimization Market Analysis by Mordor Intelligence
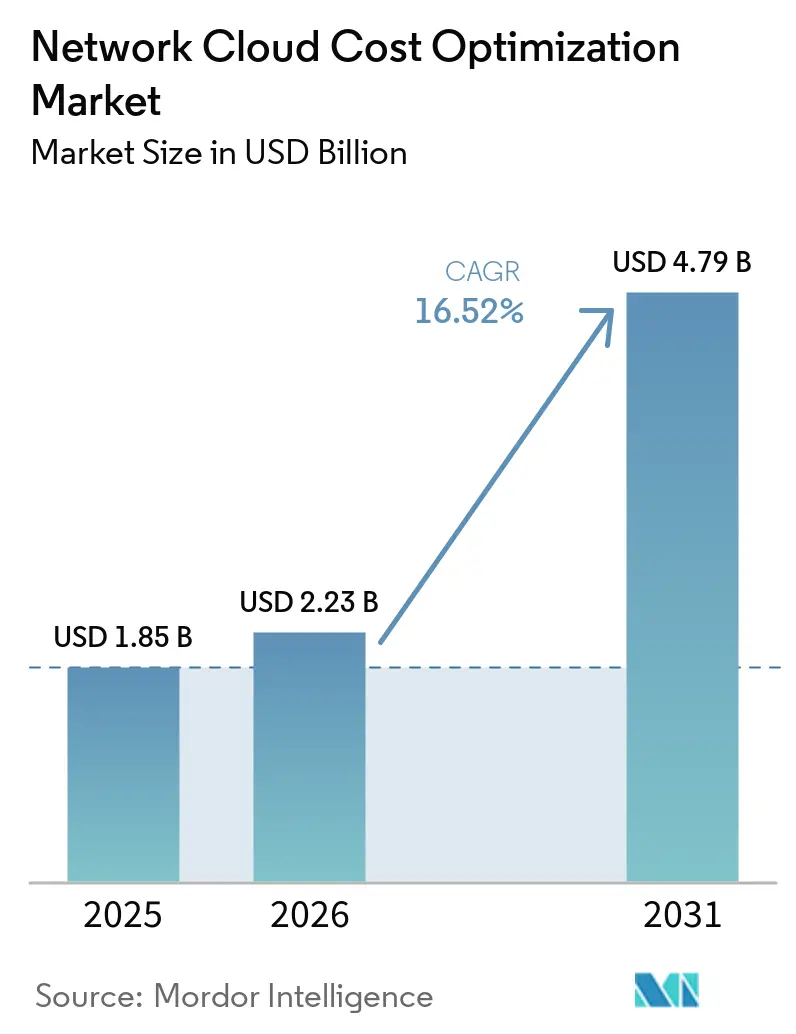
The Network cloud cost optimization market size was valued at USD 1.85 billion in 2025 and is estimated to grow from USD 2.23 billion in 2026 to reach USD 4.79 billion by 2031, at a CAGR of 16.52% during the forecast period (2026-2031). Generative AI workloads, container platforms, and multi-cloud deployments are increasing the need for more precise control over compute, storage, and data transfer spending. Buyers are moving beyond periodic bill reviews toward tools that connect costs with workloads, teams, products, and traffic paths. Independent platforms remain relevant because native cloud provider consoles typically focus on a single provider and do not offer a cross-cloud view. The Network cloud cost optimization market is also drawing more demand for managed services as organizations seek help turning cost data into operational action. Consolidation is likely to favor vendors that combine visibility, automated optimization, and financial governance capabilities.
Key Report Takeaways
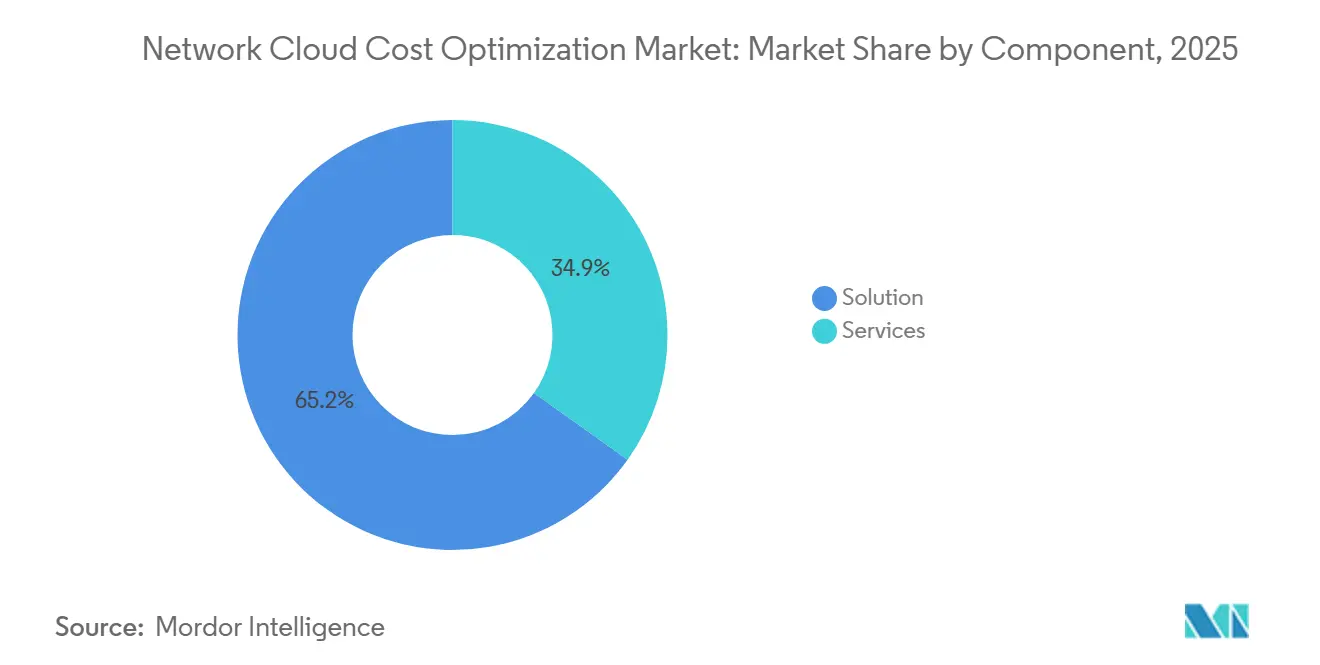
- By component, solutions held a 65.15% share of the network cloud cost optimization market size in 2025, while services are projected to expand at an 18.46% CAGR through 2031.
- By deployment mode, cloud deployment held 71.56% revenue share in 2025, while on-premises deployment is projected to expand at an 18.32% CAGR through 2031.
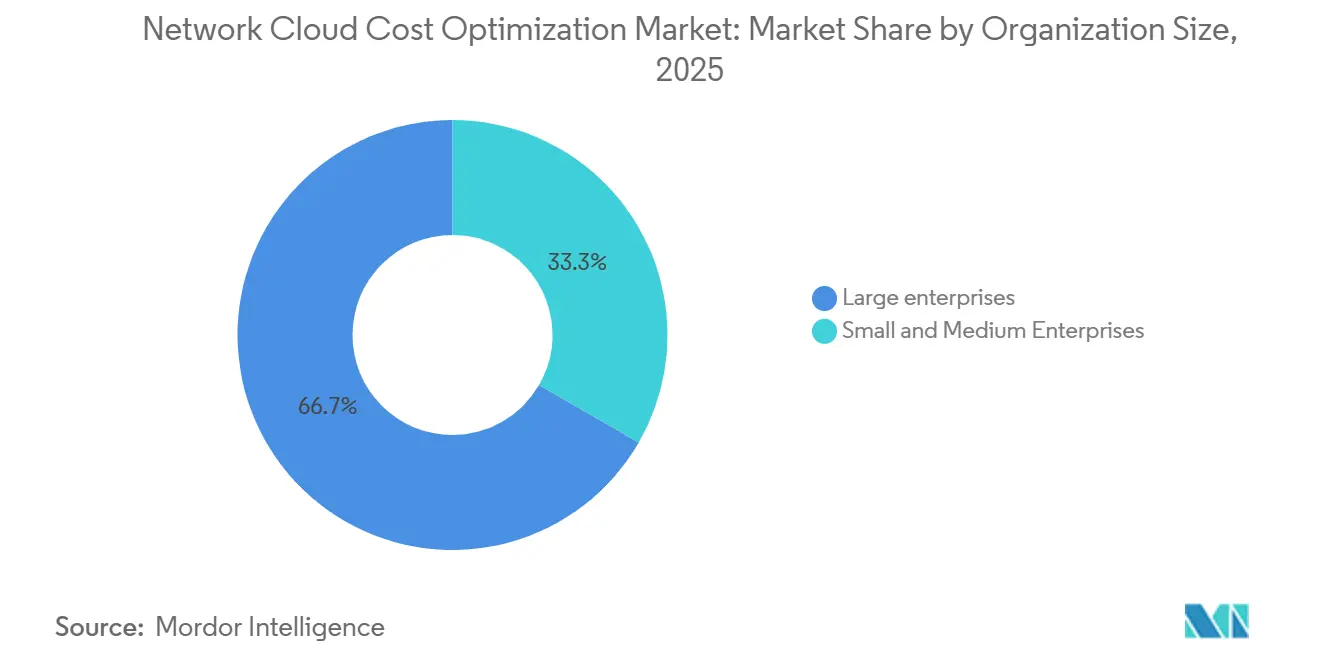
- By organization size, large enterprises held 66.67% share of the network cloud cost optimization market size in 2025, while SMEs are projected to expand at an 18.52% CAGR through 2031.
- By application, cloud resource rightsizing held 36.25% revenue share in 2025, while Kubernetes and container cost management is projected to expand at an 18.48% CAGR through 2031.
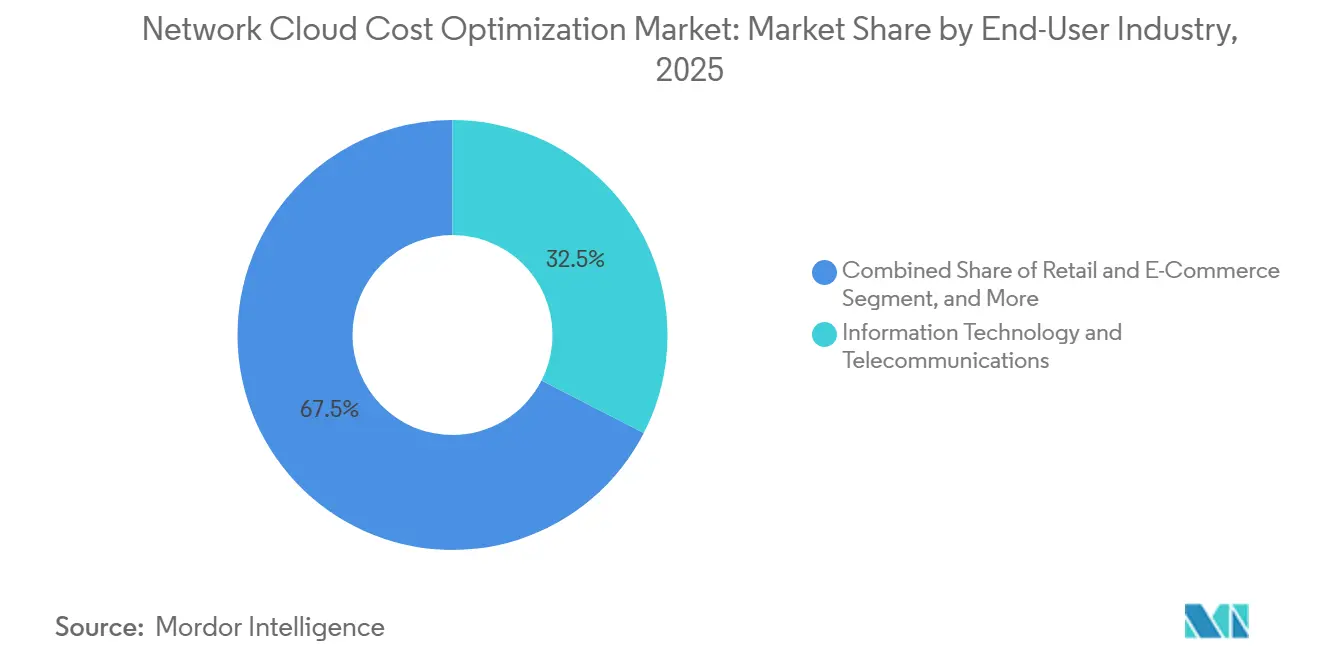
- By end-user industry, information technology and telecommunications held 32.54% share of the network cloud cost optimization market size in 2025, while BFSI is projected to expand at an 18.72% CAGR through 2031.
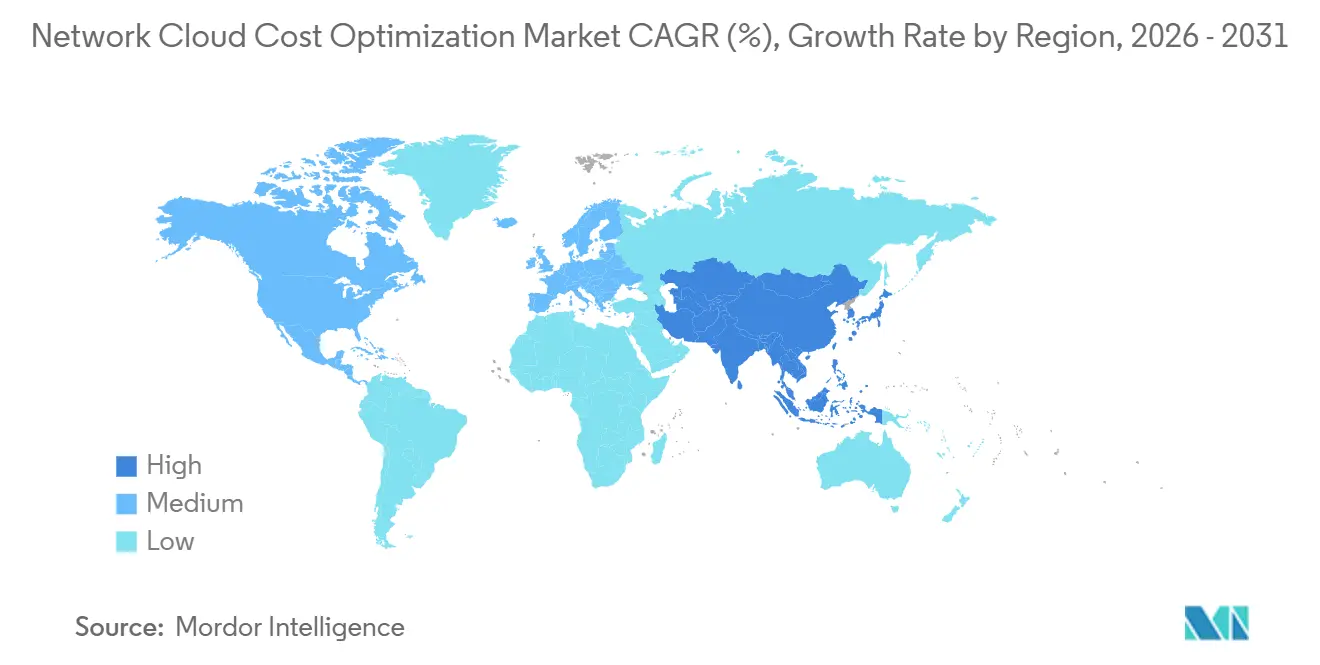
- By geography, North America held 37.45% share of the network cloud cost optimization market size in 2025, while Asia-Pacific is projected to expand at an 18.51% CAGR through 2031.
Note: Market size and forecast figures in this report are generated using Mordor Intelligence’s proprietary estimation framework, updated with the latest available data and insights as of January 2026.
Market Trends and Insights
Drivers Impact Analysis of Network Cloud Cost Optimization Market*
| Driver | (~) % Impact on CAGR Forecast | Geographic Relevance | Impact Timeline |
|---|---|---|---|
| Multi-Cloud and Hybrid-Cloud Cost Complexity | +3.5% | Global, with greatest intensity in North America and Europe | Short term (≤ 2 years) |
| Growth of AI and Data-Intensive Network Workloads | +2.8% | Global, with rapid adoption in Asia-Pacific and North America | Short term (≤ 2 years) |
| Rising Demand for FinOps and Cloud Financial Governance | +2.3% | North America and Europe, with early gains in Asia-Pacific and the Middle East and Africa | Medium term (2-4 years) |
| Need for Real-Time Network Egress and Traffic-Path Economics | +1.8% | Global, concentrated in multi-cloud and hybrid architectures | Short term (≤ 2 years) |
| FinOps-as-Code and Automated Policy Enforcement | +1.4% | North America and Western Europe, with growing use in Asia-Pacific | Medium term (2-4 years) |
| Expansion Into SaaS, Kubernetes, and Private Infrastructure | +1.0% | Global, with notable momentum in Germany, the United Kingdom, and Japan | Long term (≥ 4 years) |
| Source: Mordor Intelligence | |||
Multi-Cloud and Hybrid-Cloud Cost Complexity
Organizations are using more than one cloud environment, which makes it harder to assign ownership of resource and data-transfer costs. Flexera reported that 73% of surveyed enterprises operated hybrid environments in 2026.[1] Mergers, decentralized purchasing, and growth in software-as-a-service use can add accounts, billing formats, and untagged resources to these environments. Cloud teams therefore need one view of usage, commitments, and traffic costs across providers. The Network cloud cost optimization market gains from this need because individual provider dashboards do not fully address cross-cloud allocation. European switching rules also make data-transfer economics more relevant when organizations compare vendor options.
Growth of AI and Data-Intensive Network Workloads
AI workloads place greater pressure on cloud budgets because they can require expensive GPUs, large datasets, and high volumes of data movement. CAST AI found that CPU utilization averaged 8% across the production Kubernetes deployments it analyzed in 2026. The same analysis reported that GPU utilization was 5%, showing that expensive capacity can remain underused. The FinOps Foundation reported that 98% of respondents managed AI spend in 2026, compared with 63% in 2025. The Network cloud cost optimization market is responding with tools that measure GPU use, allocate AI spending, and identify data-transfer charges. Demand is moving toward platforms that can assign inference and infrastructure costs to products, customers, and business units.
Rising Demand for FinOps and Cloud Financial Governance
FinOps programs are becoming a regular part of cloud operations as spending reaches more business functions. Flexera reported that 63% of organizations had dedicated FinOps teams in 2026. The FinOps Foundation found that 78% of FinOps teams reported through the CTO or CIO organization in 2026.[2] This reporting structure places cost management closer to technology planning and operational decisions. As basic waste opportunities are addressed, organizations need more advanced capabilities for architecture costing, commitment management, and traffic-path analysis. The Network cloud cost optimization market is supported by FOCUS, which helps providers and software vendors use a more consistent cost-data structure.
Need for Real-Time Network Egress and Traffic-Path Economics
Egress charges can remain unclear until billing data is reviewed, even though network choices are made when applications are designed. Data-intensive applications can create charges across availability zones, regions, and cloud providers. This makes traffic-path visibility important for organizations that run distributed applications or move AI data between services. The Network cloud cost optimization market is expanding into network-aware capabilities that link traffic flows with invoice lines and workload owners. These capabilities can help teams compare routing options and decide where data should be processed or stored. They also support operational teams that need to reduce cost without changing core application behavior.
Restraints Impact Analysis of Network Cloud Cost Optimization Market*
| Restraint | (~) % Impact on CAGR Forecast | Geographic Relevance | Impact Timeline |
|---|---|---|---|
| Shortage of Certified FinOps and Cloud-Networking Talent | -1.8% | Global, most acute in emerging markets and mid-tier enterprises | Medium term (2-4 years) |
| Fragmented Billing, Tagging, and Network-Telemetry Data | -1.5% | Global, most pronounced in multi-cloud and hybrid environments | Short term (≤ 2 years) |
| Opaque Egress, Inter-Region, and Cross-Cloud Pricing | -1.2% | Global, with the greatest effect in Asia-Pacific and South America | Short term (≤ 2 years) |
| Risk of Automated Remediation Affecting Application Performance | -0.9% | Global, concentrated in financial services and healthcare | Medium term (2-4 years) |
| Source: Mordor Intelligence | |||
Shortage of Certified FinOps and Cloud-Networking Talent
The shortage of people who understand both cloud billing and network operations can slow the deployment of network-focused cost tools. The FinOps Foundation found that enterprises managing more than USD 100 million in annual cloud spend had 8-10 FinOps practitioners on average in 2026. These teams must cover allocation, reporting, commitments, engineering engagement, and increasingly AI spending. Organizations without an established FinOps practice may have difficulty interpreting results or setting effective policies. Bitkom found that 64% of cloud-using enterprises in Germany reported rising cloud operating costs in 2025. Managed services can address this gap, although buyers still need internal accountability for cost and application decisions.
Fragmented Billing, Tagging, and Network-Telemetry Data
Different billing structures and incomplete tags limit the quality of cost allocation across cloud environments. Flexera reported that wasted cloud spend reached 29% of surveyed IaaS and PaaS budgets in 2026. Network telemetry creates another challenge because traffic data is recorded at different levels across providers and tools. Teams may struggle to match a specific traffic path with a specific invoice item. FOCUS is designed to improve standardization, but organizations still need consistent internal allocation rules. The Network cloud cost optimization market must therefore provide practical data integration and governance functions alongside recommendations.
*Our forecasts treat driver/restraint impacts as directional, not additive. The impact forecasts reflect baseline growth, mix effects, and variable interactions.
Network Cloud Cost Optimization Market Segment Analysis
By Component:
Services Are Growing Faster as Optimization Programs MatureSolutions held 65.15% of component revenue in 2025, supported by the installed base of visibility, rightsizing, traffic analytics, and planning tools used across complex cloud estates. Services are projected to grow at an 18.46% CAGR through 2031 as buyers seek assistance in applying recommendations across finance, engineering, and operations teams. Managed FinOps, consulting, implementation, and support help organizations convert billing data into sustained operating changes and establish clear accountability for those changes. Earlier adopters of dashboards increasingly need help with commitment management, tagging practices, business-unit allocation, and recurring reporting routines. This shift favors vendors that can combine software with expert delivery while adapting services to each customer's operating model.
The Network cloud cost optimization industry is moving from tool deployment toward recurring execution and governance. IBM's Apptio unit launched Conversational Insights in June 2026 with hybrid IT cost management and cloud optimization capabilities.[3] The product connects cost, consumption, value, and action through Apptio's Financial Intelligence Layer. FOCUS adoption can also influence service selection because enterprises want support for normalized cloud cost data that can be used across multiple providers. The Network cloud cost optimization market can benefit when vendors pair integrated software with accountable service delivery and measurable follow-through.
By Deployment Mode:
On-Premises Use Is Rising Alongside Cloud DeliveryCloud deployment held 71.56% of the Network cloud cost optimization market in 2025, reflecting the large share of workloads already operating in public cloud environments. On-premises deployment is projected to grow at an 18.32% CAGR through 2031. Cloud delivery can reduce setup effort, simplify connections across multiple accounts, and provide a consistent experience for distributed teams. It also gives teams faster access to product updates, managed capabilities, and provider integrations. These advantages sustain cloud deployment as the leading model for organizations that can use externally hosted software.
On-premises use is growing because some organizations cannot export billing or operational data to an external software-as-a-service environment. Financial services, public-sector, and defense-related organizations may operate private or sovereign cloud infrastructure with requirements for tighter control over telemetry and access. Hybrid environments increase the need for a tool that works across public and private estates without creating separate cost-governance processes. Flexera reported that 73% of surveyed enterprises operated hybrid environments in 2026. The Network cloud cost optimization market must support both hosted and customer-managed implementations.
By Organization Size:
SMEs Expand Access to Cost GovernanceLarge enterprises accounted for 66.67% of organization-size revenue in 2025 because multi-account and multi-region estates create substantial cost-control needs. SMEs are projected to grow at an 18.52% CAGR through 2031. Large organizations have the scale to support dedicated FinOps teams, formal allocation processes, and cross-functional reviews of cloud budgets. Their cloud estates also produce greater absolute spending exposure from unused resources, unplanned data movement, and fragmented ownership. They remain important buyers of broad, integrated optimization platforms that can serve many business units.
SMEs are adopting cloud workloads at a stage where structured cost governance becomes more necessary. Flexera reported that public-cloud workloads among SMEs rose from 55% to 63% year over year in its 2026 findings. Software-as-a-service delivery reduces the initial infrastructure burden for smaller teams and can speed access to common optimization functions. Managed FinOps bundles can supply rightsizing recommendations and commitment management without a large internal practice. The Network cloud cost optimization market can reach this group through simple onboarding and automated workflows.
By Application:
Rightsizing Leads While Kubernetes Management AdvancesCloud resource rightsizing held 36.25% of the Network cloud cost optimization market size in 2025, reflecting the broad need to align provisioned capacity with actual demand. Kubernetes and container cost management is projected to grow at an 18.48% CAGR through 2031. Rightsizing remains a foundational application because it addresses idle or oversized compute resources before they become recurring budget issues. Kubernetes cost management addresses a more specialized need for visibility at the cluster, namespace, and workload level. Both applications are becoming more important as container use and AI workloads increase across production environments.
CAST AI reported that CPU overprovisioning across analyzed production clusters increased from 40% to 69% year over year in 2026. Its analysis also found 5% GPU utilization for AI workloads, which reinforces the need for granular resource controls. Network egress and data-transfer optimization is becoming more relevant as data moves between distributed services, regions, and cloud providers. Commitment and discount management helps organizations apply savings plans and reservations more consistently. The Network cloud cost optimization market is broadening from resource controls to workload-level financial attribution.
By End-User Industry:
BFSI Is the Fastest-Growing Buyer GroupInformation technology and telecommunications held 32.54% of end-user revenue in 2025, reflecting its early adoption of public cloud and established FinOps capabilities. BFSI is projected to grow at an 18.72% CAGR through 2031. Technology and telecommunications buyers operate complex cloud estates and often require detailed allocation across services, customers, and internal product teams. BFSI buyers face a similar cost need, but their interest is strengthened by governance and resilience requirements. These conditions support a durable role for optimization tools in financial services.
The Digital Operational Resilience Act took effect in January 2025 and requires covered European financial entities to manage digital operational resilience and ICT third-party risks. Retail and e-commerce buyers use optimization to control seasonal traffic and content-delivery costs during busy trading periods. Healthcare and life sciences organizations need tools that fit privacy and data-residency requirements. Manufacturing buyers are adding cloud-connected operational workloads that create time-series data and new transfer patterns. The Network cloud cost optimization industry must address sector-specific governance needs without making workflows harder to use.

Geography Analysis
North America Network Cloud Cost Optimization Market
North America held 37.45% of the Network cloud cost optimization market share in 2025, supported by a high concentration of large cloud consumers and mature FinOps practices. Flexera reported that 76% of large U.S. enterprises spent more than USD 5 million monthly on cloud services in 2026. The region has a dense base of optimization vendors and cloud platform users, while AI infrastructure spending is adding demand for granular allocation and network egress controls. Canada supports demand through financial services adoption, while Mexico is developing early-stage cost-governance needs as cloud use expands.
Europe Network Cloud Cost Optimization Market
Europe is shaped by compliance requirements and regional data-location choices. The Data Act supports conditions for switching between data-processing services, making portability and transfer costs relevant in cloud decisions, while Bitkom found that 64% of cloud-using enterprises in Germany reported rising operating costs in 2025 and 54% expected further increases in 2026.[4]Germany, France, the United Kingdom, Italy, and Spain are important adoption markets, while Russian activity is constrained by geopolitical factors that affect access to mainstream hyperscaler infrastructure. The Network cloud cost optimization market needs to address regional governance requirements as well as cost allocation.
APAC, South America and MEA Network Cloud Cost Optimization Market
Asia-Pacific is projected to grow at an 18.51% CAGR through 2031 as enterprises formalize FinOps practices alongside rapid public-cloud adoption. CAST AI launched a Mumbai region in June 2026 with in-country support and feature parity with its global regions. India represents a developing demand center for enterprise cloud optimization. Japan and South Korea offer high-value opportunities where financial governance practices and complex Kubernetes estates support formal programs. South America is developing through Brazil and Argentina, while the Middle East and Africa remain earlier-stage areas linked to expanding cloud infrastructure and digitalization programs. The Network cloud cost optimization market has room to grow where cloud investment is rising faster than cost-management maturity.
Competitive Landscape
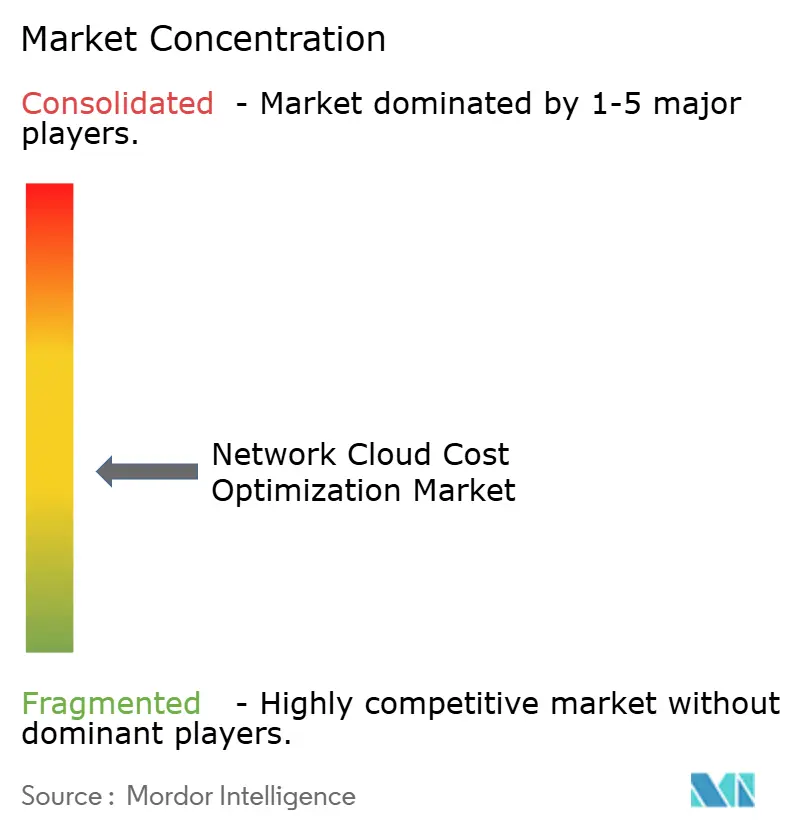
The Network cloud cost optimization market remains fragmented at the product level, while platform providers are pursuing broader portfolios. AWS, Microsoft, and Google provide native cost-management consoles that serve their own cloud environments. Independent vendors retain an opportunity where customers need portability across providers and a consolidated operating view. Flexera acquired ProsperOps and Chaos Genius in January 2026, combining FinOps automation with workload, AI, and data-cloud cost capabilities. The transaction shows how vendors are building execution capabilities alongside reporting.
ServiceNow and Datadog can use their existing enterprise relationships in IT service management and observability to distribute cost-management functions, while independent specialists need stronger automation, workflow integration, and unit-economics attribution to compete with this reach. CloudZero launched a financial control plane for AI in May 2026 that connects AI infrastructure spending with customer, product, and feature outcomes. IBM's Apptio introduced Conversational Insights in June 2026 to translate technology-spend data into decision support. These moves show that buyers increasingly expect cost tools to support operational and business decisions. The Network cloud cost optimization market is shifting toward platforms that can explain and act on cost data.
FOCUS compatibility can influence vendor selection because it provides a common basis for cost and usage data, and PointFive raised USD 60 million in Series B financing in June 2026 to support its cloud and AI efficiency platform. nOps made its Clara FinOps agent available through Model Context Protocol-compatible developer toolchains in 2026, while CloudBolt acquired StormForge in March 2025 and integrated its machine-learning-based Kubernetes optimization capabilities into its FinOps platform. Opportunities remain in real-time multi-cloud egress optimization, private-cloud cost governance, and SaaS cost management. The Network cloud cost optimization market is likely to reward vendors that make controls useful for finance, engineering, and operations teams at the same time.
Network Cloud Cost Optimization Industry Leaders
-
Flexera Software LLC
-
CloudZero, Inc.
-
IBM Apptio
-
CAST AI Group Inc.
-
PointFive Ltd
- *Disclaimer: Major Players sorted in no particular order
Network Cloud Cost Optimization Market Companies Covered in this Report
- IBM Corporation
- Broadcom Inc.
- Flexera Software LLC
- CloudZero, Inc.
- Harness, Inc.
- Amazon Web Services, Inc.
- Microsoft Corporation
- Google LLC
- ServiceNow, Inc.
- Kubecost
- Densify Inc.
- nOps, Inc.
- Yotascale, Inc.
- Finout Ltd.
- CAST AI Group Inc.
- Datadog, Inc.
- DoiT International
- Oracle Corporation
- Nutanix, Inc.
- PointFive
- Zesty Ltd.
- CloudBolt Software, Inc.
Recent Industry Developments in Network Cloud Cost Optimization Market
- June 2026: Apptio, an IBM Company, launched Conversational Insights in preview alongside new hybrid IT cost management and cloud optimization capabilities. The suite targets AI financial governance and integrates with Apptio's Financial Intelligence Layer to connect cost, consumption, value, and action across all spending data. General availability of key components was expected in Q2-Q3 2026.
- May 2026: CloudZero launched its financial control plane for AI, enabling finance, IT, and engineering teams to connect every dollar of AI infrastructure spending to customer, product, and feature outcomes in real time. The platform covers AWS, GCP, Azure, Snowflake, MongoDB, OpenAI, and Anthropic and introduced multi-dimensional AI cost allocation as a new product category.
- January 2026: Flexera acquired ProsperOps, an AI-enabled FinOps automation platform that autonomously managed USD 6 billion in annual cloud usage and generated USD 3 billion in lifetime customer savings, and Chaos Genius, an agentic FinOps platform for Snowflake and Databricks. The acquisitions created a unified layer spanning cost reporting, workload optimization, and autonomous rate optimization.
- March 2025: CloudBolt Software acquired StormForge, a machine-learning-powered Kubernetes resource optimization provider with patent-pending ML capabilities. CloudBolt integrated StormForge's technology into its FinOps platform, creating an advanced Kubernetes cost management solution.
Global Network Cloud Cost Optimization Market Report Scope
The Network Cloud Cost Optimization Market is Segmented by Component (Solutions, and Services), Deployment Mode (Cloud, and On Premise), Organization Size (Large Enterprises, and Small and Medium Enterprises), Application (Cloud Resource Rightsizing, Network Egress and Data-Transfer Optimization, Kubernetes and Container Cost Management, Commitment and Discount Management, and More), End-User (Information Technology and Telecommunications, Retail and E-Commerce, Banking, Financial Services, and Insurance, Healthcare and Life Sciences, Manufacturing and Industrial, and More), and Geography. The Market Forecasts are Provided in Terms of Value (USD).
Segmentation Overview
| Solutions | Cost Monitoring and Visibility |
| Network Traffic and Egress Analytics | |
| Resource Rightsizing and Workload Optimization | |
| Budgeting, Forecasting, and Allocation | |
| Services | Managed FinOps and Optimization Services |
| Consulting and Implementation Services | |
| Support and Maintenance Services |
| Cloud |
| On Premise |
| Large Enterprises |
| Small and Medium Enterprises |
| Network Egress and Data-Transfer Optimization |
| Kubernetes and Container Cost Management |
| Cloud Resource Rightsizing |
| Commitment and Discount Management |
| Other Applications |
| Information Technology and Telecommunications |
| Banking, Financial Services, and Insurance |
| Retail and E-Commerce |
| Healthcare and Life Sciences |
| Manufacturing and Industrial |
| Other End-User Industries |
| North America | United States |
| Canada | |
| Mexico | |
| South America | Brazil |
| Argentina | |
| Rest of South America | |
| Europe | Germany |
| United Kingdom | |
| France | |
| Italy | |
| Spain | |
| Russia | |
| Rest of Europe | |
| Asia-Pacific | China |
| India | |
| Japan | |
| South Korea | |
| Australia and New Zealand | |
| Rest of Asia-Pacific | |
| Middle East | Saudi Arabia |
| United Arab Emirates | |
| Turkey | |
| Israel | |
| Rest of Middle East | |
| Africa | South Africa |
| Nigeria | |
| Egypt | |
| Rest of Africa |
| By Component | Solutions | Cost Monitoring and Visibility |
| Network Traffic and Egress Analytics | ||
| Resource Rightsizing and Workload Optimization | ||
| Budgeting, Forecasting, and Allocation | ||
| Services | Managed FinOps and Optimization Services | |
| Consulting and Implementation Services | ||
| Support and Maintenance Services | ||
| By Deployment Mode | Cloud | |
| On Premise | ||
| By Organization Size | Large Enterprises | |
| Small and Medium Enterprises | ||
| By Application | Network Egress and Data-Transfer Optimization | |
| Kubernetes and Container Cost Management | ||
| Cloud Resource Rightsizing | ||
| Commitment and Discount Management | ||
| Other Applications | ||
| By End-User Industry | Information Technology and Telecommunications | |
| Banking, Financial Services, and Insurance | ||
| Retail and E-Commerce | ||
| Healthcare and Life Sciences | ||
| Manufacturing and Industrial | ||
| Other End-User Industries | ||
| By Geography | North America | United States |
| Canada | ||
| Mexico | ||
| South America | Brazil | |
| Argentina | ||
| Rest of South America | ||
| Europe | Germany | |
| United Kingdom | ||
| France | ||
| Italy | ||
| Spain | ||
| Russia | ||
| Rest of Europe | ||
| Asia-Pacific | China | |
| India | ||
| Japan | ||
| South Korea | ||
| Australia and New Zealand | ||
| Rest of Asia-Pacific | ||
| Middle East | Saudi Arabia | |
| United Arab Emirates | ||
| Turkey | ||
| Israel | ||
| Rest of Middle East | ||
| Africa | South Africa | |
| Nigeria | ||
| Egypt | ||
| Rest of Africa | ||
Key Questions Answered in the Report
What is the size of the Network cloud cost optimization market?
The market was valued at USD 1.85 billion in 2025, is estimated at USD 2.23 billion in 2026, and is forecast to reach USD 4.79 billion by 2031 at a 16.52% CAGR. The forecast reflects growing demand for governance of AI workloads, Kubernetes resources, and multi-cloud data transfers, as organizations seek clearer allocation, practical rightsizing, better commitment management, and more direct oversight of network charges across increasingly distributed cloud environments.
What is driving demand for cloud cost optimization tools?
Multi-cloud complexity, AI workloads, Kubernetes resource use, and the need for better egress-cost visibility are increasing demand. The Network cloud cost optimization market is responding with allocation, rightsizing, and traffic-path capabilities that support finance and engineering teams, while organizations also need consistent tags, normalized billing data, and governance workflows that allow savings actions to be reviewed, assigned, and sustained over time.
Which component is growing fastest?
Services are projected to grow at an 18.46% CAGR through 2031 as organizations seek managed FinOps, consulting, and implementation support. In the Network cloud cost optimization market, this reflects a need to convert recommendations into operating practices, assign accountability for savings, and help internal teams manage cloud resources with more consistent review cycles.
Which customer group is growing fastest?
BFSI is projected to expand at an 18.72% CAGR through 2031, supported by rising cloud spending and technology-governance requirements. Financial institutions need clear cost controls, documented governance, and resilience oversight as cloud use broadens.
Why is Kubernetes cost management important?
Kubernetes and container cost management is projected to grow at an 18.48% CAGR through 2031 because enterprises need more granular control over cluster and workload costs. It supports allocation and resource decisions across complex production environments, especially where application teams share underlying infrastructure.
Which region will grow fastest through 2031?
Asia-Pacific is projected to expand at an 18.51% CAGR as enterprises increase public-cloud use and establish formal FinOps practices. India, Japan, and South Korea are important enterprise adoption centers, and the Network cloud cost optimization market can serve needs that differ by local infrastructure and governance requirements.