
Machine Translation Market Size and Share
Market Overview
| Study Period | 2020 - 2031 |
|---|---|
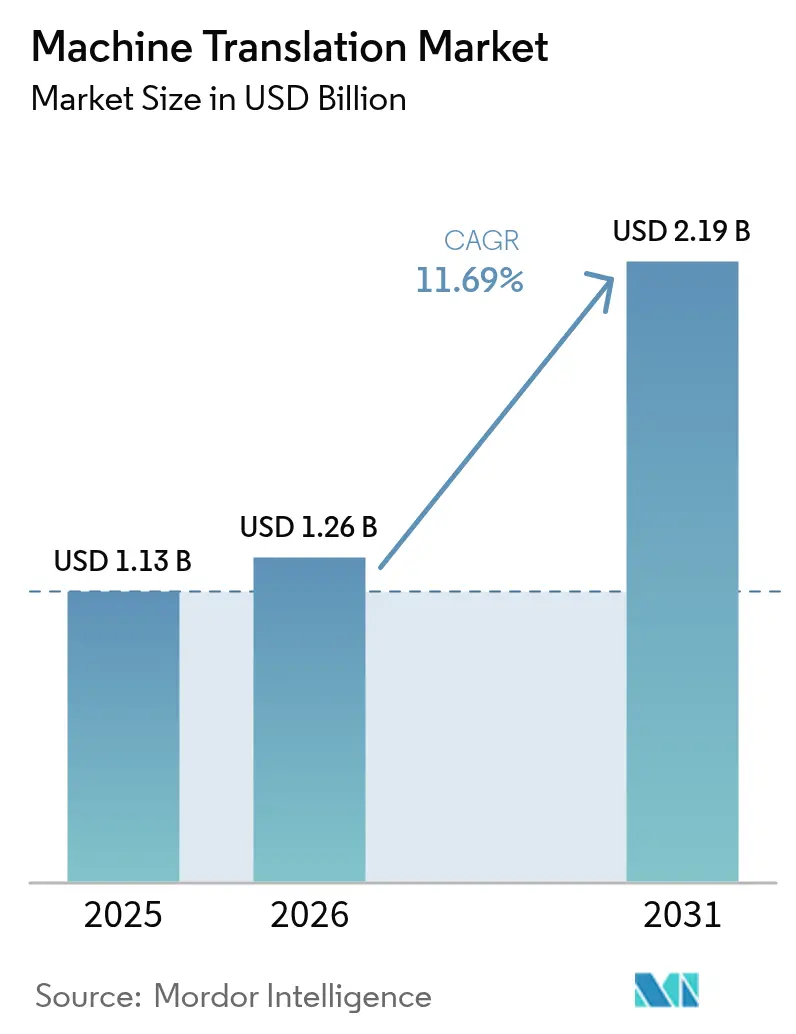
| Market Size (2026) | USD 1.26 Billion |
| Market Size (2031) | USD 2.19 Billion |
| Growth Rate (2026 - 2031) | 11.69 % |
| Fastest Growing Market | Asia Pacific |
| Largest Market | North America |
| Market Concentration | Medium |
Major Players *Disclaimer: Major Players sorted in no particular order Image © Mordor Intelligence. Reuse requires attribution under CC BY 4.0. | |
Machine Translation Market Analysis by Mordor Intelligence
The machine translation market size is projected to expand from USD 1.13 billion in 2025 and USD 1.26 billion in 2026 to USD 2.19 billion by 2031, registering a CAGR of 11.69% between 2026 and 2031. Demand is accelerating as enterprises embed real-time translation in customer support, video conferencing, and e-commerce storefronts. Sovereign data-residency mandates are shifting deployment toward edge and on-premise inference, rewarding vendors that deliver compact multilingual models with sub-100-millisecond latency. Transformer architectures now underpin most new systems, enabling measurable quality gains in low-resource language pairs and lowering fine-tuning costs for vertical use cases. Competitive intensity is rising because hyperscalers bundle translation APIs into broader cloud suites, while specialists differentiate through domain-specific tuning and superior handling of idiomatic expressions.
Key Report Takeaways
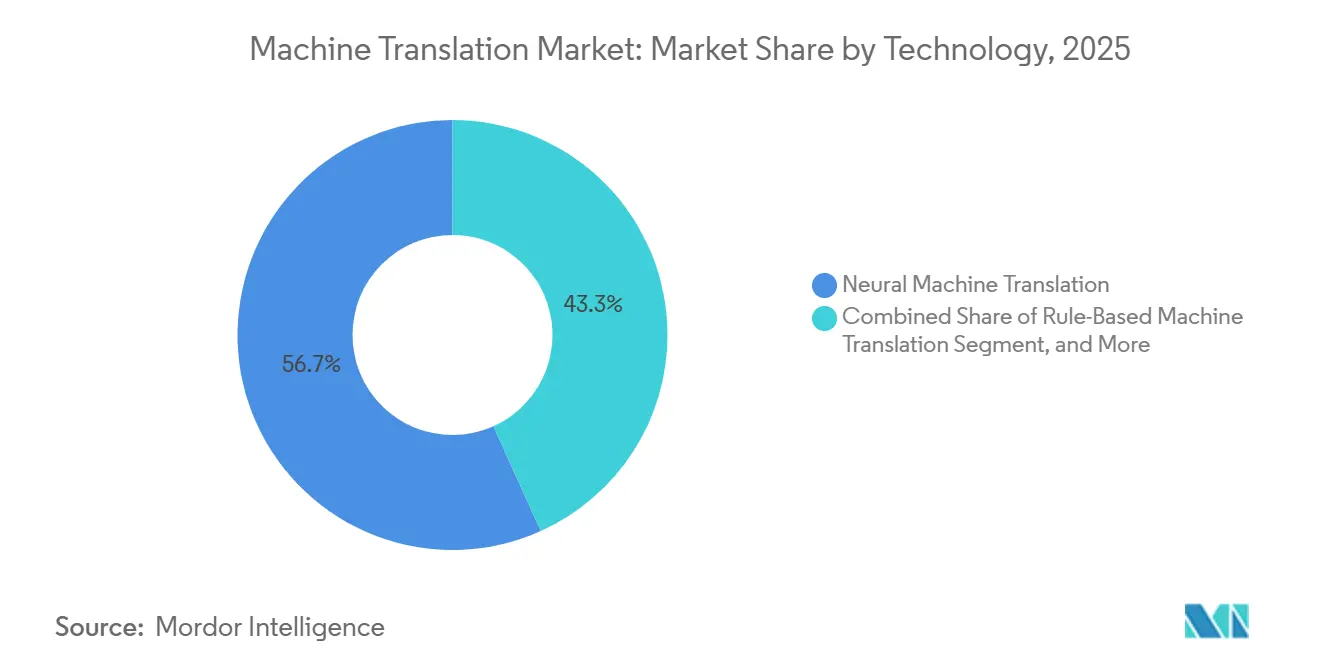
- By technology, neural machine translation held 56.73% of the machine translation market share in 2025; transformer-based approaches are forecast to grow at a 12.71% CAGR through 2031.
- By deployment mode, cloud solutions captured 71.24% of the machine translation market size in 2025, but edge and on-device implementations are projected to expand at a 12.36% CAGR between 2026 and 2031.
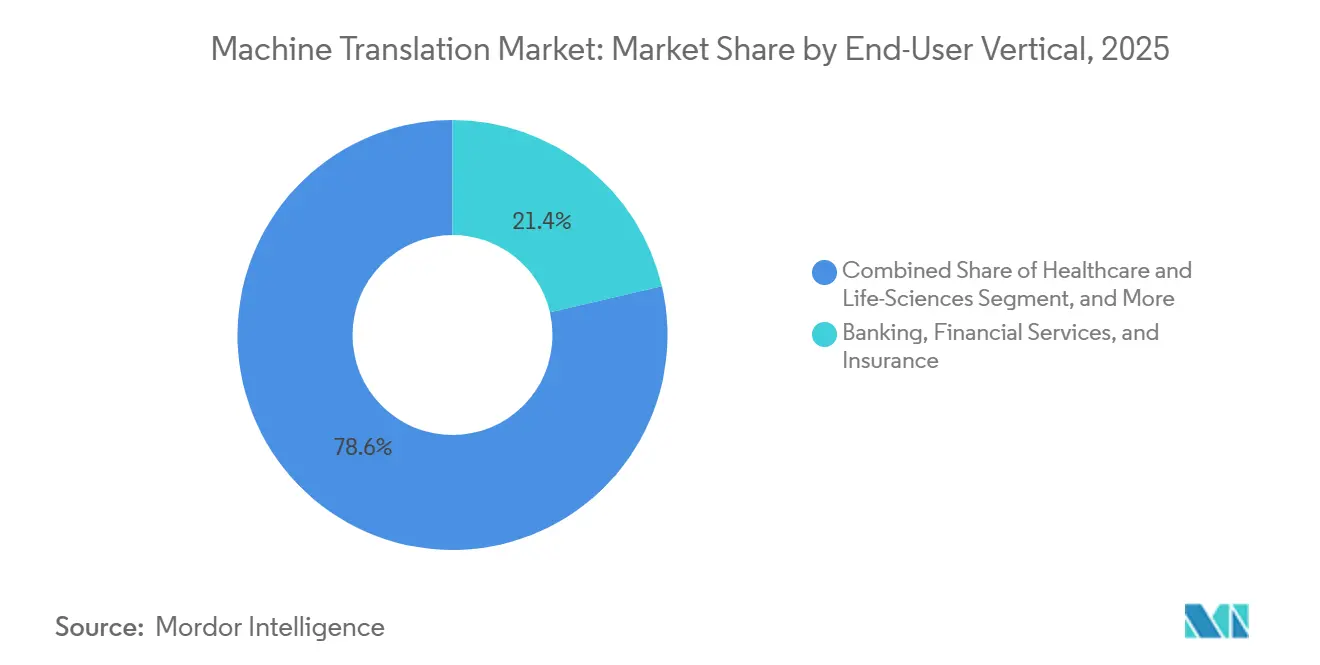
- By end-user vertical, banking, financial services, and insurance accounted for 21.36% of 2025 spending, while healthcare and life sciences are advancing at a 13.66% CAGR through 2031.
- By application type, static documents accounted for 28.91% of 2025 revenue, whereas live speech translation is growing fastest at a 12.93% CAGR through 2031.
- By geography, North America led with 37.89% revenue share in 2025; Asia-Pacific is forecast to record a 12.78% CAGR over the same period.
Note: Market size and forecast figures in this report are generated using Mordor Intelligence’s proprietary estimation framework, updated with the latest available data and insights as of 2026.
Market Trends and Insights
Drivers Impact Analysis of Machine Translation Market*
| Driver | (~) % Impact on CAGR Forecast | Geographic Relevance | Impact Timeline |
|---|---|---|---|
| Growing Demand for Content Localization | +2.3% | Global, concentrated in Asia-Pacific and Europe | Medium term (2-4 years) |
| Need for Cost-Efficient, High-Speed Translation | +1.9% | Global, particularly North America and Europe | Short term (≤ 2 years) |
| Expansion of Cross-Border E-Commerce Platforms | +2.1% | Asia-Pacific core, spillover to Middle East and South America | Medium term (2-4 years) |
| Transformer-Based MT Breakthroughs | +2.5% | Global, led by North America and Europe | Long term (≥ 4 years) |
| Edge Deployment of Compact Multilingual Models Reducing Latency | +1.6% | North America, Europe, and Japan | Long term (≥ 4 years) |
| Mandated Multilingual Compliance Under Emerging AI Regulations | +1.4% | Europe and North America, emerging in Asia-Pacific | Medium term (2-4 years) |
| Source: Mordor Intelligence | |||
Growing Demand for Content Localization
Multinational enterprises are under sustained pressure to release marketing collateral, product documentation, and support content in dozens of languages simultaneously. Vernacular product listings on Southeast Asian digital marketplaces lifted conversion rates by 20-35% in 2025. Streaming platforms also expanded subtitle and dubbing pipelines, driving double-digit increases in localization budgets at major studios.[1]Netflix Investor Relations, “2025 Annual Report,” ir.netflix.net Social networks require instant translation to moderate user-generated content, while localization service providers now embed neural engines to cut turnaround from weeks to hours. As continuous localization becomes the norm, automated translation evolves from an outsourced adjunct to a critical internal capability.
Need for Cost-Efficient, High-Speed Translation
Typical human translation fees of USD 0.10-0.30 per word are financially untenable for organizations processing millions of words monthly. Neural workflows with selective post-editing deliver comparable quality for USD 0.01-0.03 per word, trimming 60% from project cycle times in finance and insurance use cases.[2]TAUS, “Hybrid Translation Economics,” taus.net Pharmaceutical sponsors similarly reduced clinical-trial localization costs by up to 50%, accelerating patient enrollment and improving return on R&D spend. The time advantage is most apparent in legal discovery and crisis response, cementing machine translation as the default for high-volume, deadline-driven tasks.
Expansion of Cross-Border E-Commerce Platforms
Global cross-border online sales surpassed USD 1.2 trillion in 2025, and sellers offering multilingual storefronts achieved average order values up to 50% higher. Payment gateways and logistics services embed translation in checkout and notification flows, reducing abandonment by 15-25%. Live-stream-commerce platforms in Southeast Asia rely on real-time interpretation to connect influencers with diverse audiences. Coupled with regulatory mandates in the European Union and India that require local-language consumer disclosures, these forces institutionalize translation as foundational infrastructure for commerce.
Transformer-Based MT Breakthroughs
Self-attention architectures improved BLEU scores for major language pairs above 40, compared with 25-30 for statistical models. Pre-trained multilingual models like mBART and mT5 dramatically reduce the parallel data needed for domain tuning, enabling enterprises to create private engines with tens of thousands rather than millions of sentence pairs. Sparse-attention and mixture-of-experts variants lowered inference cost by up to 50%. These advances raise quality ceilings and shrink the total cost of ownership, widening adoption beyond high-margin verticals.
Restraints Impact Analysis of Machine Translation Market*
| Restraint | (~) % Impact on CAGR Forecast | Geographic Relevance | Impact Timeline |
|---|---|---|---|
| Persistent Accuracy Gaps in Low-Resource Languages | -1.8% | Global, acute in Africa, Southeast Asia, indigenous-language regions | Long term (≥ 4 years) |
| Free/Open-Source MT Engines Commoditizing Pricing | -1.5% | Global, most pronounced in North America and Europe | Short term (≤ 2 years) |
| Sovereign Data-Privacy Regulations | -1.2% | Europe, China, India, and Middle East | Medium term (2-4 years) |
| Carbon Accounting Pressures on Energy-Intensive MT Inference | -0.9% | Europe and North America, emerging in Asia-Pacific | Long term (≥ 4 years) |
| Source: Mordor Intelligence | |||
Persistent Accuracy Gaps in Low-Resource Languages
Neural models still post error rates above 30% for many African and indigenous languages, making them unsuitable for critical healthcare or legal content without costly human review.[3]UNESCO, “Atlas of the World’s Languages,” en.unesco.org Government agencies in multilingual regions cited translation missteps that undermined public health campaigns in 2025. Data scarcity limits vendor investment, and even zero-shot methods such as Meta’s NLLB yield BLEU scores below 20 for numerous language pairs. Hybrid human-in-the-loop workflows remain necessary, eroding the speed and cost advantages central to adoption.
Free/Open-Source MT Engines Commoditizing Pricing
Frameworks such as OpenNMT, Marian, and Meta’s NLLB enable enterprises to self-host production-grade engines with no licensing fees. Companies with machine-learning talent reported 70-80% cost savings over paid APIs in high-volume settings like social-media moderation. Hyperscalers responded with deep discounts, pressuring standalone vendors to specialize in regulated domains or offer premium support. The resulting price compression narrows margins and accelerates consolidation among mid-tier providers.
*Our forecasts treat driver/restraint impacts as directional, not additive. The impact forecasts reflect baseline growth, mix effects, and variable interactions.
Machine Translation Market Segment Analysis
By Technology:
Transformer Architectures Consolidate LeadershipNeural machine translation captured 56.73% of overall revenue in 2025, and its segment is expanding at a 12.71% CAGR through 2031, the highest among technology classes. Transformer models now constitute the majority of neural deployments because they process text in parallel and preserve long-range context, reducing inference latency by up to 60% while boosting quality scores. Rule-based and statistical engines survive only in highly regulated niches such as defense, where deterministic output is mandated, yet their combined footprint is shrinking each year. Hybrid configurations that blend neural output with terminology databases lower post-editing effort by around 30%, appealing to automotive and life-science publishers that require strict glossary adherence. As the cost of training and inference falls, transformer-centric offerings dominate vendor roadmaps, and the machine translation market continues to pivot toward specialized fine-tuning rather than fundamental algorithm innovation.
Second-generation sparse transformers and quantized models, some under 50 MB, facilitate on-device operation without noticeable quality loss, expanding practical use cases into wearables and embedded systems. Academic explorations of example-based or interlingua approaches remain largely experimental. The consolidation around transformer technology anchors buyer expectations of continuous quality gains and shorter development cycles, reinforcing first-mover advantages for vendors with proprietary data assets.



By Deployment:
Edge and On-Device Installations AccelerateCloud services accounted for 71.24% of 2025 revenue, as they simplify integration and enable seamless model updates. Even so, edge and on-device deployments are forecast to grow at 12.36% annually through 2031, the fastest rate among deployment modes. Automotive OEMs now preload compact bilingual models to deliver voice translation without cellular links, marketing sub-100-millisecond response times as a premium feature. The United States Department of Defense mandates air-gapped language systems, steering military demand toward on-premise software. Healthcare providers handling protected health information likewise favor local inference to meet HIPAA audit requirements.
Hybrid topologies that train in the cloud and infer on edge hardware are emerging as the preferred architecture to balance latency, privacy, and cost. Advances in model pruning and 8-bit quantization reduce memory requirements by up to 70%, making it practical to run transformer models on GPUs embedded in conference-room endpoints or ruggedized field devices. As data-sovereignty rules tighten, the deployment mix in the machine translation market continues to diversify away from pure cloud dependence.
By End-User Vertical:
Healthcare Gains MomentumBanking, financial services, and insurance dominated spending, accounting for 21.36% of 2025 revenue, due to regulatory requirements for multilingual disclosures and cross-border compliance reporting. Meanwhile, healthcare and life sciences are advancing at a 13.66% CAGR, the highest of any vertical, as global clinical trials multiply consent-form and adverse-event translation needs. Pharmaceutical manufacturers stated in 2025 filings that automated translation cut trial localization costs by up to 50% and shaved months off launch timelines.
E-commerce firms integrate translation throughout product catalogs and customer-review pipelines to lift basket sizes in non-English regions. Media companies employ neural dubbing and subtitling to expand their reach, while public-sector agencies invest to meet digital services legislation. Education technology platforms translate curricula and assessments, boosting overseas enrollment by up to 70%. The versatility of use cases underscores how the machine translation market now serves as a horizontal enabler across virtually every information-intensive sector.
By Application Type:
Real-Time Speech Leads Growth CurveStatic documents remained the largest application, accounting for 28.91% of 2025 revenue, yet live speech translation is projected to grow at a 12.93% CAGR, outstripping every other use. Video-conference providers reported that in-meeting translation increased participation among non-English speakers by up to 60%, validating the investment in low-latency inference. Customer support desks integrating multilingual chat reduced average handle times by 20-30% and avoided hiring additional language specialists.
Subtitling and multimedia localization also surge as streaming services localize back catalogs to sustain subscriber growth. Developers rely on translation APIs to internationalize software interfaces, pulling repository contributions from broader communities. Voice assistants and social-media platforms add on-device translation to improve user engagement. The shift toward interactive, real-time use cases raises expectations for both latency and contextual accuracy, rewarding vendors that optimize inference pipelines and context retention.
Geography Analysis
North America Machine Translation Market
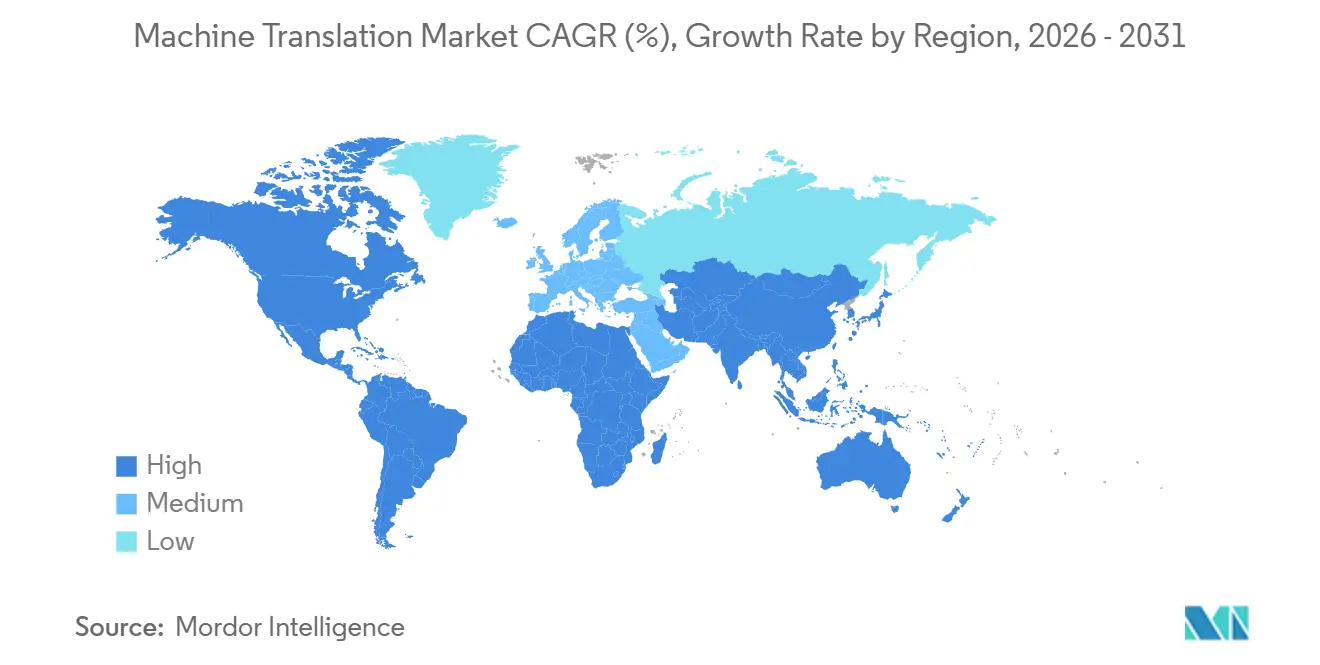
North America held a 37.89% share in 2025, driven by early enterprise adoption and hyperscaler R&D outlays. Financial, healthcare, and technology companies typically report localization cost savings between 50-70% and same-day turnaround for external content releases. Canada’s bilingual statutes sustain steady demand across the government and private sectors, while Mexico’s integration into U.S. supply chains fuels English-Spanish translation in logistics and procurement.
APAC Machine Translation Market
Asia-Pacific is forecast to post the fastest regional CAGR at 12.78% through 2031. Chinese and Indian e-commerce platforms depend on local-language storefronts to reach tier-two and tier-three cities, lifting order values by up to 50%. Japan’s demographic headwinds push enterprises to automation to counter labor shortages, and South Korea’s export manufacturers embed translation in product documentation to retain global competitiveness. Rapid digital-commerce expansion in Indonesia, Thailand, and Vietnam deepens reliance on automated translation to reduce cart abandonment.
EMEA and South America Machine Translation Market
Europe maintains a significant demand because EU regulations require enterprises to deliver digital services content in all official languages. Germany, France, and the United Kingdom dominate spending across automotive, pharma, and finance verticals. In South America, Mercado Libre and B2W Digital localize listings to break language barriers between Portuguese- and Spanish-speaking consumers. Middle East and Africa growth is tied to smart-city initiatives in the Gulf and multinational entry into frontier markets, where multilingual citizen services and enterprise workflows necessitate translation.

Regulatory Landscape
Machine translation governance is increasingly shaped by broader AI oversight and sector language-access requirements, which is pushing compliance-driven feature roadmaps (disclosure, auditability, and quality controls). In the European Union, the EU Artificial Intelligence Act (Regulation (EU) 2024/1689) entered into force in August 2024 and introduces transparency obligations that apply from August 2, 2026. These obligations can cover AI systems that interact with people or generate content, which affects how certain translation outputs are disclosed and documented.
Sector rules also define acceptable use of machine translation in high-risk settings. In the United States, the HHS Office for Civil Rights Section 1557 final rule (May 2024) sets expectations for meaningful language access in health programs, including requirements that shape how machine translation is deployed alongside qualified human review. Governments are also formalizing approved tools and workflows, such as Canada, where a Treasury Board of Canada Secretariat policy implementation notice made GCtranslate the default AI-assisted translation tool on Government of Canada devices for routine internal use effective April 29, 2026, reinforcing procurement preference for controlled, policy-aligned translation platforms.
Value Chain Analysis
The machine translation value chain begins with data sourcing and preparation (parallel corpora, domain terminology, and privacy-safe datasets). It then moves into model development (foundation multilingual models, domain adapters, and evaluation), followed by productization through APIs, SDKs, and enterprise connectors into content and collaboration systems. Hyperscalers and specialist vendors provide the core inference and MLOps layer, while language technology platforms and translation management systems coordinate workflows across authoring tools, repositories, contact centers, and conferencing endpoints.
A clear integration pattern is translation management providers embedding cloud model services for scalability and security, exemplified by TransPerfect integrating Amazon Bedrock into GlobalLink Enterprise (April 2025) to automate translation workflows within enterprise controls. Downstream, distribution is handled through cloud marketplaces and platform integrations, with more emphasis on low-latency deployment near users and on-device inference for privacy and responsiveness. Infrastructure partners increasingly influence unit economics and experience, as shown by Translated working with Lenovo to deploy ThinkSystem servers and NVIDIA GPUs to power its Lara translation AI and place infrastructure near major internet hubs (June 2025). For high-stakes content, verification and governance remain a bottleneck, with organizations relying on human-in-the-loop oversight and terminology management. This shifts value capture toward providers that bundle QA, traceability, and workflow controls rather than standalone translation output.
Competitive Landscape
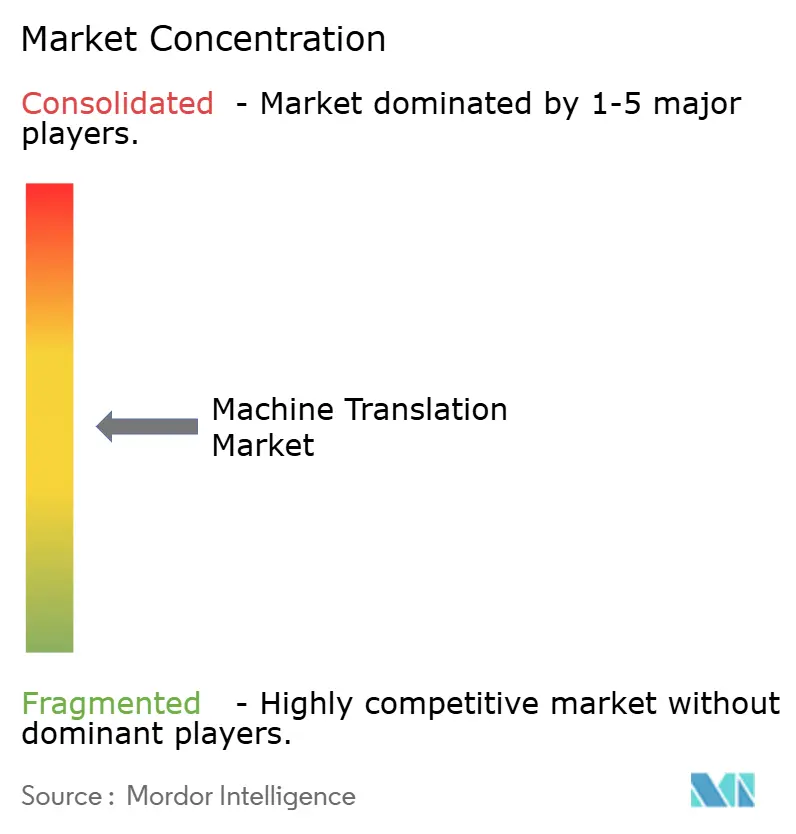
Market structure is moderately fragmented. Hyperscalers Google, Microsoft, and Amazon wield cost advantages by bundling translation with cloud credits, compressing per-character pricing, and prompting consolidation among independents. DeepL maintains a quality-led niche in European language pairs, validated through enterprise A/B testing that justifies premium fees. Meta’s open-source NLLB model democratizes access to 200 languages, empowering smaller firms and intensifying price pressure.
Emerging players like Unbabel and LILT combine neural translation with curated human post-editing networks, ensuring service-level agreements that meet the needs of regulated industries. Patent activity indicates the vendor's focus on mixture-of-experts routing, sparse-attention acceleration, and quantization, aiming to halve inference costs on edge devices. Specialists such as RWS and SYSTRAN fortify positions in life sciences and legal domains by building proprietary terminology databases that create switching costs.
Recent financing rounds underscore investor confidence. DeepL raised USD 300 million in November 2025 to expand across Asia-Pacific. Microsoft committed USD 150 million to widen Azure Translator language coverage, and Google integrated its Gemini large language model into Translate for richer context handling. These strategic moves signal an arms race in quality, coverage, and deployment flexibility as competitors vie for a share in the expanding machine translation market.
Machine Translation Industry Leaders
Google LLC
Microsoft Corporation
Amazon Web Services Inc.
DeepL GmbH
IBM Corporation
- *Disclaimer: Major Players sorted in no particular order
Machine Translation Market Companies Covered in this Report
- Google LLC
- Microsoft Corporation
- Amazon Web Services Inc.
- DeepL GmbH
- IBM Corporation
- Meta Platforms Inc.
- Baidu Inc.
- Tencent Cloud Computing (Beijing) Co. Ltd.
- RWS Holdings PLC
- SYSTRAN International Co. Ltd.
- Lionbridge Technologies Inc.
- Welocalize Inc.
- Smartling Inc.
- AppTek LLC
- Lingotek Inc.
- PROMT Ltd.
- Yandex NV
- Cloudwords Inc.
- Omniscien Technologies Inc.
- LILT Inc.
- TransPerfect Global Inc.
- Unbabel Inc.

Market Opportunities and Future Outlook
Product differentiation is moving from text-only translation toward real-time, speech-enabled, meeting-native experiences, which expands addressable demand in collaboration and customer interaction workflows. DeepL launched DeepL Voice-to-Voice in April 2026, targeting virtual and in-person spoken communication and signaling a shift toward integrated, low-latency speech translation as a paid enterprise capability. This leaves room for vendors and integrators to pair speech translation with governance, such as logging, role-based access, terminology constraints, and configurable output inside platforms used by global teams.
There is also an opportunity in compliance-ready translation stacks for regulated industries and public sector customers, where buyers balance multilingual access mandates with data residency and AI transparency rules. The EU AI Act adds transparency obligations from August 2, 2026, which increases demand for disclosure mechanisms, audit trails, and controllable model behavior in translation deployments, especially for customer-facing interactions and content generation. Open and compact model families also expand build-versus-buy options and edge deployments, including Google releasing TranslateGemma (January 2026) to support mobile, local, and cloud deployment. That helps spur activity around fine-tuning, adapters, and domain packs for verticals such as healthcare, legal, and government.
Recent Industry Developments in Machine Translation Market
- June 2026: Microsoft made Azure Translator API version 2026-06-06 generally available, adding options that let developers choose between neural machine translation and large language model-based translation. This increases flexibility in balancing latency, cost, and output style for different application types, supporting broader productionization across content, support, and app localization workflows.
- November 2025: DeepL secured USD 300 million in Series C funding to develop domain-specific models and expand into Asia-Pacific. The funding supported product and go-to-market scaling in a region where multilingual commerce and localization demands intensify competitive pressure on both hyperscalers and specialists.
- August 2024: EU AI Act enters into force, introducing transparency obligations that apply to AI systems that interact with people or generate content, affecting translation deployments in regulated sectors. This anchors governance and procurement practices for vendors and buyers, aligning with ongoing AI transparency initiatives across public sector projects.


Machine Translation Market Report Scope and Research Methodology
Market Definition and Coverage
For this study, the machine translation market is defined as revenue earned from software and related services that automatically translate text or speech from one language to another for business and consumer use across major regions.
Scope exclusions: Human-only translation services, pure interpretation labor, and standalone translation hardware devices are excluded unless directly bundled with machine translation software or service revenue.
Segments Covered in This Report
- By Technology
- Statistical Machine Translation
- Rule-Based Machine Translation
- Neural Machine Translation
- Sequence-to-Sequence NMT
- Transformer-Based NMT
- Hybrid and Adaptive MT
- Other Technologies
- By Deployment
- On-Premise
- Cloud-Based
- Edge/On-Device
- By End-User Vertical
- Automotive and Mobility
- Military and Defense
- Healthcare and Life-Sciences
- IT and Telecom
- E-Commerce and Retail
- Media and Entertainment
- Banking, Financial Services, and Insurance
- Government and Public Sector
- Education and E-Learning
- Other End-User Verticals
- By Application Type
- Static Document Translation
- Live Speech Translation
- Multimedia Localization
- Code and Interface Internationalization
- Customer Support Chat Translation
- Other Application Types
- By Geography
- North America
- United States
- Canada
- Mexico
- South America
- Brazil
- Argentina
- Rest of South America
- Europe
- United Kingdom
- Germany
- France
- Italy
- Rest of Europe
- Asia Pacific
- China
- Japan
- India
- South Korea
- Rest of Asia Pacific
- Middle East and Africa
- Middle East
- United Arab Emirates
- Saudi Arabia
- Rest of Middle East
- Africa
- South Africa
- Egypt
- Rest of Africa
- Middle East
- North America
Data Sources, Market Sizing, and Validation
Desk Research
Desk research was used to set the boundary for machine translation revenue and to ground the model in measurable demand signals. We relied on public sources such as the US Bureau of Economic Analysis for macro indicators, the US International Trade Commission and UN Comtrade for trade patterns tied to language and software services, and World Bank and OECD datasets for digital adoption and enterprise spend context.
We also referenced technical and policy signals that shape usage, such as publications from NIST and other standards bodies, and peer-reviewed NLP and translation quality research that clarifies practical performance thresholds. To complement this, we reviewed company annual reports, investor decks, product documentation, and reputable press for pricing approaches and go-to-market changes. We also used paid subscriptions for company financials, patent databases, and news and financials to cross-check timelines and scale. These examples are not exhaustive, and other public sources were used for data collection, validation, and clarification.
Primary Interviews and Surveys
Primary work focused on interviews and surveys with solution providers, system integrators, and enterprise buyers who manage multilingual content, customer support, and localization programs. We covered demand and adoption across APAC, EMEA, and the Americas, so assumptions on deployment mix, purchasing routes, and price movement could be checked, then refined where gaps remained.
Distribution of primary research fieldwork respondents
| Company type | Respondent position | Region |
|---|---|---|
| Top tier: 26% | CXOs: 13% | APAC: 39% |
| Mid tier: 57% | Functional/Unit leaders: 31% | EMEA: 37% |
| Smaller Players: 17% | Managers: 56% | Americas: 24% |
Market-Sizing & Forecasting
Sizing is built using a top-down and bottom-up approach. The top-down view reconstructs addressable spend by linking digital content growth and multilingual workload expansion to machine translation penetration and average monetization levels. In practice, the model uses indicators such as enterprise cloud adoption, cross-border e-commerce activity, contact-center and support interaction volumes, localization intensity in software and media releases, and the shift toward neural translation deployments to explain where demand concentrates.
After setting the demand pool, we run selective bottom-up checks so totals stay realistic. This includes sampled price-per-million-characters or subscription ranges multiplied by estimated usage tiers, plus channel checks on how much is sold direct versus via platforms or integrators. When disclosure is limited for a region or vertical, we use proxy variables like internet users, international business activity, and relative IT spending, then confirm via expert inputs. For forecasting, scenario analysis is used, since adoption can move faster or slower depending on regulation, data residency requirements, and buyer comfort with quality and security for sensitive content.
Data Validation & Update Cycle
Outputs are validated through multiple checks so the final number remains consistent with real-world signals. We compare results against independent indicators such as regional enterprise software spending trends, observable shifts in localization workflows, and pricing movement seen in common buying motions, then review anomalies before sign-off.
A second analyst review is used to stress-test assumptions, especially for penetration, price progression, and regional mix. Re-contact is triggered when a variance cannot be explained with available evidence. Reports are refreshed annually, with interim updates when material events occur, and a final pre-delivery pass is completed so clients receive the latest updated view.
Mordor Intelligence's Machine Translation Market Size Versus Other Published Estimates
Published market estimates for machine translation can differ even when they look similar on the surface. Each study draws its boundary around products, services, and buying channels slightly differently. Differences also come from the choice of base year, how pricing is carried forward, and how strictly assumptions are checked against adoption signals.
By tracking usage-linked demand indicators and refreshing price and deployment assumptions through expert checks, Mordor Intelligence keeps the 2026 value tied to machine translation software plus related services while avoiding adjacent language service revenue that is not directly attributable to MT.
Benchmark comparison
| Source | Market Size | Gaps in Research Methodology |
|---|---|---|
| Mordor Intelligence | USD 1.26 B (2026) | |
| Industry Publisher A | USD 0.68 B (2024) | Uses an earlier-year view with a narrower monetized scope, which can undercount subscription expansion and cloud deployments that scaled after the stated year. |
| Global Consultancy B | USD 1.66 B (2026) | Likely includes a broader spend umbrella that can blend machine translation with surrounding localization workflow revenue, and it may assume a faster price uplift across enterprise plans. |
The table shows that much of the spread comes from what is counted as machine translation revenue and how quickly pricing and adoption are moved forward year to year. When scope is kept tight to MT software and related services, and when assumptions are repeatedly checked against deployment and demand signals, the resulting market size stays easier to trace and replicate.


Key Questions Answered in the Report
How big could global spending on machine translation become by 2031?
Total outlays are projected to reach USD 2.19 billion by 2031, rising at an 11.69% CAGR from the 2026 baseline.
Which technology is expanding fastest for automated translation?
Transformer-based neural machine translation is forecast to post a 12.71% CAGR through 2031, outpacing all other approaches.
Is growth stronger for cloud or for edge deployments?
Edge and on-device inference is the faster mover, advancing at a 12.36% CAGR while cloud solutions grow from a much larger base.
Which end-user segment is set to record the highest adoption rate?
Healthcare and life sciences lead with a projected 13.66% CAGR as global clinical-trial and patient-consent localization intensifies.
What core challenge still limits wider roll-out?
Accuracy remains inconsistent in many low-resource languages, often requiring costly human post-editing to meet professional standards.
How competitive is the vendor landscape?
The top five providers hold roughly 60-65% share, giving the space a moderate concentration score of 6 on a 10-point scale.
Page last updated on:





