
Low Voltage DC Circuit Breaker Market Size and Share
Market Overview
| Study Period | 2021 - 2031 |
|---|---|
| Market Size (2026) | USD 2.33 Billion |
| Market Size (2031) | USD 3.02 Billion |
| Growth Rate (2026 - 2031) | 5.34 % |
| Fastest Growing Market | Asia-Pacific |
| Largest Market | Asia-Pacific |
| Market Concentration | Medium |
Major Players *Disclaimer: Major Players sorted in no particular order Image © Mordor Intelligence. Reuse requires attribution under CC BY 4.0. | |
Low Voltage DC Circuit Breaker Market Analysis by Mordor Intelligence
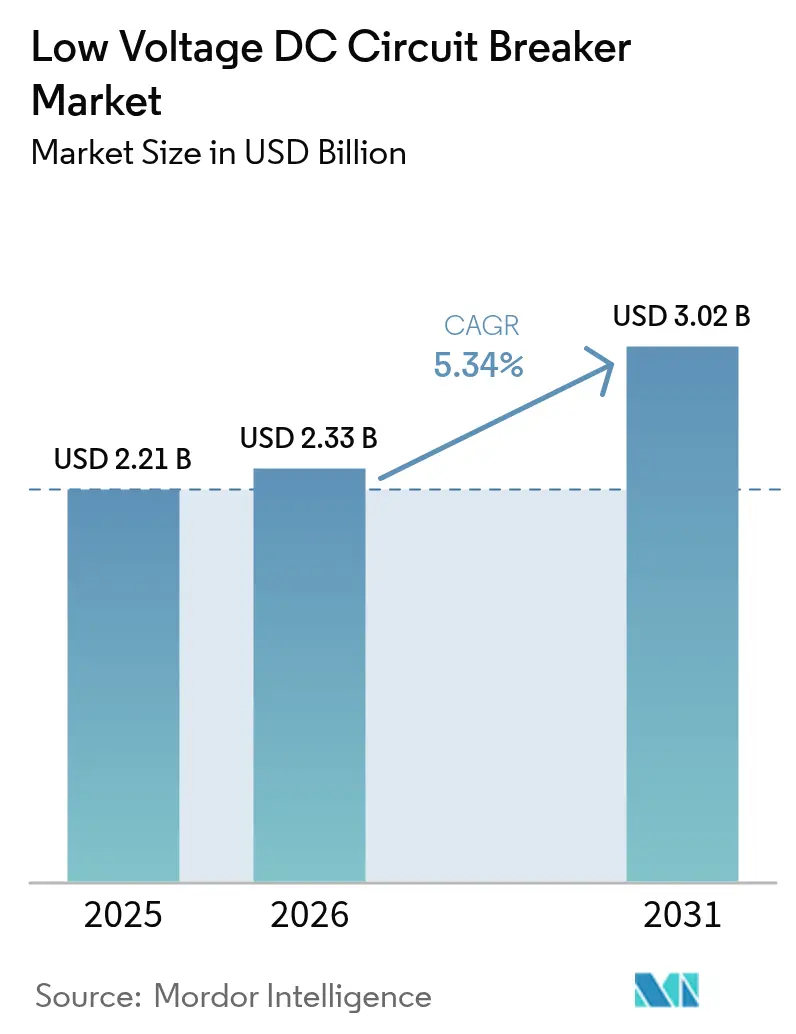
The Low Voltage DC Circuit Breaker Market size was valued at USD 2.21 billion in 2025 and estimated to grow from USD 2.33 billion in 2026 to reach USD 3.02 billion by 2031, at a CAGR of 5.34% during the forecast period (2026-2031).
This steady climb reflects the global shift from alternating current to direct current infrastructure as renewables, digital assets, and transport electrification demand higher power reliability. The mechanical segment still dominates shipments, yet the nascent solid-state technology is vaulting forward on the back of data center and battery storage requirements. Voltage migration toward the 380-750 V DC class underpins higher-density applications, while the Asia-Pacific region’s industrial modernization maintains its clear leadership position. Cost premiums and standard fragmentation remain headwinds, but regulatory mandates, such as IEC 62955 and UL 489I, continue to accelerate the uptake of certified products, especially in EV charging. Strategic moves from the traditional powerhouses and by agile solid-state specialists are reshaping a moderately consolidated supplier landscape.
Key Report Takeaways
- By voltage rating, the 380-750 V range is forecast to expand at a 10.65% CAGR through 2031, whereas the 120-380 V class held 59.40% of the low-voltage DC circuit breaker market size in 2025.
- By breaking mechanism, solid-state devices are expected to grow at a 33.6% CAGR through 2031, while mechanical breakers are projected to preserve 92.75% of the low-voltage DC circuit breaker market share in 2025.
- By installation mode, DIN-rail accounted for 48.10% of the low-voltage DC circuit breaker market size in 2025 and is projected to grow at a 6.42% CAGR.
- By type, the molded case circuit breaker captured 44.35% of the low-voltage DC circuit breaker market size in 2025 and is projected to grow at a 6.12% CAGR.
- By end user, battery energy storage systems are set to register the fastest 7.61% CAGR through 2031, while solar PV plants commanded 34.65% of the low-voltage DC circuit breaker market size in 2025.
- By geography, the Asia-Pacific region accounted for 42.15% of global revenue in 2025, and it is predicted to remain the fastest-growing area at a 5.83% CAGR through 2031.
Note: Market size and forecast figures in this report are generated using Mordor Intelligence’s proprietary estimation framework, updated with the latest available data and insights as of 2026.
Market Trends and Insights
Drivers Impact Analysis of Low Voltage DC Circuit Breaker Market*
| Driver | (~)% Impact on CAGR Forecast | Geographic Relevance | Impact Timeline |
|---|---|---|---|
| Surge in renewable (solar + storage) deployments | +1.80% | Global, with concentration in APAC and North America | Medium term (2-4 years) |
| Expansion of hyperscale data centres | +1.20% | North America & EU, expanding to APAC | Short term (≤ 2 years) |
| Electrification of rail & metro DC traction | +0.90% | APAC core, spill-over to Europe and MEA | Long term (≥ 4 years) |
| Rapid roll-out of 48 V DC telecom & 400 V commercial microgrids | +0.70% | Global, with early adoption in North America and EU | Medium term (2-4 years) |
| IEC 62955 / UL 489I fast-charging arc-fault mandates | +0.60% | Global, led by regulatory-compliant markets | Short term (≤ 2 years) |
| Source: Mordor Intelligence | |||
Surge in Renewable (Solar + Storage) Deployments
Utility-scale solar sites increasingly pair with co-located batteries, and both subsystems operate natively on direct current. Because DC lacks the natural zero-crossing of AC, these installations need specialist interruption hardware that can extinguish arcs quickly and reliably. ABB’s SACE Infinitus solid-state breaker, which interrupts unlimited prospective fault currents, illustrates how manufacturers address this challenge.(1)ABB, “SACE Infinitus Solid-State Circuit Breaker,” abb.comEaton’s 5 MW solar + 1.1 MW storage microgrid in Puerto Rico shows field-level deployment where DC protection safeguards bidirectional power flows.(2)Eaton, “Eaton to Acquire Resilient Power Systems,” eaton.comIncreasing PV additions and storage mandates, therefore, underpin rising volumes for the low-voltage DC circuit breaker market.
Expansion of Hyperscale Data Centres
Hyperscale operators eliminate multiple AC-to-DC conversions by shifting distribution backbones to direct current. The 20 MW Jupiter supercomputer in Germany typifies the growing power intensity of AI and HPC facilities. ABB’s SACE Emax 3, certified to IEC 62443 Security Level 2, delivers cyber-secure power protection for such sites. Adding modular on-site renewables raises DC fault-management complexity, widening procurement appetite for advanced breakers within the low-voltage DC circuit breaker market.
Electrification of Rail & Metro DC Traction
Metro and rail authorities favor DC traction for regenerative braking and simpler converter design. Bidirectional energy capture requires circuit breakers that can interrupt current in both directions without delay. As projects in China and India ramp up, they lock in long-term demand for robust DC protection systems to meet service-continuity targets.
Rapid Roll-out of 48 V DC Telecom & 400 V Commercial Microgrids
Telecom operators are migrating to 48 V backup architectures to reduce I²R losses, while commercial buildings are adopting 400 V DC buses to integrate solar arrays, stationary batteries, and EV chargers seamlessly. ABB’s collaboration with the University of Genova on common DC bus research advances solid-state protection for such installations. These shifts collectively swell addressable volumes in the low-voltage DC circuit breaker market.
Restraints Impact Analysis of Low Voltage DC Circuit Breaker Market*
| Restraint | (~) % Impact on CAGR Forecast | Geographic Relevance | Impact Timeline |
|---|---|---|---|
| Cost premium vs. comparable AC breakers | -1.10% | Global, particularly price-sensitive emerging markets | Medium term (2-4 years) |
| Fragmented DC standards below 1 kV | -0.80% | Global, with regional variations in adoption | Long term (≥ 4 years) |
| High SiC solid-state breaker BOM cost | -0.60% | Global, affecting premium applications | Short term (≤ 2 years) |
| Source: Mordor Intelligence | |||
Cost Premium vs. Comparable AC Breakers
Special contact alloys, arc chutes, and low-volume production result in DC breaker bills of materials that are 40-60% higher than those of their AC peers. This price gap stalls orders in cost-sensitive segments, especially where investment is tied to near-term returns rather than lifecycle savings.
Fragmented DC Standards Below 1 kV
IEC 60947-2:2024 extends coverage up to 1,500 V DC; however, regional codes vary regarding testing, isolation, and grounding. Multinational projects often face duplicate certifications, which increases engineering hours and slows down procurement.
*Our forecasts treat driver/restraint impacts as directional, not additive. The impact forecasts reflect baseline growth, mix effects, and variable interactions.
Low Voltage DC Circuit Breaker Market Segment Analysis
By Voltage Rating:
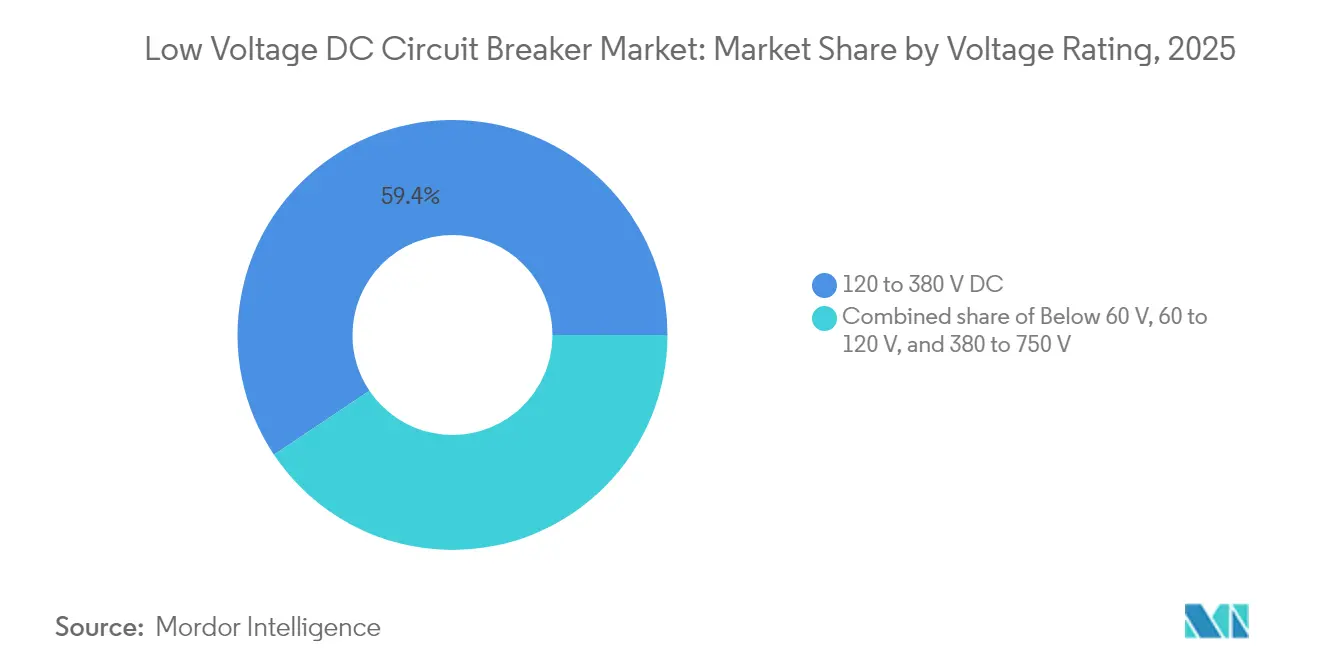
Higher Voltages Drive Premium ApplicationsThe low-voltage DC circuit breaker market size for the 120-380 V class equaled 59.40% in 2025, supporting most telecom, data center, and light industrial loads. Demand is gradually skewing upward as developers adopt 380-750 V buses to cut conductor size and shorten charging sessions. This upper voltage group is projected to climb at a 10.65% CAGR, significantly outpacing lower ranges. Higher voltages support fast chargers and megawatt-scale batteries, bolstering revenues for premium-priced solid-state devices.
At the sub-60 V end of the curve, telco back-up power retains steady sales but limited incremental upside. Residential rooftop solar in the 60-120 V bracket shows modest additions, whereas the surge in megawatt charging architecture beyond 400 V points to the next performance horizon.



By Breaking Mechanism:
Solid-State Revolution AcceleratesMechanical models accounted for 92.75% of the low-voltage DC circuit breaker market share in 2025 due to cost parity, dealer familiarity, and established safety certifications. Nevertheless, the solid-state subset is expected to grow 33.6% annually as hyperscale operators prioritize arc-free switching and predictive maintenance. ABB’s fully certified Infinitus, rated 2,500 A at 1,250 V DC, sets a benchmark for loss reduction and unlimited fault current withstand. Hybrid versions that combine silicon carbide switching with mechanical isolation offer a pragmatic bridge for critical infrastructure operators.
Mechanical units remain a staple for mainstream solar arrays and industrial panels until the pricing of wide-bandgap semiconductors falls. However, the shift toward software-defined protection makes the solid-state path irreversible across safety-critical end markets.
By Installation Mode:
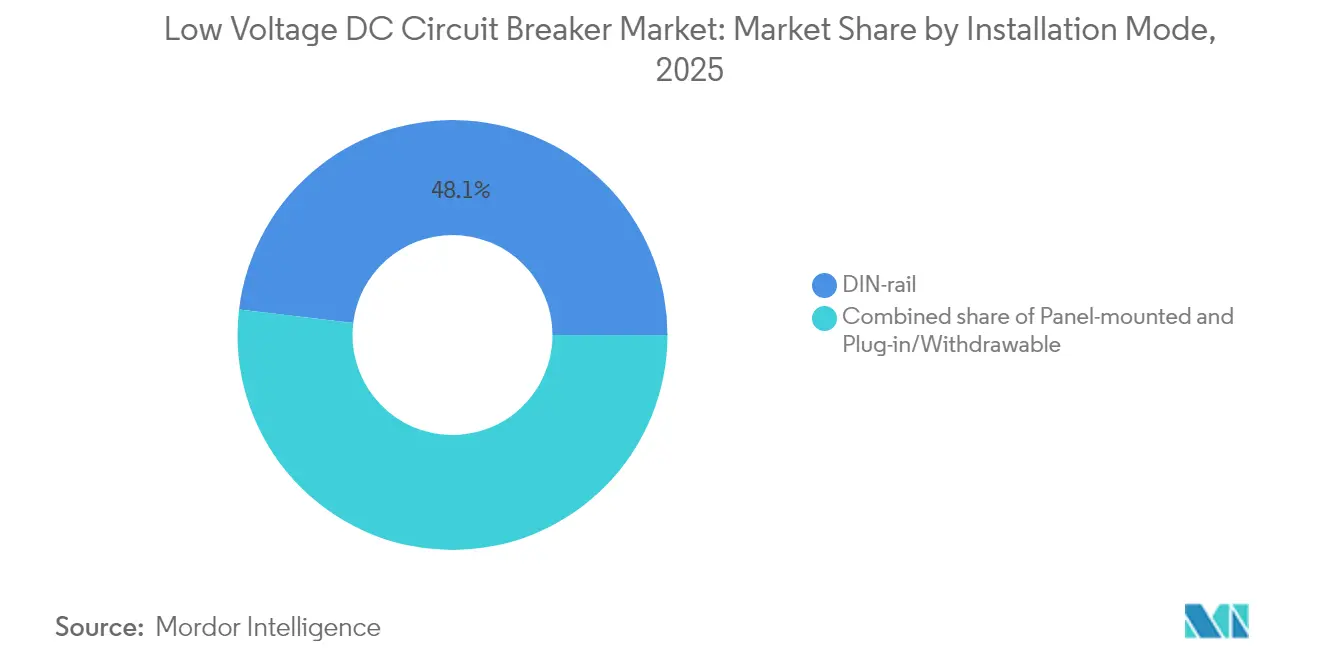
DIN-Rail Dominance Reflects StandardizationDIN-rail breakers accounted for 48.10% of 2025 shipments and are expected to post a 6.42% CAGR through 2031, as builders increasingly favor modular designs. Quick-clip installation and compact footprints lower installation man-hours. Schneider Electric’s DIN-friendly MicroLogic X integrates advanced metering and trip customization without enlarging panel depth. Panel-mounted assemblies cater to current ratings that exceed DIN physical limits, while withdrawable drawers remain essential for mission-critical switchgear that requires online maintenance.
By Type:
Molded Case Dominance Spans ApplicationsMolded case solutions held 44.35% of 2025 demand and are on track for a 6.12% CAGR. Their versatility bridges residential, commercial, and light industrial uses where mid-range ampacity and cost efficiency converge. Eaton’s PVGard series combines disconnect and overcurrent safety in a single, molded frame for rooftop and community solar skids. Air circuit breakers are designed to handle higher currents in utility vaults, whereas miniature models serve branch circuits in homes and telecom shelters.
By End User:
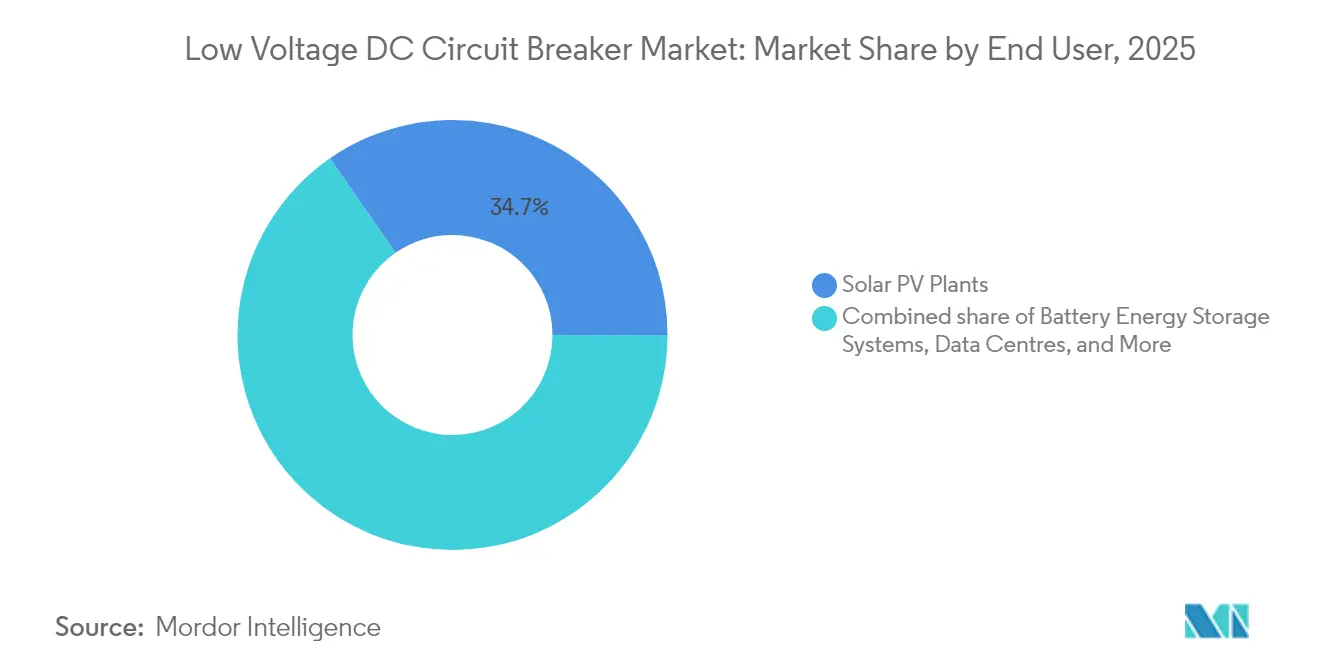
Storage Systems Outpace Solar GrowthBattery energy storage is set to be the breakout customer group, logging a 7.61% CAGR through 2031 as grid operators deploy 4-hour and 8-hour battery blocks for frequency and capacity services. Solar farms still drive the lion's share of demand, accounting for 34.65% of the low-voltage DC circuit breaker market size, but their growth is comparatively slower, as many regions have reached saturation quotas. Data centers, EV charging, rail traction, and marine installations round out secondary use cases, each pushing specifications toward bidirectional and high-speed interruption.
Geography Analysis
APAC Low Voltage DC Circuit Breaker Market
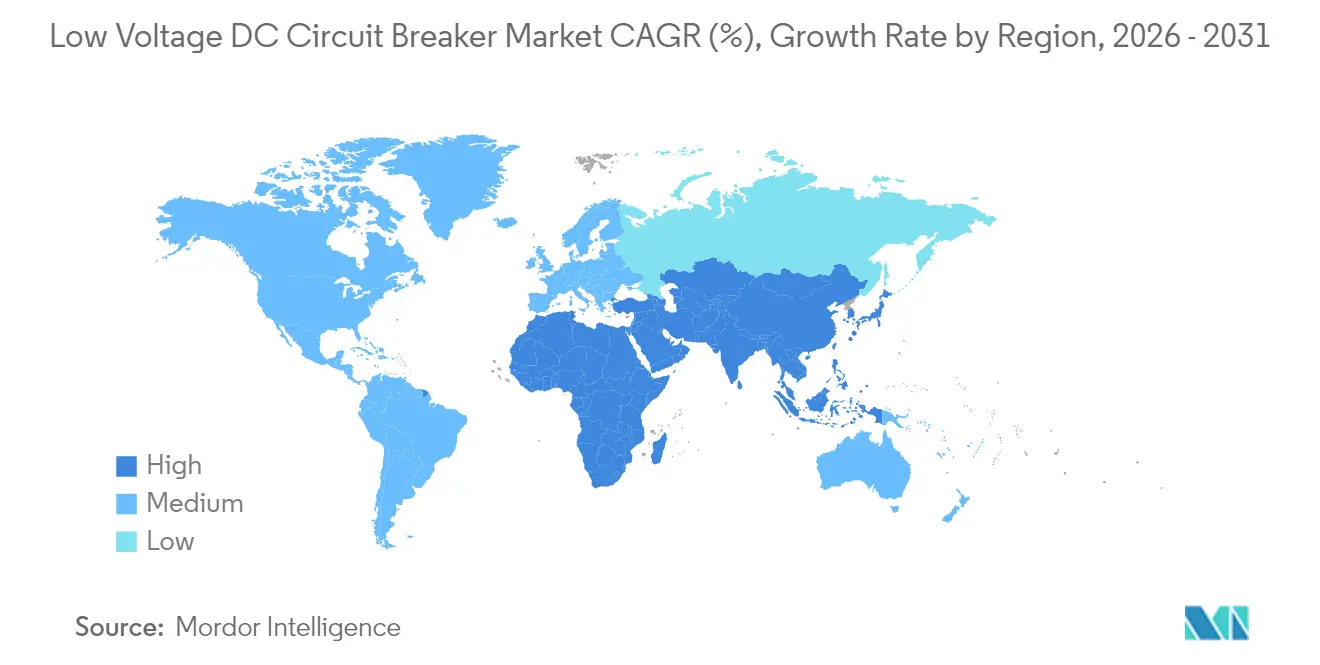
Asia-Pacific booked 42.15% of worldwide revenue in 2025, underpinned by China’s solar manufacturing might, India’s metro expansions, and Southeast Asia’s industrial electrification policies. Regional CAGRs of around 5.83% are sustained by government clean-energy targets and localization incentives, making the APAC region the strategic nucleus for global suppliers. CHINT Electrics’ USD 8.94 billion turnover in 2024 captures the sheer scale of component demand across the block.
North America Low Voltage DC Circuit Breaker Market
North America holds the second-largest slice of the low-voltage DC circuit breaker market. Hyperscale campuses stretching from Virginia to Oregon, combined with legislation such as the Inflation Reduction Act, keep investment pipelines robust. Early adoption of solid-state designs by Tier-IV data halls gives local vendors a head start.
Europe Low Voltage DC Circuit Breaker Market
Europe, ranked third, is propelled by rigorous efficiency directives and rail electrification budgets. The European High-Performance Computing Joint Undertaking’s megawatt-scale supercomputers exemplify the continent’s appetite for high-density DC architectures.
MEA and South America Low Voltage DC Circuit Breaker Market
South America, the Middle East, and Africa are still formative, but they enjoy strong stories of microgrid and off-grid renewables. Projects bringing electricity to remote mining camps or island territories often skip AC altogether, creating beachheads for DC breaker suppliers as price points decline.

Regulatory Landscape
International and national standards act as the key regulatory anchors for low-voltage DC circuit breaker design, testing, and market access, particularly as DC architectures expand in EV charging, storage, and data-center power distribution. IEC 60947-2:2024 (published September 18, 2024) expanded DC-specific requirements for circuit breakers up to 1,500 V DC, including updates related to suitability for isolation and DC dielectric testing, while the aligned European adoption EN IEC 60947-2:2025 sets a national implementation deadline of February 28, 2026 with withdrawal of conflicting standards by February 29, 2028.
In North America, UL 489 Edition 14 (ANSI approved March 7, 2025) extends coverage to molded-case circuit breakers rated up to 1,500 V DC and adds requirements such as energy-reducing maintenance settings, with full report compliance required by March 7, 2027. Household and similar applications are further covered through IEC 60898-3:2025/A11:2025 (published March 7, 2025) for DC breakers up to 440 V DC and 125 A, while IEC SRD 63317:2025 (October 2025) provides system-level guidance for LVDC industrial applications, supporting vendor-independent integration of generation, storage, and loads.
Competitive Landscape
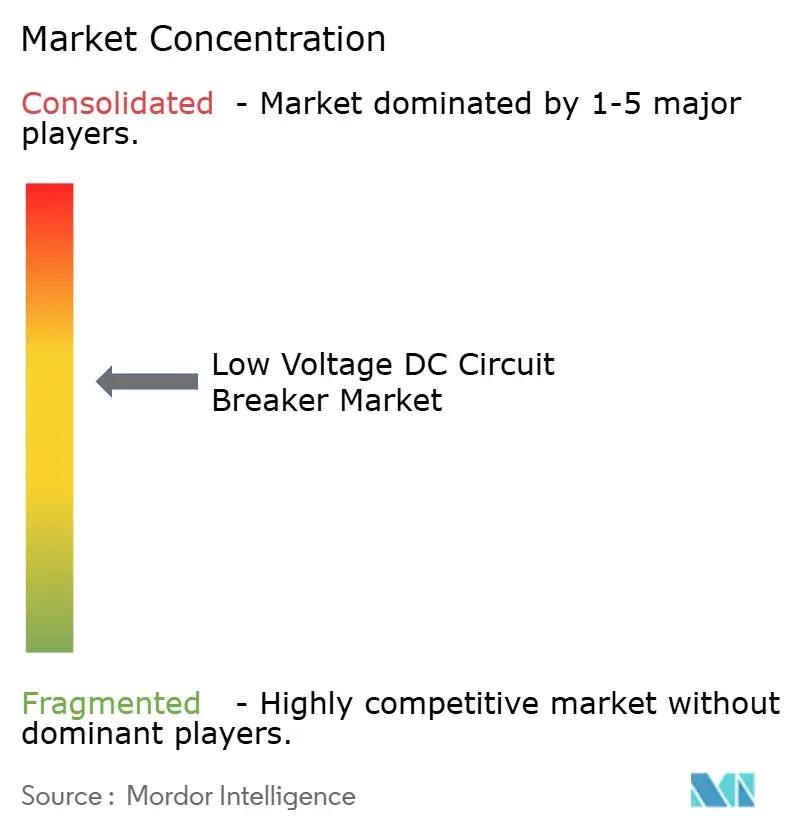
The market structure is moderately consolidated, with ABB, Schneider Electric, Siemens, and Eaton leveraging global channels to cross-sell DC lines alongside their legacy AC catalogues. ABB deepened its renewable positioning by acquiring Gamesa Electric’s power-electronics business, adding 40 GW of installed base under service contracts. Schneider Electric continues to refine software-defined protection suites, while Siemens integrates digital twins to simulate DC fault behaviour before site deployment.
Disruptive entrants concentrate on solid-state designs using silicon carbide or gallium nitride. Their edge lies in nanosecond switching, arc-free operation, and embedded diagnostics; however, scale remains a hurdle. Partnerships between incumbents and start-ups—Eaton’s 2025 agreement to buy Resilient Power Systems, for example—illustrate how the value chain is coalescing around hybrid portfolios.
Long-term competitive advantage will stem from certification breadth, software ecosystems, and lifecycle services rather than hardware alone. Vendors blending predictive analytics, cybersecurity, and energy-management APIs are best placed to defend their position against becoming commoditized, as they share core breaker functionalities that can help them remain competitive.
Low Voltage DC Circuit Breaker Industry Leaders
ABB Ltd
Larsen & Toubro Limited
Mitsubishi Electric Corporation
Fuji Electric Co Ltd
Siemens AG
- *Disclaimer: Major Players sorted in no particular order
Low Voltage DC Circuit Breaker Market Companies Covered in this Report
- ABB Ltd
- Eaton Corp plc
- Schneider Electric SE
- Siemens AG
- Mitsubishi Electric Corp
- Hitachi Energy Ltd
- Rockwell Automation Inc
- Sensata Technologies PLC
- Fuji Electric Co Ltd
- Hyundai Electric & Energy Systems
- CG Power & Industrial Solutions
- Larsen & Toubro Ltd
- Entec Electric & Electronic
- Legrand SA
- Littelfuse Inc
- Mersen SA
- Blue Sea Systems
- Carling Technologies
- NOARK Electric
- Bentek Corp

Market Opportunities and Future Outlook
A major near-term whitespace centers on faster, arc-free protection for high-density DC backbones used in data centers, EV fast charging, and battery energy storage. Because fault interruption occurs without a natural current zero-crossing, these applications demand performance beyond conventional mechanical designs. Commercialization signals are visible in April 2026, when Siemens Smart Infrastructure launched its SENTRON 3QD2 semiconductor circuit breaker (using SiC power modules from Infineon) alongside a broader DC protection and switching portfolio, reflecting customer demand for microsecond-range short-circuit interruption and more software-driven protection behavior.
Compliance-led retrofit and recertification also represent an actionable opportunity as standards tighten and harmonize DC requirements across regions. IEC 60947-2:2024 and the aligned EN IEC 60947-2:2025 adoption timeline (national implementation by February 2026) are pushing OEMs, panel builders, and EPCs to specify certified DC breakers, while UL 489 Edition 14 (ANSI March 2025, compliance by March 2027) creates a defined window for vendors to refresh UL-listed portfolios for DC use cases. System-level LVDC guidance such as IEC SRD 63317:2025 further supports integrated offerings, with breakers bundled with switchboards, busbars, and digital monitoring that can reduce engineering overhead for industrial LVDC deployments.
Recent Industry Developments in Low Voltage DC Circuit Breaker Market
- April 2026: Siemens Smart Infrastructure launched and deployed the SENTRON 3QD2 semiconductor circuit breaker as part of a broader DC technology portfolio. The device applies semiconductor switching and smart protection algorithms to interrupt short circuits in the microsecond range, shifting DC protection toward arc-free, digitally controlled architectures for data centers, renewables, and other high-availability loads.
- July 2025: Eaton agreed to acquire Resilient Power Systems Inc. to extend its capabilities in solid-state transformer technology. The move targets power conversion and protection needs in EV charging and data centers, strengthening bundled offerings where DC distribution and fast protection requirements increasingly converge.
- December 2024: ABB completed its purchase of Gamesa Electric’s power-electronics division, adding a sizable installed base under service. The acquisition reinforces ABB’s positioning across DC-heavy renewable and storage power stacks, supporting tighter integration between power electronics and downstream protection components in project delivery.


Low Voltage DC Circuit Breaker Market Report Scope and Research Methodology
Market Definition and Coverage
For this methodology, the market covers revenue earned from low voltage DC circuit breakers used to protect DC circuits by interrupting overloads and short circuits across common DC power systems.
Scope exclusions: We exclude medium and high voltage DC breakers, AC-only circuit breakers, and revenues from installation labor, commissioning, and downstream maintenance services.
Segments Covered in This Report
- By Voltage Rating
- Below 60 V
- 60 to 120 V
- 120 to 380 V
- 380 to 750 V
- By Breaking Mechanism
- Mechanical
- Solid-state
- Hybrid
- By Installation Mode
- DIN-rail
- Panel-mounted
- Plug-in/Withdrawable
- By Type
- Air Circuit Breaker
- Molded Case Circuit Breaker
- Miniature Circuit Breaker
- By End User
- Battery Energy Storage Systems
- Data Centres
- Solar PV Plants
- EV Fast-Charging Infrastructure
- Rail Transit and Metro
- Marine and Offshore
- Others
- By Geography
- North America
- United States
- Canada
- Mexico
- Europe
- Germany
- United Kingdom
- France
- Italy
- NORDIC Countries
- Russia
- Rest of Europe
- Asia-Pacific
- China
- India
- Japan
- South Korea
- ASEAN Countries
- Rest of Asia-Pacific
- South America
- Brazil
- Argentina
- Rest of South America
- Middle East and Africa
- Saudi Arabia
- United Arab Emirates
- South Africa
- Egypt
- Rest of Middle East and Africa
- North America
Data Sources, Market Sizing, and Validation
Desk Research
We start by organizing the market around what can be observed and verified from public records, then we apply a structured set of assumptions for missing data points. Desk work uses public and official sources such as International Energy Agency (IEA) releases, IRENA renewable capacity updates, US Energy Information Administration (EIA) statistics, Eurostat energy datasets, and UN Comtrade trade flows for electrical equipment, which help frame demand drivers and regional build pace.
To ground the supply side, we review company annual reports and investor presentations, product catalogs and certification notes, and relevant electrical safety standards documentation, then we scan reputable business press coverage of project announcements. We also use a paid subscription for company financials and news to confirm business mix signals, and a patent database to track where DC protection designs are being filed and commercialized. The sources listed here are not exhaustive, and additional public references were used for clarification, cross-checking, and final validation.
Primary Interviews and Surveys
Next, we validate the sizing logic using interviews and structured surveys with OEMs, distributors, EPCs, and large end users, since published statistics rarely isolate low voltage DC protection at the product level. Because the market is global, inputs were checked across APAC, EMEA, and the Americas so pricing, product mix, and adoption assumptions reflect what buyers specify in solar PV, battery storage, EV charging, and industrial DC systems.
For the fieldwork, we also asked participants to comment on how often breakers are specified by voltage range in procurement, which helped align demand-to-protection-point conversion with how projects are actually quoted.
Distribution of primary research fieldwork respondents
| Company type | Respondent position | Region |
|---|---|---|
| Top tier: 33% | CXOs: 12% | APAC: 48% |
| Mid tier: 52% | Functional/Unit leaders: 34% | EMEA: 33% |
| Smaller Players: 15% | Managers: 54% | Americas: 19% |
Market-Sizing & Forecasting
Our model starts from a top-down demand pool build based on DC capacity additions and equipment intensity, where solar PV, battery energy storage, EV charging, and industrial DC loads are translated into expected protection points by voltage range. After that demand pool is built, results are corroborated using selective bottom-up checks, such as sampled average selling prices by rating band, distributor channel checks, and a roll-up of visible supplier revenue share to keep totals realistic.
Key inputs used in the model include installed and newly added solar and storage capacity, EV charging point deployment pace, typical breaker count per installation type, shifts in voltage rating mix (for example 120 to 380 V and 380 to 750 V applications), and observed price movement by interrupting rating and form factor. When a variable is not directly observable, the gap is handled by using a conservative range from primary feedback and then narrowing it after cross-checking against project economics and adoption timing.
For forecasting, we mainly use scenario analysis because project pipelines and policy-driven capex can swing year to year, and then we align the scenarios with expert consensus on adoption curves and pricing. Final outputs are converted to USD using consistent annual average rates for the modeled year so regional totals can be compared on the same basis.
Data Validation & Update Cycle
Outputs are validated through triangulation across independent signals, including capacity additions, equipment shipment commentary, and price checkpoints from interviews, before the numbers are finalized. If the model shows sharp jumps, unusual regional splits, or price changes that do not match what the market is indicating, we revisit assumptions and re-contact sources to confirm what changed.
Before sign-off, the file goes through multiple analyst reviews where formulas, units, and conversion logic are checked, followed by a reasonableness review against adjacent protection and DC distribution equipment trends. Reports are refreshed annually, with interim updates triggered by material events such as sudden policy shifts, major capex slowdowns, or supply disruptions, and a final pre-delivery review is done so clients receive the latest updated view.
Mordor Intelligence's Low Voltage Dc Cirduit Breaker Market Size Versus Other Published Estimates
Different publishers can arrive at different totals even when they are discussing the same product, since voltage limits, end-use mapping, and the year used as the current estimate are not always aligned. Differences also show up when pricing is assumed from list prices instead of transaction-like checkpoints, or when the forecast path assumes a single growth curve across all regions.
The main gap comes from whether low voltage DC breakers are strictly counted within defined voltage rating bands and shipped equipment revenue only, where Mordor Intelligence ties the sizing to capacity-led demand signals from solar PV and storage and then adjusts ASP progression using interview-validated rating mix changes.
Benchmark comparison
| Source | Market Size | Gaps in Research Methodology |
|---|---|---|
| Mordor Intelligence | USD 2.33 B (2026) | |
| Trade Journal A | USD 3.96 B (2025) | Often reflects a broader interpretation that can blend adjacent LV protection and DC distribution components, and it may use a more aggressive adoption curve for data centers and EV charging without a clear rating-band filter. |
| Industry Publisher B | USD 1.97 B (2025) | Typically relies on a sales-reported snapshot with limited visibility on regional mix and project-driven pull, which can undercount fast-growing applications like BESS where procurement happens through EPC-driven bundles. |
Taken together, the spread is mainly explained by scope choices around what is included with a DC protection sale, plus how pricing and adoption are carried forward between years. By keeping the scope linked to observable DC build indicators and then pressure-testing price and mix assumptions through repeated expert checks, the final number stays traceable to clear steps that can be repeated each update cycle.


Key Questions Answered in the Report
What is the projected value of the low voltage DC circuit breaker market by 2031?
The market is forecast to reach USD 3.02 billion in 2031, reflecting a 5.34% CAGR from 2026 to 2031.
Which breaking-mechanism segment is expanding the fastest?
Solid-state circuit breakers are set to grow at roughly 33.6% per year through 2031 as data centers, storage systems, and fast EV chargers demand arc-free, high-speed protection.
What end-user application is expected to post the highest growth rate?
Battery energy storage systems lead with an anticipated 7.61% CAGR because utilities and commercial sites need bidirectional DC protection for frequency regulation and peak-shaving services.
Why is Asia-Pacific the largest and fastest-growing regional market?
Aggressive renewable targets, large-scale rail and metro electrification, and expanding manufacturing bases in China, India, and Southeast Asia push APAC’s share to 42.15% in 2025 while maintaining the top regional CAGR of 5.83%.
How are new standards influencing product uptake?
Harmonized rules such as IEC 62955, IEC 60947-2:2024, and UL 489I tighten arc-fault and isolation requirements, making certified DC breakers mandatory for EV charging, storage, and microgrids and accelerating replacement of uncertified devices.
What remains the chief cost barrier to wider adoption?
DC breakers carry a 40-60% bill-of-materials premium over comparable AC units because of lower production volumes and specialized arc-extinction components, limiting penetration in price-sensitive projects.
Page last updated on:


 Your data is secure and never sold or shared.


