
Low VOC Adhesive Market Size and Share
Market Overview
| Study Period | 2020 - 2031 |
|---|---|
| Forecast Data Period | 2026 - 2031 |
| Historical Data Period | 2020 - 2024 |
| Growth Rate | 4.72 % |
| Fastest Growing Market | Asia Pacific |
| Largest Market | Asia Pacific |
| Market Concentration | Medium |
Major Players *Disclaimer: Major Players sorted in no particular order Image © Mordor Intelligence. Reuse requires attribution under CC BY 4.0. | |
Low VOC Adhesive Market Analysis by Mordor Intelligence
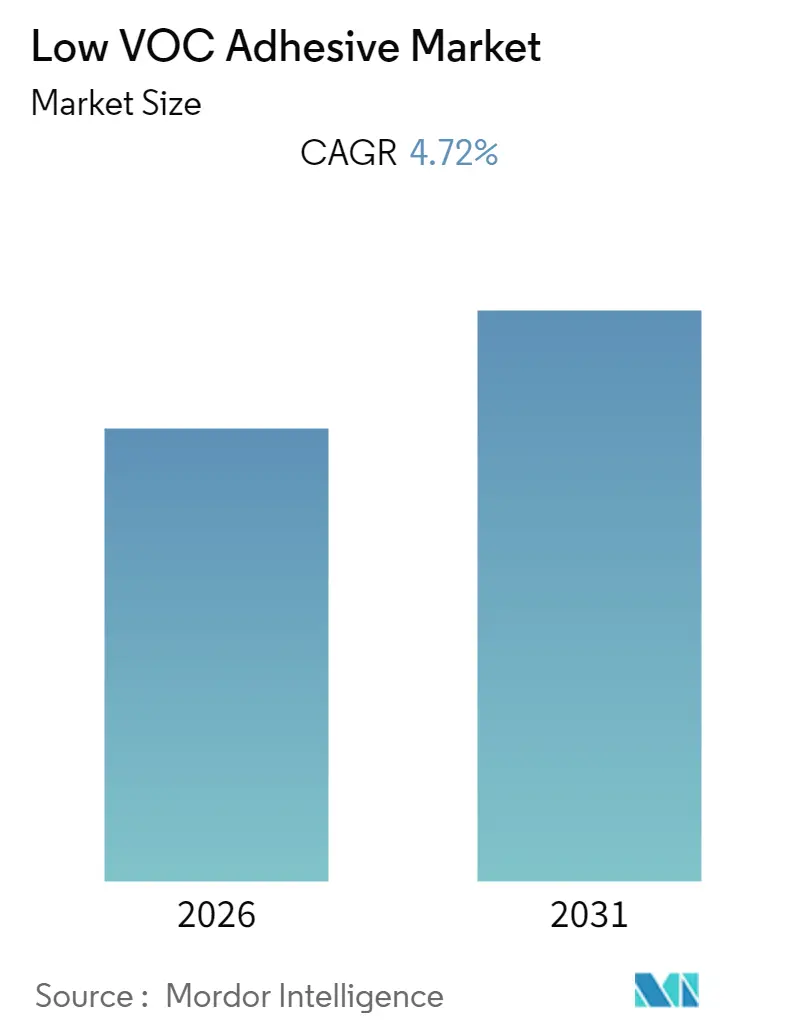
The Low VOC Adhesive Market size is expected to register a CAGR of 4.72% during the forecast period (2026-2031).
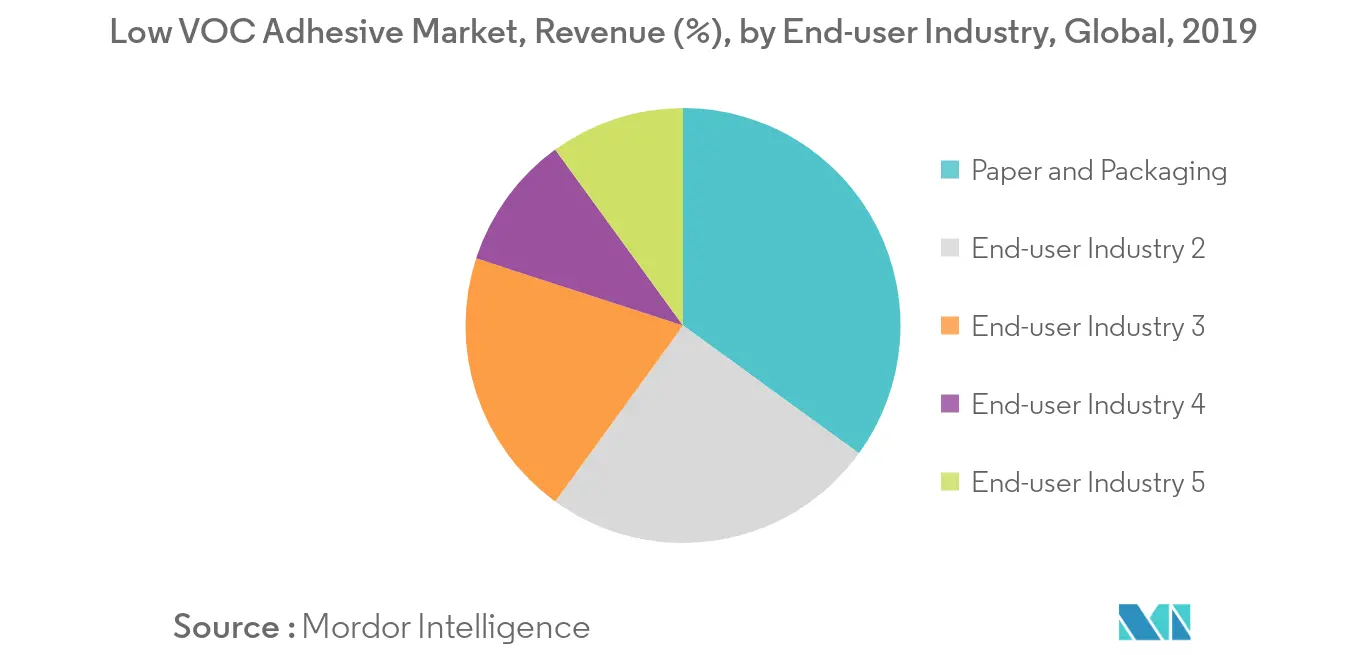
- The paper and packaging industry is expected to dominate the end-user industry segment of the global low VOC adhesive market as it offers excellent adhesion to many substrates such as case & carton, corrugated, food and beverage and flexible packaging.
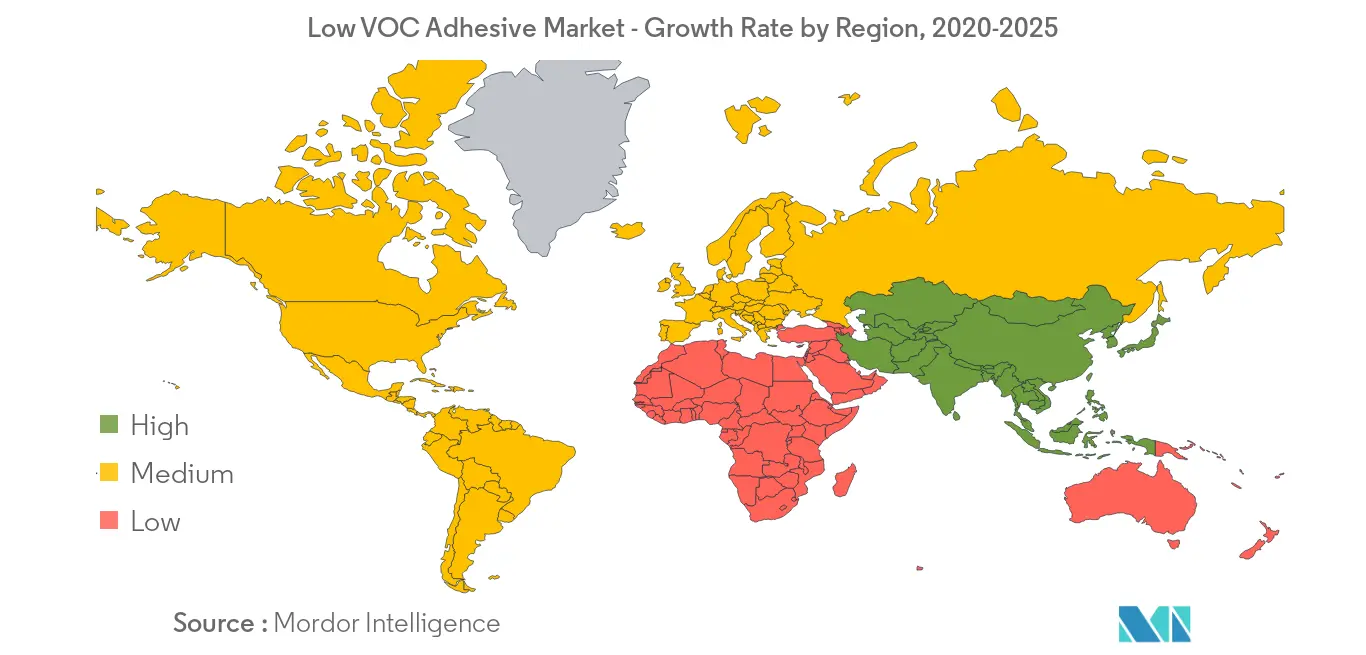
- Asia-Pacific region represents the largest market and is also expected to be the fastest-growing market over the forecast period owing to the consumption from countries such as China, India, and Japan.
Note: Market size and forecast figures in this report are generated using Mordor Intelligence’s proprietary estimation framework, updated with the latest available data and insights as of 2026.
Global Low VOC Adhesive Market Trends and Insights
Growing Demand from Paper and Packaging Industry
- The paper and packaging industry is estimated to hold the largest share of the overall low VOC adhesive market. The key reason of the growth is due to the extensive use of low VOC adhesives in various types of packaging such as case & carton, corrugated, food and beverage and flexible packaging.
- Also, the acceptance of low VOC adhesive in this industry is because of its easy clearance for food packaging from FDA and BGA agencies. Similarly, the hot-melt technology aids in attaining and maintaining similar performance in the high-speed packaging line.
- Growing demand for usage of ecofriendly compounds in packaging adhesives, on account of strict government regulations increases the manufacturing cost, which in turn is expected to restrain growth of the market. Furthermore, stringent government norms regarding environmental safety mandates emphasis on production of lower volatile organic compounds (VOC), which is anticipated to positively affect the low VOC adhesives market growth.
- Polyvinyl acetate (PVA) adhesives are extensively employed in the adhesive as a synthetic resin. PVA adhesives are environment friendly and offers properties such as waterborne nature, presence of less VOCs, and superior adhesion to different substrates. It has wide scope in packaging applications such as bookbinding, paper bags, cartons, labels, foils, film, paperboard decals, wood assembly, automobile upholstery, and leather binding.


Asia Pacific Region to Dominate the Market
- One of the key factors that has been rapid growth of the packaging segment comprises growing e-commerce platform and increasing consumption with rise in income levels of the masses.
- China holds the largest packaging industry in the region. The country is projected to witness a consistent growth during the period, owing to the rise of customized packaging, increased demand for packaged consumerist goods, in the food segment, like ready to eat foods, snack foods, and frozen foods, etc.
- Emerging economies, such as China, India, and South Korea, and other Southeast Asian countries are attracting global players to establish their manufacturing bases in Asia Pacific. These players are competing to create an extensive customer base in countries such as China and India to cater to the rising demand for adhesives from various end-user industries.
- In the transportation end-user industry, low VOC adhesives are employed extensively in applications such as aircraft, aerospace and automotive. The need to reduce weight by deploying thinner gauge metal and plastics has created various opportunities for adhesives in bonding applications. The increasing government regulations pertaining to indoor air quality in passenger vehicles and stringent automotive OEM standards are boosting the regional demand in the transportation end-user industry.

Regulatory Landscape
Low-VOC adhesive demand and product reformulation are shaped by chemical-substance restrictions and VOC content rules that vary by region. In the European Union, REACH remains a central compliance framework for adhesive chemistries, and updates to ECHA SVHC Candidate List entries (for example, additions in February 2026 such as n-hexane and the Bisphenol AF group) can trigger downstream SDS and supply-chain documentation updates for mixtures containing affected substances.
In the United States, VOC compliance is often driven by state and district programs rather than a single national limit. Air districts such as South Coast AQMD enforce category-specific requirements, notably Rule 1168 for adhesives and sealants, and use defined test methods for VOC content verification. Manufacturers supplying multiple US states manage overlapping indoor-material and consumer-product VOC constraints through product line rationalization, region-specific labeling, and reformulation strategies that reduce reliance on VOC-exempt solvents and other scrutinized constituents.
Value Chain Analysis
The low VOC adhesive value chain starts with upstream petrochemical and bio-based feedstocks and additives, which are converted into binders, monomers, tackifiers, plasticizers, and functional ingredients. These inputs then go to adhesive formulators producing water-based, hot-melt, and reactive systems, including PVA, VAE/EVA, acrylics, epoxy, and silane-modified platforms.
Downstream customers such as packaging converters, building and construction contractors/specifiers, transportation OEMs, and woodworking manufacturers qualify and specify these products, with performance validation, VOC documentation, and substrate compatibility testing acting as key gating steps. Distribution is typically split between direct supply to large OEMs/converters and regional distributors for construction and woodworking channels, with compliance documentation (SDS updates, VOC test results, and emissions claims) moving alongside product shipments. Regulatory-driven data obligations, such as South Coast AQMD quantity and emissions reporting cycles (for example, the 2025 QER cycle with additional content data requirements for specific solvents), increase the importance of traceable raw material sourcing and batch-level formulation control, and can shift sourcing toward qualified alternatives when certain substances face restrictions or heightened reporting burdens.
Competitive Landscape
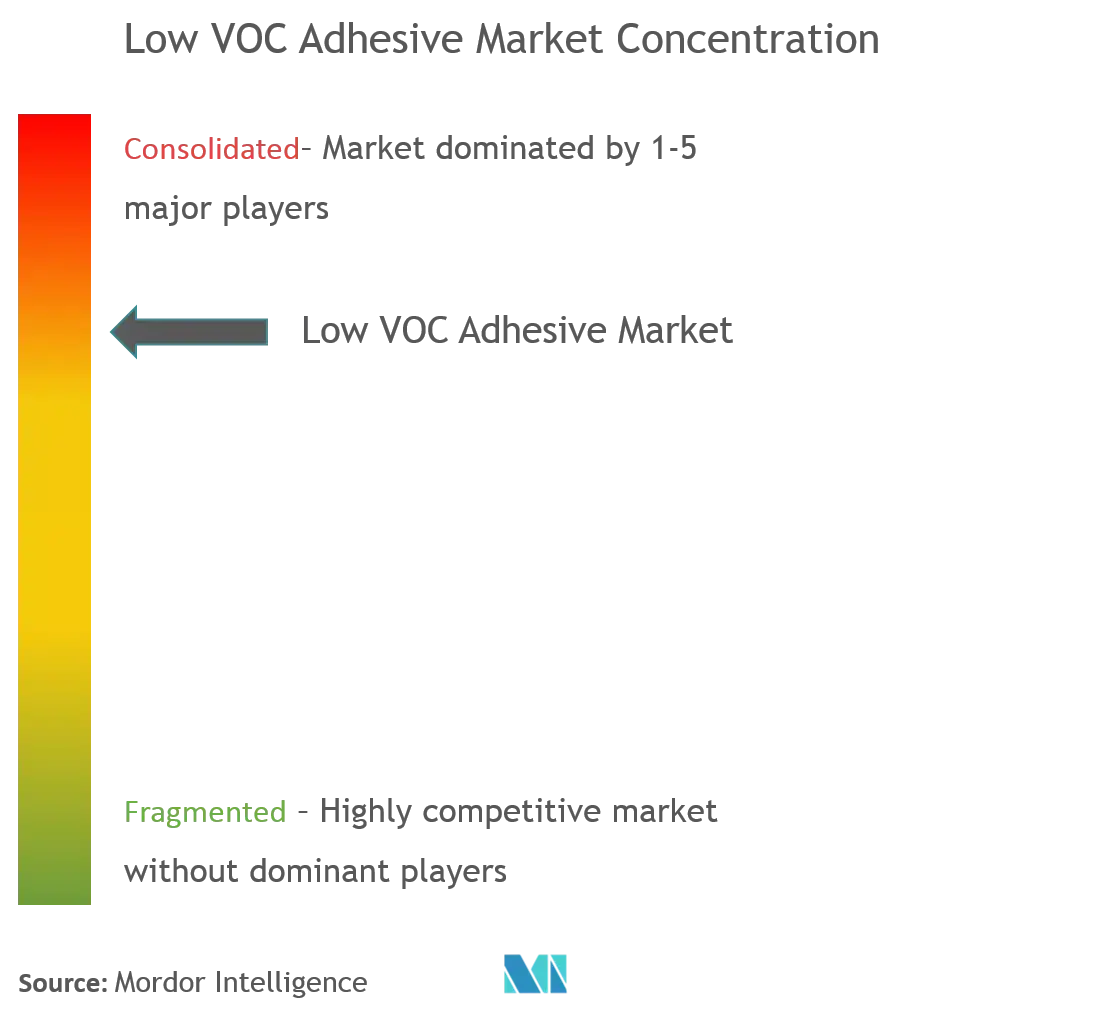
The Global Low VOC Adhesive Market is partially consolidated in nature with a few major players dominating a significant portion of the market. Some of the major companies are 3M, Akzo Nobel N.V., Ashland, H.B. Fuller Company and Huntsman Corporation and among others.
Low VOC Adhesive Industry Leaders
3M
Akzo Nobel N.V.
Ashland
H.B. Fuller Company
Huntsman Corporation
- *Disclaimer: Major Players sorted in no particular order

Market Opportunities and Future Outlook
Opportunities are concentrating where end users need verified low-emission performance without sacrificing throughput in high-speed lines and industrial assembly, particularly in paper and packaging, flooring, engineered wood, and heavy equipment. Product activity in 2026 supports this direction: Henkel introduced Teroson MS 9381 HPT in April 2026, a tin-free, solvent-free, and isocyanate-free silane-modified polymer adhesive sealant for heavy equipment, and Mapei introduced a No Added Formaldehyde PVA range (Vinavil PW) for plywood production in June 2026, pointing to demand for low-emission and formaldehyde-conscious solutions in demanding applications.
Capacity and localization programs also provide an execution path for suppliers to meet regional compliance requirements and shorten lead times. Examples include Sonoco's July 2025 announcement of a USD 30 million investment to expand adhesives and sealants manufacturing capacity, Q.E.P.'s completion of a new ROBERTS adhesive plant in Dalton, Georgia in July 2025 to expand output, and Henkel's facility expansion in Brandon, South Dakota completed in September 2025. These investments fit a market where VOC limits and indoor air quality requirements are increasingly specified at the state/district and customer level, making scalable production of water-based, solvent-free, and no-added-formaldehyde platforms actionable across multiple end-user segments.
Recent Industry Developments
- April 2026: Henkel introduced Teroson MS 9381 HPT, a tin-free, solvent-free, and isocyanate-free silane-modified polymer adhesive sealant for heavy equipment. The launch expands Henkel's Teroson portfolio into demanding mobility applications with lower odor and emissions requirements. This strengthens adoption in industrial assembly lines relying on high strength, low emissions materials.
- December 2025: Henkel launched Loctite MS 9650 for lightweight structural bonding for automotive display applications. The release extends Henkel's silane-modified polymer offering into mobility electronics where low-odor and low-emission attributes are embedded in OEM material approvals. The move aligns with a broader move toward configuration-friendly adhesives in vehicle interiors.
- March 2024: 3M introduced Fastbond Pressure Sensitive Adhesive 1049 with PowerCore technology. The product development targets customers seeking sustainability-aligned adhesive choices while maintaining pressure-sensitive performance, supporting substitution away from higher-VOC options in converting and industrial bonding uses.


Research Methodology Framework and Report Scope
Market Definition and Coverage
For this methodology, the low VOC adhesive market includes adhesive products formulated to meet low volatile organic compound emission targets and sold for bonding across industrial and consumer end uses.
Scope exclusions: sealants, surface coatings, and general solventborne adhesives that are not positioned or formulated as low VOC solutions are excluded.
Segmentation Overview
- Chemistry
- Polyvinyl Acetate (PVA)
- Polyacrylic Acetate (PAE)
- Vinyl Acetate/Ethylene (VAE)
- Ethylene Vinyl Acetate (EVA)
- Epoxy
- Others
- Type
- Water-based Adhesives
- Hot-melt Adhesives
- Reactive
- End-user Industry
- Paper and Packaging
- Building and Construction
- Transportation
- Woodworking
- Others
- Geography
- Asia-Pacific
- China
- India
- Japan
- South Korea
- Rest of Asia-Pacific
- North America
- United States
- Canada
- Mexico
- Europe
- Germany
- United Kingdom
- France
- Italy
- Rest of Europe
- South America
- Brazil
- Argentina
- Rest of South America
- Middle-East and Africa
- Saudi Arabia
- South Africa
- Rest of Middle-East and Africa
- Asia-Pacific
Data Sources, Market Sizing, and Validation
Desk Research
Desk research was used to set the market boundary, understand VOC rules that shape formulations, and build a consistent set of demand and supply indicators by region. Public references were reviewed, including US EPA VOC rules and guidance, European Commission and ECHA pages on chemical restrictions, and national environment agencies that publish emission limits and product labeling expectations.
To anchor volumes and pricing logic, UN Comtrade trade statistics for relevant resin and adhesive-related categories were used, along with US Census and Eurostat construction and manufacturing activity series. Association and standards bodies that publish low emission building and indoor air quality criteria, including building product certification guidance, were also reviewed.
Company filings, investor presentations, and reputable industry press were then used to cross-check capacity additions, end-market exposure, and whether raw material costs were being passed through into finished adhesive pricing. Selected paid subscriptions were used for company financials and patent databases to confirm product mix shifts and innovation focus. The sources listed here are illustrative only, and other public and paid references were also consulted for data collection and clarification.
Primary Interviews and Surveys
Primary work focused on validating what counts as low VOC in real buying decisions, how prices move across water-based, hot-melt, and reactive products, and which end uses are changing fastest. Interviews were conducted with a mix of formulators, distributors, and downstream users across APAC, EMEA, and the Americas, so assumptions could be tested against on-the-ground substitution trends and the timing of regional regulation rollouts.
Distribution of primary research fieldwork respondents
| Company type | Respondent position | Region |
|---|---|---|
| Top tier: 25% | CXOs: 13% | APAC: 41% |
| Mid tier: 58% | Functional/Unit leaders: 37% | EMEA: 32% |
| Smaller Players: 17% | Managers: 50% | Americas: 27% |
Market-Sizing & Forecasting
Sizing starts with a top-down reconstruction of demand by linking adhesive consumption to the activity base in major end uses, including packaging output, construction activity, transportation builds, and woodworking and furniture production. From there, low VOC penetration rates were applied using regulatory intensity, customer specifications for indoor air quality, and observed substitution away from higher VOC options.
To keep totals realistic, results were corroborated with selective bottom-up checks, including sampled supplier revenue exposure to low VOC lines, channel feedback on mix, and an ASP times volume sanity check for the most common systems. Key inputs tracked include the split between water-based, hot-melt, and reactive usage, resin mix shifts across PVA, acrylic, VAE, EVA, and epoxy families, regional construction starts and renovation spending, packaging conversion trends, and raw material movements that affect pricing.
Forecasts were built using scenario analysis to reflect different speeds of regulation enforcement and adoption, followed by expert validation of the scenario weights. Where bottom-up inputs were missing for smaller countries or niche uses, gaps were handled by using proxy industries with similar adhesive intensity, then adjusted during review calls until the assumptions matched observed market behavior.
Data Validation & Update Cycle
Outputs are checked through multiple steps, starting with variance tests across regions, chemistry families, and end-use linkages to flag values that do not match visible demand signals. Modeled totals are then compared with independent indicators such as trade movement, construction and manufacturing momentum, and publicly discussed pricing changes, and any outliers are reviewed again before sign-off.
The report is refreshed annually, and interim updates are triggered when material events occur, such as major regulation changes, sharp feedstock swings, or large capacity moves. Before delivery, a final review pass is completed so clients receive the latest view with updated assumptions and consistent currency treatment.
Mordor Intelligence's Low Voc Adhesive Market Estimate Compared With Other Published Estimates
Published market values can differ even when they use similar labels, because exchange-rate timing, the price logic behind low VOC premiums, and the frequency of model refreshes are not handled the same way by every publisher. When these basics move, the reported number changes too, even if the underlying demand picture remains similar.
In this study, exchange rates and ASP steps were refreshed on a set cadence and then rechecked using recent construction and packaging activity signals, which keeps the estimate aligned to the period being reported, a practice applied by Mordor Intelligence.
Benchmark comparison
| Source | Market Size | Gaps in Research Methodology |
|---|---|---|
| Mordor Intelligence | USD 66.43 B (2025) | |
| Industry Platform A | USD 69.67 B (2026) | Uses a later base year and may carry forward a broader product-form scope (for example, adding adjacent formats and distribution channels), which can lift the starting value even before growth is applied. |
| Trade Release B | USD 63.30 B (2026) | Often applies a fixed growth path from an older starting point and can embed a different premium assumption for low VOC formulations, which shifts ASP and therefore changes the total market value. |
The spread in the table is mainly explained by year timing and how pricing is treated, rather than a disagreement on where demand comes from. By keeping assumptions tied to visible end-use activity and by revalidating price and mix movements before finalizing totals, the market size stays traceable to clear inputs that can be repeated and checked.


Key Questions Answered in the Report
What is the current Low VOC Adhesive Market size?
The Low VOC Adhesive Market is projected to register a CAGR of 4.72% during the forecast period (2026-2031)
Who are the key players in Low VOC Adhesive Market?
3M, Akzo Nobel N.V., Ashland, H.B. Fuller Company and Huntsman Corporation are the major companies operating in the Low VOC Adhesive Market.
Which is the fastest growing region in Low VOC Adhesive Market?
Asia Pacific is estimated to grow at the highest CAGR over the forecast period (2026-2031).
Which region has the biggest share in Low VOC Adhesive Market?
In 2025, the Asia Pacific accounts for the largest market share in Low VOC Adhesive Market.
What years does this Low VOC Adhesive Market cover?
The report covers the Low VOC Adhesive Market historical market size for years: 2019, 2020, 2021, 2022, 2023, 2024 and 2025. The report also forecasts the Low VOC Adhesive Market size for years: 2026, 2027, 2028, 2029, 2030 and 2031.
Page last updated on:


 Your data is secure and never sold or shared.


