
Local Anesthesia Drugs Market Size and Share
Market Overview
| Study Period | 2020 - 2031 |
|---|---|
| Market Size (2026) | USD 5.44 Billion |
| Market Size (2031) | USD 6.43 Billion |
| Growth Rate (2026 - 2031) | 3.41 % |
| Fastest Growing Market | Asia-Pacific |
| Largest Market | North America |
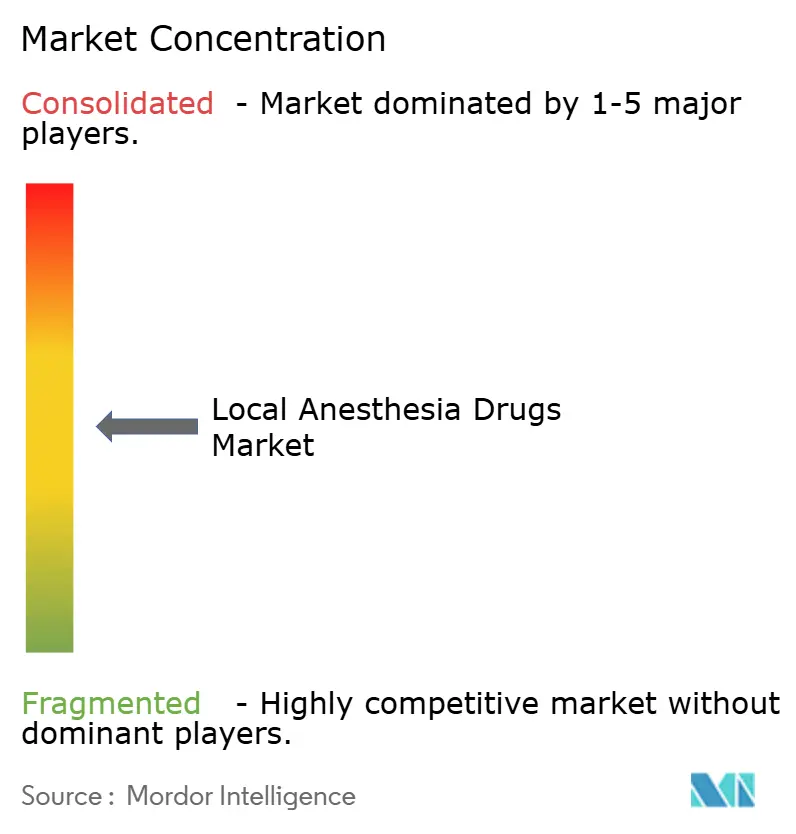
| Market Concentration | Medium |
Major Players *Disclaimer: Major Players sorted in no particular order Image © Mordor Intelligence. Reuse requires attribution under CC BY 4.0. | |
Local Anesthesia Drugs Market Analysis by Mordor Intelligence
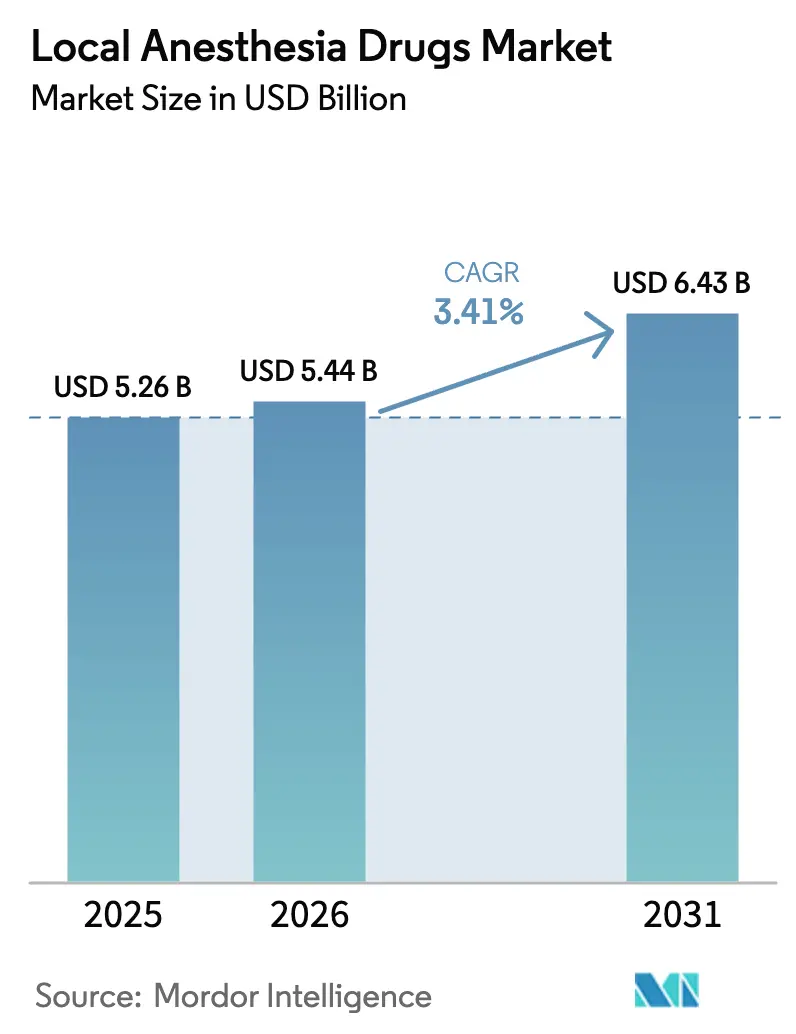
The local anesthesia drugs market size was valued at USD 5.26 billion in 2025 and is estimated to grow from USD 5.44 billion in 2026 to reach USD 6.43 billion by 2031, at a CAGR of 3.41% during the forecast period (2026-2031). Uptake is reinforced by reimbursement reforms that reward non-opioid analgesia, ultrasound-guided regional blocks that optimize per-procedure dosing, and long-acting liposomal platforms that condense multi-dose courses into a single injection. Separate payment pathways for non-opioid pain control under the 2025 NOPAIN Act have tipped formularies toward local options, while a steady stream of polymer-based launches provides competitive alternatives to opioids in same-day settings. Injectable formats remain dominant; however, topical creams and patches, driven by home-health adoption, are expanding faster than the overall market. Clinician preference for ropivacaine in obstetric and pediatric nerve blocks, combined with hospital dual-sourcing strategies that hedge against sterile injectable shortages, is reshaping supplier dynamics. Generic approvals of complex liposomal bupivacaine and ready-to-use ropivacaine have added price pressure but also validated extended-release technologies, encouraging broader formulary coverage.
Key Report Takeaways
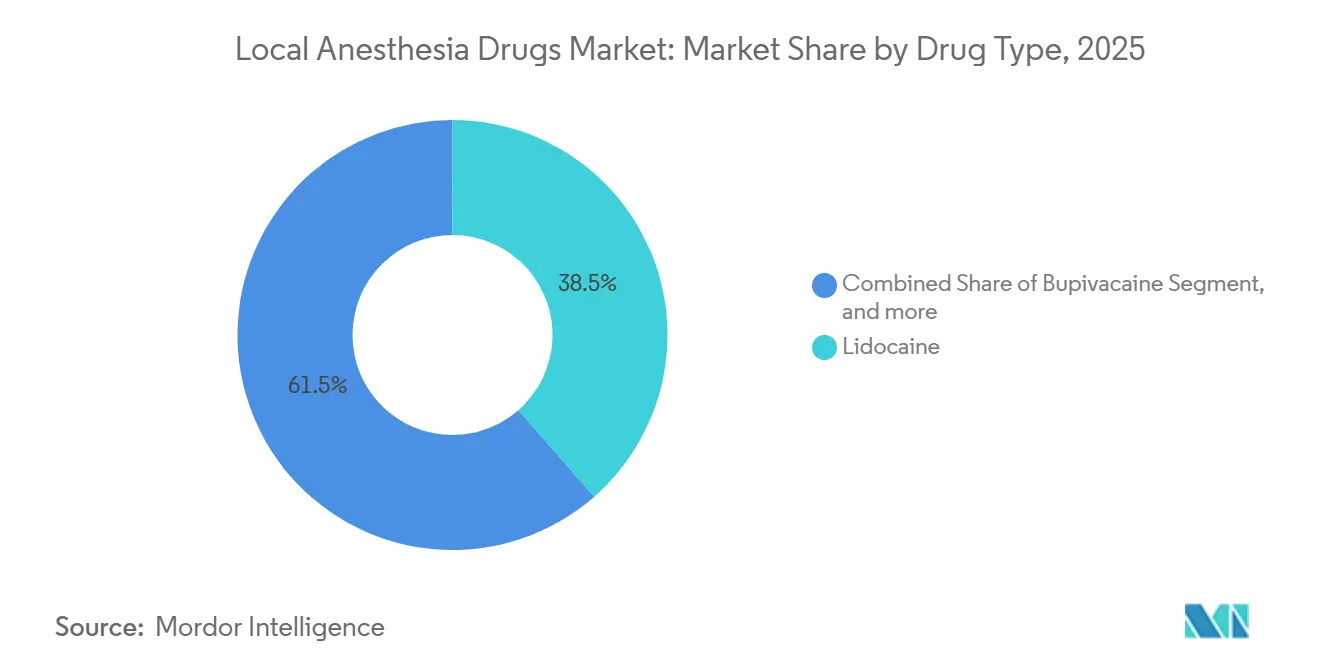
- By drug type, lidocaine commanded 38.54% of 2025 revenue, whereas ropivacaine is forecast to post a 5.67% CAGR to 2031, the highest within the class.
- By mode of administration, injectables held 71.43% local anesthesia drugs market share in 2025, while surface anesthetics are set to expand at a 5.87% CAGR through 2031.
- By application, surgical anesthesia contributed 55.67% of the 2025 revenue, but dental anesthesia is projected to grow the fastest, at 6.87% CAGR through 2031.
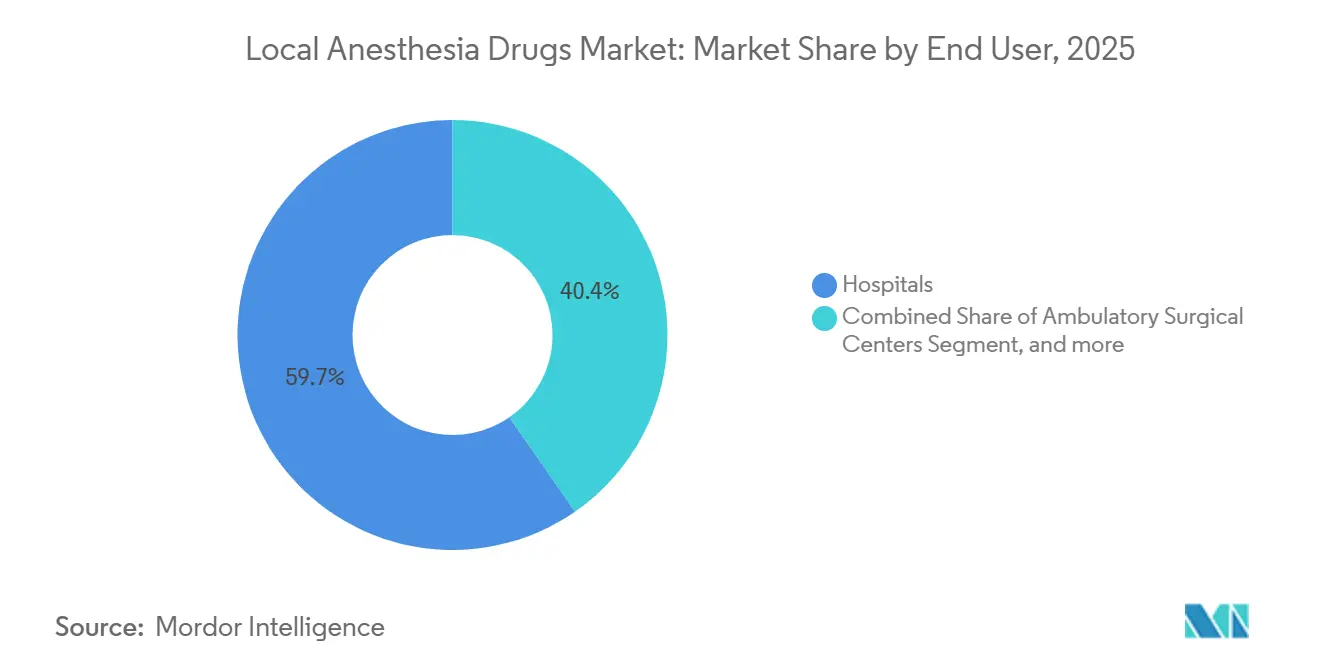
- By end user, hospitals generated 59.65% of the 2025 demand; however, ambulatory surgical centers are expected to rise at a 6.32% CAGR across the forecast period.
- By distribution channel, direct institutional tenders accounted for 58.54% of sales in 2025, while online pharmacies are projected to achieve a 6.54% CAGR from 2026 to 2031.
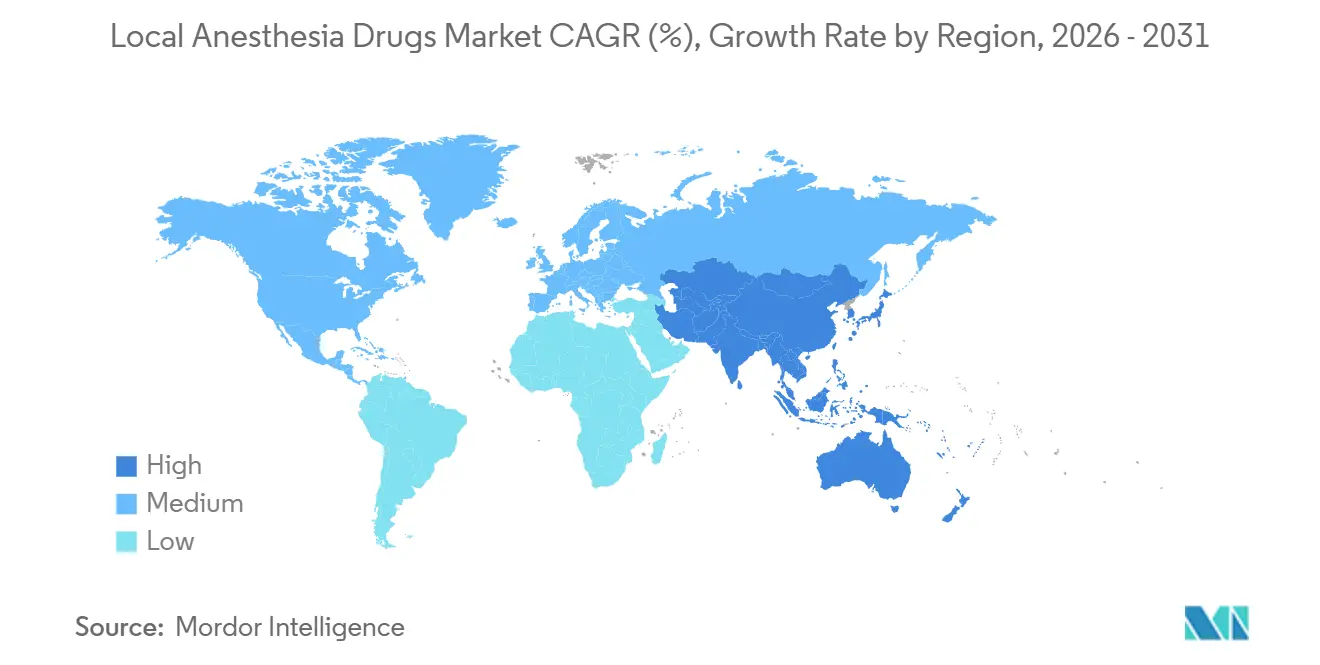
- By geography, North America accounted for 42.56% of sales in 2025, while the Asia-Pacific region is projected to achieve a 4.56% CAGR from 2026 to 2031.
Note: Market size and forecast figures in this report are generated using Mordor Intelligence’s proprietary estimation framework, updated with the latest available data and insights as of January 2026.
Market Trends and Insights
Drivers Impact Analysis of Local Anesthesia Drugs Market*
| Driver | (~) % Impact on CAGR Forecast | Geographic Relevance | Impact Timeline |
|---|---|---|---|
| Rising surgical procedure volume globally | +0.9% | Global, led by North America, Europe, Asia-Pacific | Medium term (2-4 years) |
| Increasing approvals of novel formulations | +0.7% | North America and Europe with Asia-Pacific spillover | Short term (≤ 2 years) |
| Adoption in ambulatory and day-care surgery | +0.8% | North America, Europe, urban Asia-Pacific | Medium term (2-4 years) |
| Ultrasound-guided regional blocks | +0.6% | North America, Europe, select Asia-Pacific centers | Long term (≥ 4 years) |
| Long-acting liposomal and polymer matrices | +0.5% | North America, Western Europe | Long term (≥ 4 years) |
| Expanding dental tourism | +0.3% | Asia-Pacific, Latin America, Middle East | Medium term (2-4 years) |
| Source: Mordor Intelligence | |||


Rising Surgical Procedure Volume Globally
Elective backlogs in OECD economies are expected to be cleared by late 2025, and hip and knee replacements continue climbing at 4-5% per year, both heavy users of peripheral nerve blocks that drive local anesthesia drug market growth[1]Organisation for Economic Co-operation and Development, “Health at a Glance 2024,” oecd.org. China’s hospital-bed target of 7.5 per 1,000 population by 2025 and India’s Ayushman Bharat upgrades are lifting amide anesthetic consumption for infiltration and neuraxial techniques. Medicare beneficiaries underwent 222.1 ASC procedures per 1,000 enrollees in 2023, underscoring the shift of intermediate cases to venues that rely on regional blocks. Enhanced Recovery After Surgery protocols from the World Bank standardize single-shot blocks in colorectal and orthopedic cases, cementing predictable drug demand. Collectively, these volume gains contribute a measurable uplift to the CAGR of the local anesthesia drugs market.
Increasing Approvals and Launches of Novel Local Anesthetics
The 2024 U.S. approval of ZYNRELEF, a bupivacaine–meloxicam polymer, delivers 72-hour pain control and directly competes with opioid tablets[2]U.S. Food and Drug Administration, “NDA Approval Letter for ZYNRELEF,” fda.gov. Jiangsu Hengrui received a green light for its generic liposomal bupivacaine in July 2024, erasing a single-supplier bottleneck and validating biosimilar pathways for complex injectables. Baxter’s ready-to-use ropivacaine eliminates the need for on-site compounding, a proposition valued by hospitals facing contamination alerts. Pacira BioSciences responded with new process patents for EXPAREL in December 2024, extending exclusivity and prompting rivals to seek alternative carriers. Accelerated pipelines shorten adoption lags, lifting product refresh rates across the local anesthesia drugs market.
Growing Adoption in Ambulatory & Day-Care Surgeries
Payment parity under the 2025 NOPAIN Act removes financial penalties for non-opioid analgesics in ASCs and hospital outpatient departments, increasing formulary ordering of long-acting local anesthetics. MedPAC data show that ASC rates rose faster than outpatient department rates in 2024, incentivizing the migration of orthopedic and ophthalmology procedures that favor nerve blocks over general anesthesia. Updated ASA guidelines recommend rapid-onset chloroprocaine for cesarean delivery in low-resource facilities, expanding rural demand. Dental service organizations leverage volume contracts for articaine and lidocaine cartridges, standardizing usage patterns in over 15% of U.S. practices. Together, these shifts deepen penetration of the local anesthesia drugs market in same-day care.
Shift Toward Ultrasound-Guided Regional Anesthesia
Visualization reduces the risk of systemic toxicity and improves block success, encouraging investments in portable ultrasound systems and training. ASRA’s practice advisory mandates lipid-emulsion rescue kits, which raises hospital preparedness costs but reassures clinicians. Ropivacaine-based transversus abdominis plane blocks lower postoperative opioid use by up to 40%, aligning with federal opioid-reduction targets. B. Braun’s USD 1 billion North American expansion underscores confidence in growing demand for needles and catheters. Although lower volumes per block trim per-case usage, the higher number of procedures lifts aggregate volumes across the local anesthesia drugs market.
Restraints Impact Analysis of Local Anesthesia Drugs Market*
| Restraint | (~) % Impact on CAGR Forecast | Geographic Relevance | Impact Timeline |
|---|---|---|---|
| Systemic toxicity and adverse events | -0.4% | Global, higher in low-resource centers | Short term (≤ 2 years) |
| Stringent regulatory requirements for new molecules | -0.3% | North America, Europe | Long term (≥ 4 years) |
| Supply shortages of key active pharmaceutical ingredients | -0.5% | Global, acute in North America | Short term (≤ 2 years) |
| Rising use of non-pharmacological analgesia | -0.2% | North America, Europe, urban Asia-Pac | Medium term (2-4 years) |
| Source: Mordor Intelligence | |||
Systemic Toxicity and Adverse Events Associated with Amide Anesthetics
Local anesthetic systemic toxicity, though rare, carries high mortality without immediate lipid-emulsion rescue, obligating each operating suite to stock 20% Intralipid and train staff, adding direct costs. FDA labeling emphasizes incremental dosing and maximum limits, yet case reports continue, often linked to inadvertent intravascular injections. Benzocaine spray warnings about methemoglobinemia have pushed ENT specialists toward lidocaine viscous alternatives, reshuffling topical shares. Ropivacaine offers a safer cardiac profile but costs 20-30% more than bupivacaine, limiting access in price-sensitive regions. Portable ultrasound can reduce the incidence of toxicity. Yet, units cost USD 10,000–30,000 and require training, creating a hurdle for smaller ambulatory centers that would otherwise expand the local anesthesia drugs market.
Stringent Regulatory Requirements for New Anesthetic Molecules
Bringing a novel agent to market requires non-inferiority trials versus entrenched comparators, multi-ethnic pharmacokinetics, and long-term safety surveillance, which can consume up to 12 years and nearly USD 1 billion in R&D. The EMA demands separate release-kinetic assessments for combination products, thereby prolonging approvals. Liposomal generics must replicate release curves without infringing process patents, a technical barrier that delayed Hengrui’s bupivacaine approval despite demonstrated equivalence. Manufacturing quality lapses trigger FDA warning letters and temporary shutdowns, as seen in sterile injectable plants in 2024, discouraging smaller entrants and slowing innovation within the local anesthesia drugs market.
*Our forecasts treat driver/restraint impacts as directional, not additive. The impact forecasts reflect baseline growth, mix effects, and variable interactions.
Local Anesthesia Drugs Market Segment Analysis
By Drug Type:
Ropivacaine Gains on Safety ProfileIn 2025, lidocaine accounted for 38.54% of revenue, maintaining its position in rapid-onset dental and minor surgical blocks. Ropivacaine is forecast to expand at 5.67% annually, the fastest among its peers, as obstetric and pediatric units prioritize its lower cardiotoxicity[3]American College of Obstetricians and Gynecologists, “Practice Bulletin 209 Update,” acog.org. Bupivacaine, though still favored for lengthy spine and joint procedures, faces usage caps in settings without advanced resuscitation capabilities. Benzocaine’s decline follows FDA methemoglobinemia warnings, steering demand toward safer amide alternatives.
Liposome-encapsulated bupivacaine straddles categories by delivering 72-hour coverage, attracting centers seeking opioid-free discharges. Chloroprocaine’s rapid offset makes it ideal for cesarean spinal blocks, as per ASA’s 2024 guidance, thereby widening its rural penetration. These shifts diversify the local anesthesia drugs market, with safety and duration rather than cost becoming decisive purchasing criteria.


By Mode of Administration:
Surface Anesthetics Ride Home-Health WaveInjectables accounted for 71.43% of 2025 revenue, as surgery, obstetrics, and dentistry rely on precise dosing. Surface formats are projected to grow at a rate of 5.87% to 2031, driven by the increasing adoption of lidocaine patches for neuralgia among the elderly and dermatology’s preference for EMLA cream during minimally invasive aesthetic procedures. Over-the-counter sales of ≤4% lidocaine products expand retail access, while prescription-strength patches remain reimbursable in many markets, thereby increasing volumes.
Ready-to-use ropivacaine injectables mitigate compounding risks, justifying premium prices in hospitals that have battled contamination alerts. Topicals maintain a more diverse supplier base, insulating the channel from the shortages plaguing sterile injectables. This resilience supports consistent expansion of the local anesthesia drugs market size within consumer and outpatient settings.
By Application:
Dental Anesthesia Accelerates on DSO ConsolidationSurgical anesthesia accounted for 55.67% of 2025 revenue, yet dental applications are poised for a 6.87% CAGR, the fastest growth rate across categories. Group purchasing by dental service organizations secures discounts on articaine cartridges, raising throughput in consolidated clinics. Cross-border dental tourism funnels foreign patients to ASEAN and Latin American hubs, where demand for lidocaine and articaine is bundled into procedural packages.
Post-operative pain control is shifting to single-shot liposomal injections that extend relief beyond discharge, cutting opioid tablets and nursing callbacks. Obstetric neuraxial blocks remain entrenched, with over 60% of U.S. singleton births using epidural or spinal anesthesia, sustaining bupivacaine and ropivacaine volumes. Broad application diversity stabilizes revenue streams across the local anesthesia drugs market.
By End User:
ASCs Gain on Payment ParityHospitals captured 59.65% of the 2025 demand as primary sites for complex interventions and trauma care. Ambulatory surgical centers are expected to post a 6.32% CAGR, buoyed by NOPAIN Act parity and surgeon preference for efficient workflows. Specialty pain clinics and dermatology offices are expanding their use of injections for musculoskeletal pain and cosmetic procedures, thereby diversifying their end-user revenue.
Dental clinics benefit from higher elective-procedure volumes and DSO-driven cartridge standardization. Home-health services represent an emerging niche where caregivers apply topical anesthetics for wound care and cannulation, enlarging the addressable population. Together, these channels reinforce stability and growth across the local anesthesia drugs market.
By Distribution Channel:
Online Pharmacies Exploit E-PrescribingDirect institutional tenders commanded 58.54% of 2025 sales, leveraging volume contracts and supply guarantees. Online pharmacies are forecast to grow at 6.54%, assisted by e-prescribing rules for non-controlled anesthetics and consumer preference for home delivery. Retail chains face reimbursement squeezes and rising mail-order competition, which is accelerating their shift to online operations.
Group purchasing organizations aggregate demand across multiple hospital systems, intensifying price negotiations and favoring suppliers with broad portfolios and just-in-time delivery options. Online platforms dynamically source from multiple wholesalers, which can cushion shortages but also challenge brand loyalty. This evolving mix distributes risk and opportunity across the local anesthesia drugs market.
Geography Analysis
North America Local Anesthesia Drugs Market
North America generated 42.56% of 2025 revenue, propelled by the highest surgical incidence worldwide, early adoption of liposomal bupivacaine and polymer combinations, and reimbursement structures that reward non-opioid analgesia. The GAO confirmed that 71 of 102 active U.S. shortages involve sterile injectables, leading hospitals to dual-source lidocaine and bupivacaine, sometimes at premium prices. Canada’s publicly funded system supports broad access, while Mexico’s medical tourism corridor boosts private-sector demand.
APAC Local Anesthesia Drugs Market
The Asia-Pacific region is projected to achieve a 4.56% CAGR from 2026 to 2031, driven by the expansion of hospital beds in China and India, as well as government support for rural surgery. China’s 7.5-beds-per-1,000 target elevates procedural throughput, directly increasing amide anesthetic consumption. India’s Ayushman Bharat upgrades secure operating rooms equipped for regional blocks, lowering dependency on anesthesiologists and broadening patient reach.
EMEA and LATAM Local Anesthesia Drugs Market
Europe offers stable, low-growth prospects due to rigorous EMA reviews and tender-driven pricing. The United Kingdom’s NRFit connector mandate accelerates product refreshes and favors suppliers certified to ISO standards. Urban centers in the Middle East and Africa are adopting ultrasound-guided techniques, while Latin America is leveraging dental tourism and expanding middle-class spending. Currency swings in South America, however, translate into revenue-recognition volatility for global manufacturers active in the local anesthesia drugs market.

Regulatory Landscape
Local anesthesia drugs are regulated as prescription pharmaceuticals in major markets, with manufacturing and quality governed by current good manufacturing practice requirements. In the United States, FDA oversight for finished pharmaceuticals is anchored in 21 CFR Parts 210 and 211, and approved local anesthetic products and therapeutic equivalence are tracked through the FDA Orange Book, updated monthly and used to support generic substitution and monitor exclusivity.
In Europe, manufacturing expectations follow EU GMP in EudraLex Volume 4. Local anesthetic actives and combinations, such as lidocaine-prilocaine, including dental formulations such as Septanest, have been subject to EMA referral and pharmacovigilance harmonization activities that can drive label alignment and risk-minimization measures across member states. A compliance inflection point cited in EU GMP materials is the transition in how EudraLex Volume 4 guidance applies through mid-2026, which shifts attention toward keeping quality systems current for firms supplying multiple regions.
Value Chain Analysis
The value chain starts with active pharmaceutical ingredient (API) synthesis for amide and ester anesthetics, then moves into formulation for sterile injectables (vials, ampoules, prefilled syringes), dental cartridges, and topical formats (creams, gels, patches). API and drug product stages are constrained by GMP, impurity controls, and sterile manufacturing requirements. This structure raises the barrier for new entrants, particularly for long-acting or complex delivery systems where release kinetics and process controls must be replicated closely.
Finished products are sold through direct institutional tenders and group purchasing, hospital wholesalers, and retail and online pharmacy channels for topical and outpatient use. Supply is supported by specialized cartridge and injectable manufacturers with multinational footprints, such as Septodont (injectable dental anesthetic capacity and manufacturing presence across France, Canada, and Brazil) and Inibsa (large-scale dental cartridge production in Spain serving international distribution). This setup shapes sourcing and contracting decisions around sterile supply reliability, serialization/traceability readiness, and ongoing multi-country regulatory maintenance.
Competitive Landscape
The local anesthesia drugs market is moderately fragmented. Pacira BioSciences leads the premium segment, with EXPAREL surpassing USD 500 million in sales in 2024 and fresh patents that extend exclusivity. FDA approval of Hengrui’s generic liposomal bupivacaine breaks Pacira’s monopoly, slicing institutional prices and prompting polymer-based alternatives. Hikma’s USD 135 million acquisition of Xellia’s U.S. injectables portfolio widens capacity, positioning the firm to capture share during supply disruptions.
B. Braun’s billion-dollar North American build-out guarantees domestic syringe and catheter output, appealing to hospitals that prioritize secure supply chains. Regional players, such as Cristália, Tonghua Dongbao, and Septodont, exploit local networks to offer cost-competitive amide generics, further fragmenting market share. ASHP-documented shortages elevate the strategic value of redundancy, leading pharmacy directors to award contracts based on reliability as well as price.
Local Anesthesia Drugs Industry Leaders
Fresenius SE & Co. KGaA
Pacira Pharmaceuticals, Inc.
Pfizer Inc.
Septodont
Baxter International Inc.
- *Disclaimer: Major Players sorted in no particular order
Local Anesthesia Drugs Market Companies Covered in this Report
- Abbvie
- Aspen Pharmacare
- B. Braun
- Baxter
- Cristália
- Endo International
- Fresenius
- Glenmark Pharmaceuticals
- Hikma Pharmaceuticals
- Mylan
- Pacira BioSciences Inc.
- Pfizer
- Piramal Critical Care
- Septodont
- Sichuan Kelun Pharmaceutical Co. Ltd.
- Sun Pharmaceuticals Industries
- Teva Pharmaceutical Industries
- Tonghua Dongbao Pharmaceutical Co. Ltd.
- Zydus Lifesciences Ltd.

Market Opportunities and Future Outlook
The clearest product-development whitespace is prolonged-duration local anesthesia that aligns with outpatient and ambulatory pathways while meeting safety expectations around systemic toxicity. In May 2026, the US FDA issued draft guidance on the development of local anesthetic drug products with prolonged duration of effect, which creates a more defined development and evidentiary pathway and can help standardize endpoints, comparators, and quality expectations for extended-release and depot platforms.
Manufacturers also have an opportunity in supply quality and continuity, where resilient sterile capacity and strong pharmacovigilance matter. This is reflected in disruption events such as the July 2026 suspension of use of a specific bupivacaine in dextrose injection batch in Rajasthan after reported serious adverse reactions. In topical anesthetics, the segment offers growth potential alongside compliance friction, with policy actions like Oregon licensing guidance in March 2026 restricting topical anesthetic administration by tattoo artists underscoring the need for clearer labeling and channel governance. These rules also steer demand toward supervised clinical settings and compliant retail and online dispensing models.
Recent Industry Developments in Local Anesthesia Drugs Market
- July 2026: Pacira BioSciences reported that UnitedHealthcare implemented separate reimbursement for EXPAREL. The payer pathway supports simpler billing mechanics for long-acting local anesthetic options in outpatient procedures, reinforcing access alongside clinical differentiation.
- November 2025: Pacira BioSciences entered an exclusive license agreement with AmacaThera to develop AMT-143, a long-acting ropivacaine formulation for postsurgical pain control. The deal signals continued competitive investment in extended-duration platforms beyond liposomal bupivacaine, with development aimed at improving discharge-ready analgesia.
- July 2024: Jiangsu Hengrui received approval for a generic liposomal bupivacaine. The approval validated regulatory feasibility for complex, extended-release local anesthetic generics and increased competitive pressure on premium long-acting incumbents in institutional channels.


Local Anesthesia Drugs Market Report Scope and Research Methodology
Market Definition and Coverage
For this study, the local anesthesia drugs market covers prescription and nonprescription drug products that provide temporary, localized loss of sensation for procedures and pain control, counted in value terms across major care settings and channels.
Scope exclusions: We exclude general anesthesia drugs and sedation agents, and we also exclude devices and consumables such as needles, syringes, and catheters.
Segments Covered in This Report
- By Drug Type
- Bupivacaine
- Lidocaine
- Benzocaine
- Ropivacaine
- Prilocaine
- Chloroprocaine
- Other Drug Types
- By Mode of Administration
- Injectable
- Surface Anesthetic
- By Application
- Surgical Anesthesia
- Post-Operative Pain Management
- Dental Anesthesia
- Labor & Delivery Analgesia
- Chronic Pain Management
- By End User
- Hospitals
- Ambulatory Surgical Centers
- Specialty Clinics
- Dental Clinics
- Home Healthcare Settings
- By Distribution Channel
- Institutional (Direct/Tender) Sales
- Retail Pharmacies
- Online Pharmacies
- Geography
- North America
- United States
- Canada
- Mexico
- Europe
- Germany
- United Kingdom
- France
- Italy
- Spain
- Rest Of Europe
- Asia-Pacific
- China
- Japan
- India
- Australia
- South Korea
- Rest Of Asia-Pacific
- Middle East And Africa
- GCC
- South Africa
- Rest Of Middle East And Africa
- South America
- Brazil
- Argentina
- Rest Of South America
- North America
Data Sources, Market Sizing, and Validation
Desk Research
Desk research was used to set a clean fact base for volumes, procedure mix, and regulatory context, before modeling assumptions were locked. We referenced public sources such as the US FDA drug databases and approvals, CDC and National Center for Health Statistics procedure and setting indicators, WHO health statistics, and OECD health data for surgery and dental care proxies.
To translate those signals into market inputs, we also reviewed company annual reports and investor presentations, published clinical guidelines and peer reviewed journals on local anesthetic use patterns, and reputable press for launches and supply changes. Where helpful, we used paid database subscriptions for company financials and intelligence, news and financials screening, and patent databases to check formulation and delivery innovation. These examples are not exhaustive, and other public and paid sources were also reviewed for data collection, validation, and clarification.
Primary Interviews and Surveys
Primary work focused on validating demand drivers and pricing logic that are hard to infer from public data alone, especially across hospital, ambulatory surgery, dental, and specialty clinic settings. We spoke with a mix of manufacturers, distributors, pharmacists, and clinicians across APAC, EMEA, and the Americas to pressure test usage per procedure, switching trends between agents, and route preferences (injectable versus surface anesthetic).
Distribution of primary research fieldwork respondents
| Company type | Respondent position | Region |
|---|---|---|
| Top tier: 28% | CXOs: 12% | APAC: 44% |
| Mid tier: 53% | Functional/Unit leaders: 30% | EMEA: 29% |
| Smaller Players: 19% | Managers: 58% | Americas: 27% |
Market-Sizing & Forecasting
Sizing starts from a top-down build where procedure volumes and care setting splits are reconstructed by region, and then converted into drug demand using typical dose and utilization patterns for local anesthesia. Once that demand pool is established, we corroborate results with selective bottom-up approximations, including sampled price points by route of administration, channel markups, and supplier revenue splits available from public disclosures and interview checks.
Key inputs used in the model include the mix of injectable versus surface anesthetic usage, procedure growth in dental and ambulatory settings, adoption of longer-acting formulations for post-operative pain pathways, tender and formulary access effects by country, and inflation-driven ASP movement by molecule class. When a country level variable is missing, we filled the gap using closest peer markets with similar procedure intensity and reimbursement structure, and then rechecked the output with expert feedback.
For forecasting, we relied on scenario analysis supported by simple time-series smoothing on the most stable indicators, and then adjusted the curve using primary feedback on expected procedure normalization, pricing pressure, and uptake of newer delivery formats. This keeps the forecast explainable while still being sensitive to real changes in utilization and access.
Data Validation & Update Cycle
Outputs were checked against independent signals such as procedure trend direction, trade and supply continuity signals, and whether implied per-procedure drug spend looked reasonable by setting. Variances were reviewed in steps, first at the country level and then rolled up to region and global totals, and a second analyst review was completed before sign-off.
When an outlier was found, interviews were revisited and the input assumption was either tightened or replaced with a better supported proxy. Reports are refreshed annually, and interim updates are made when material events occur, such as policy changes, shortages, or major label expansions. Before delivery, a final pass is done so the numbers reflect the latest available information.
Mordor Intelligence's Local Anesthesia Drugs Market Size Versus Other Published Estimates
Published numbers for local anesthesia drugs often do not match, even when the topic name looks the same, because the scope and pricing logic can shift across studies. Differences usually come from what gets counted as a local anesthetic, how routes and channels are valued, and whether procedure-led demand signals are used to anchor the starting year.
A common gap driver is whether the market is limited to local anesthesia agents or expanded to include adjacent perioperative pain medicines. Mordor Intelligence treats the scope as local anesthetic drugs only, and then sizes demand by procedure use and route mix (injectable versus surface anesthetic) before applying region-specific price progression.
Benchmark comparison
| Source | Market Size | Gaps in Research Methodology |
|---|---|---|
| Mordor Intelligence | USD 5.44 B (2026) | |
| Industry Research Publisher A | USD 4.14 B (2024) | Uses an earlier base year and may apply different pricing and channel valuation assumptions, which can lower the value when recent price progression and route mix shifts are not fully reflected. |
| Global Research Publisher B | USD 4.95 B (2026) | Defines market value using a factory gate revenue view and excludes resale value through the supply chain, which can compress totals versus studies that reflect downstream channel pricing. |
The spread in the table is mainly explained by timing and what part of the channel price is captured, not by disagreement that local anesthetic use is growing. By keeping inputs tied to procedure demand, route split, and clear channel valuation steps, the estimate stays traceable and can be repeated when new volume or pricing signals emerge.


Key Questions Answered in the Report
What is the projected value of the local anesthesia drugs market in 2031?
The local anesthesia drugs market is forecast to reach USD 6.43 billion by 2031.
Which drug type is expected to grow the fastest through 2031?
Ropivacaine is projected to expand at a 5.67% CAGR, the quickest among major agents.
How will ambulatory surgical centers influence demand?
Payment parity under the NOPAIN Act supports a 6.32% CAGR in ASC purchases, lifting overall market volumes.
Why are surface anesthetics gaining popularity?
Expanded home-health use of lidocaine patches and OTC creams drives a 5.87% CAGR for surface formats.
Which region offers the strongest growth outlook?
Asia-Pacific is set for a 4.56% CAGR, supported by hospital-bed expansion and rising medical tourism.
How are supply shortages affecting hospital procurement?
Facilities now dual-source injectables and value suppliers with domestic capacity, raising resilience but also acquisition costs.
Page last updated on:


 Your data is secure and never sold or shared.


