Market Overview
| Study Period | 2021 - 2031 |
|---|---|
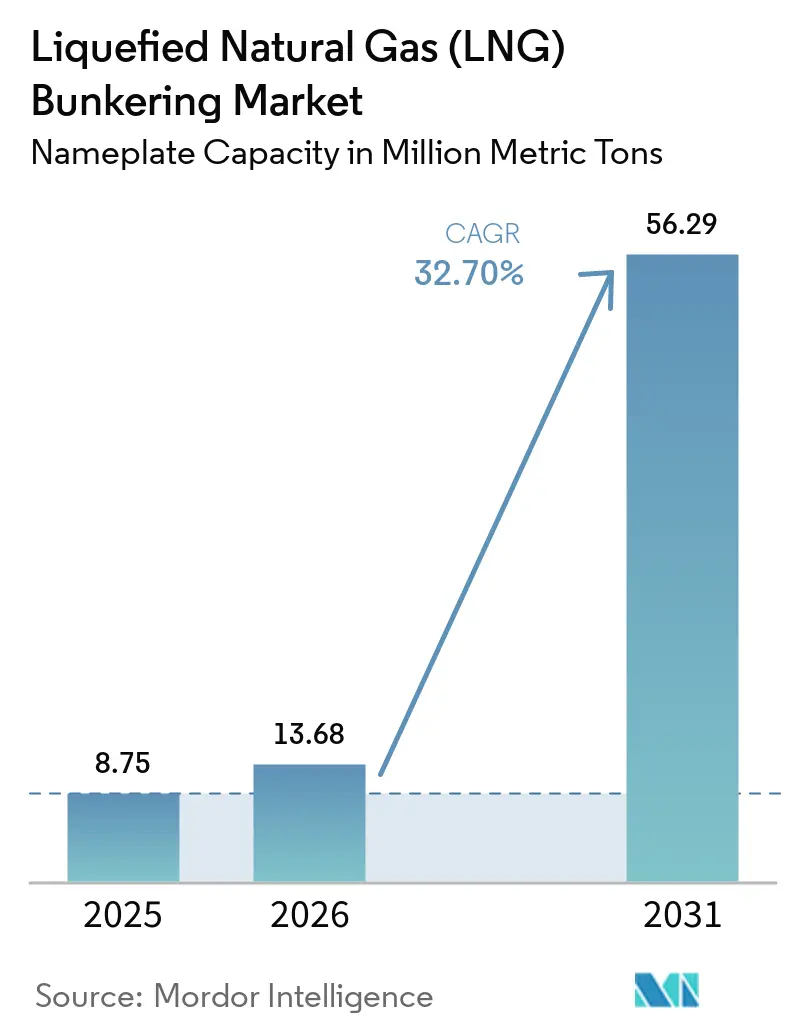
| Market Volume (2026) | 13.68 Million metric tons |
| Market Volume (2031) | 56.29 Million metric tons |
| Growth Rate (2026 - 2031) | 32.70% CAGR |
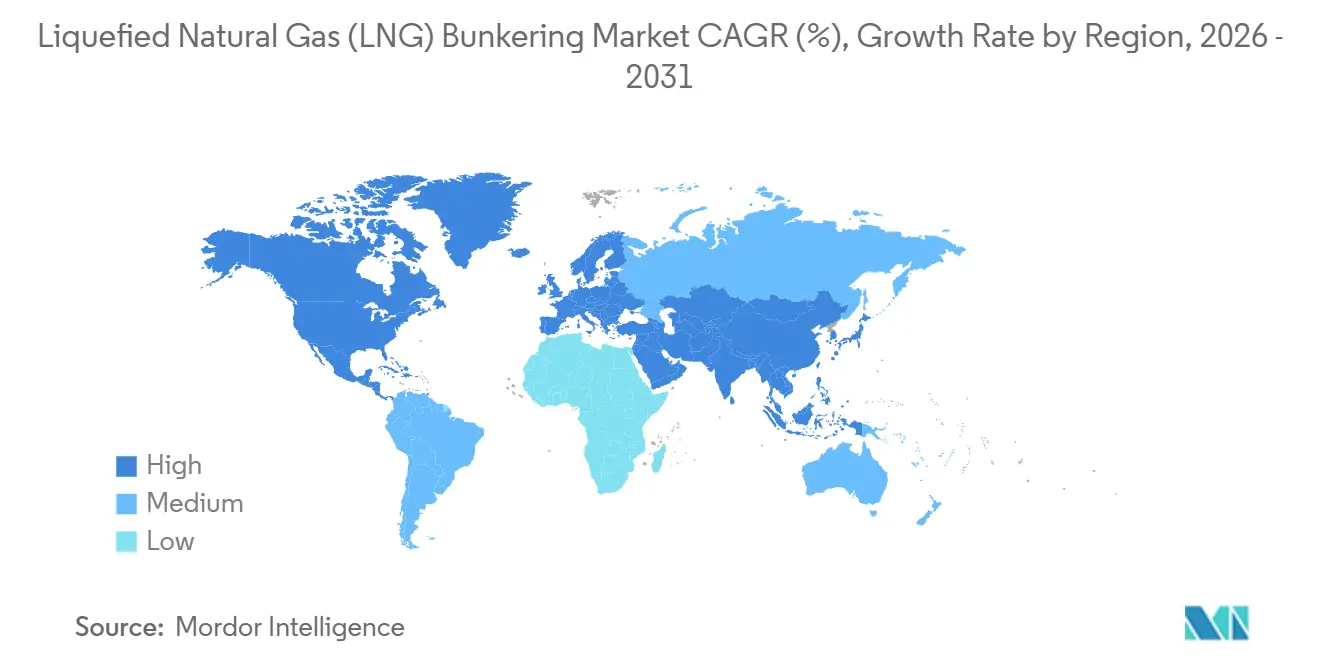
| Fastest Growing Market | Asia Pacific |
| Largest Market | Europe |
| Market Concentration | Medium |
Major Players *Disclaimer: Major Players sorted in no particular order Image © Mordor Intelligence. Reuse requires attribution under CC BY 4.0. | |
Liquefied Natural Gas (LNG) Bunkering Market Analysis by Mordor Intelligence
The Liquefied Natural Gas Bunkering Market size in terms of nameplate capacity is projected to be 8.75 million metric tons in 2025, 13.68 million metric tons in 2026, and reach 56.29 million metric tons by 2031, growing at a CAGR of 32.70% from 2026 to 2031. Continuing adoption is anchored in the International Maritime Organization’s 0.5% sulfur limit, which steered owners toward LNG as the most economical compliance pathway for newbuilds. Rapid fleet renewal, stronger price hedging mechanisms offered by integrated energy majors, and expanding hub-port infrastructure are reinforcing demand. Competitive behavior has shifted as upstream LNG suppliers extend bundled fuel-and-infrastructure deals, while regulatory pressure now includes carbon-intensity targets that favor low-carbon fuels over high-sulfur fuel oil. High capital requirements for bunkering vessels and shore tanks still curb geographic diversification, yet technological advances that cut methane slip and blend bio-LNG are widening LNG’s environmental headroom.
Key Report Takeaways
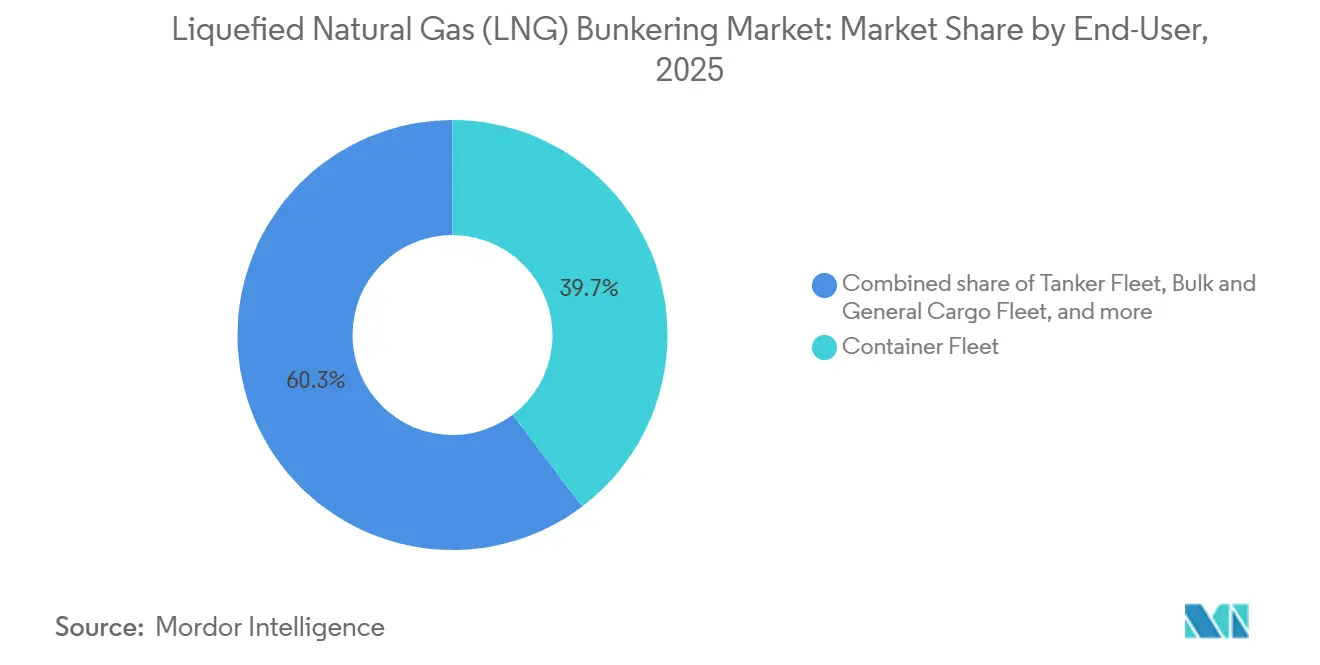
- By end user, container fleet operations led with 39.7% of LNG bunkering market share in 2025 and are forecast to expand at a 35.8% CAGR through 2031.
- By geography, Europe captured a 72.4% share of the LNG bunkering market size in 2025, while Asia-Pacific is projected to record the fastest regional growth at 40.5% CAGR through 2031.
Note: Market size and forecast figures in this report are generated using Mordor Intelligence’s proprietary estimation framework, updated with the latest available data and insights as of January 2026.
Global Liquefied Natural Gas (LNG) Bunkering Market Trends and Insights
Drivers Impact Analysis*
| Driver | (~) % Impact on CAGR Forecast | Geographic Relevance | Impact Timeline |
|---|---|---|---|
| IMO 2020 sulfur-cap compliance push | 8.2% | Global, with peak enforcement in EU, North America, Singapore | Short term (≤ 2 years) |
| Rapid growth in LNG-powered vessel order book | 9.5% | Global, concentrated in Asia-Pacific shipyards and European liner operators | Medium term (2-4 years) |
| Expansion of global LNG bunkering infrastructure | 7.8% | Europe (Rotterdam, Antwerp), Asia-Pacific (Singapore, Zhoushan), North America (US Gulf) | Medium term (2-4 years) |
| Cost competitiveness of LNG versus low-sulfur fuel oils | 4.6% | Asia-Pacific, Middle East, with spillover to South America | Short term (≤ 2 years) |
| Emergence of e-methane enabling carbon-neutral LNG supply | 3.2% | Europe (FuelEU Maritime compliance), North America, with pilot projects in Asia-Pacific | Long term (≥ 4 years) |
| Automation & digital-twin solutions improving bunkering safety | 2.1% | Global, with early adoption in Singapore, Rotterdam, and technologically advanced ports | Medium term (2-4 years) |
| Source: Mordor Intelligence | |||
IMO 2020 Sulphur-Cap Compliance Push
The 0.5% sulfur cap that entered into force in 2020 eliminated the cost advantage of high-sulfur fuel oil, leaving owners with scrubbers, very-low-sulfur fuel oil, or LNG. Scrubber retrofits stabilized near 5,000 vessels by 2024, while LNG retained a USD 150-250 per metric-ton price edge over VLSFO in major hub ports, tipping newbuild decisions toward dual-fuel engines.[1]International Maritime Organization, “IMO 2020 – Ensuring Compliance,” imo.org Intensified port-state inspections in Singapore and Rotterdam during 2025 raised the cost of non-compliance, accelerating fleet renewal toward LNG-capable tonnage.
Rapid Growth in LNG-Powered Vessel Orderbook
Classification-society data showed 535 LNG-powered ships in service and 509 on order as of April 2024, with container ships accounting for over half of capacity.[2]DNV, “Alternative Fuels Insight Platform,” dnv.com CMA CGM alone contracted 77 LNG-fueled vessels, taking delivery of 44 by mid-2025. The concentration of orders in large container units has created a virtuous loop of predictable fuel demand that underpins further infrastructure spending in hub ports.
Expansion of Global LNG Bunkering Infrastructure
Rotterdam’s Gate terminal completed a 50,000-cubic-meter expansion in 2024, doubling truck-loading throughput for North Sea and Baltic trades. Singapore commissioned a second bunkering terminal in late 2024, boosting simultaneous-bunkering capacity to 12 vessels. China’s Zhoushan terminal commenced operations in early 2025 with 30,000 cubic meters of storage to serve domestic coastal shipping. Despite these gains, a purpose-built bunkering vessel still costs USD 50-80 million, holding back investment in smaller ports.
Cost Competitiveness of LNG Versus Low-Sulphur Fuel Oils
In Singapore, LNG bunker fuel averaged USD 650 per metric ton in the first half of 2025 versus USD 800 for VLSFO, a 19% discount that outweighed LNG’s lower energy density. Long-term supply contracts indexed to oil benchmarks, such as a 10-year agreement between TotalEnergies and CMA CGM signed in 2024, dampen spot-price volatility for large liner operators.
Restraints Impact Analysis*
| Restraint | (~) % Impact on CAGR Forecast | Geographic Relevance | Impact Timeline |
|---|---|---|---|
| High CAPEX for bunkering vessels & shore tanks | -3.8% | South America, Africa, secondary Asian ports, emerging markets | Medium term (2-4 years) |
| Volatility of LNG spot prices | -2.2% | Asia-Pacific spot markets, Europe (TTF-linked pricing), with limited impact where long-term contracts dominate | Short term (≤ 2 years) |
| Methane-slip and life-cycle GHG concerns | -2.4% | Global, with heightened scrutiny in EU and North America under lifecycle assessment mandates | Long term (≥ 4 years) |
| Rising investment shift toward methanol & ammonia bunkering | -1.8% | Europe (Maersk-led methanol adoption), Asia-Pacific (ammonia R&D hubs), North America | Long term (≥ 4 years) |
| Source: Mordor Intelligence | |||
High CAPEX for Bunkering Vessels and Shore Tanks
A 7,500 cubic-meter bunkering vessel demands USD 60-75 million to build and up to USD 8 million annually for operations. Shore-tank investments exceed USD 120 million and involve 24-month permitting under ISO 20519 and the IGF Code, which delays projects in emerging markets.[3]International Organization for Standardization, “ISO 20519: LNG Fuel Supply Systems,” iso.org This cost hurdle forces operators on secondary routes to detour to major hubs or carry additional fuel, eroding LNG’s economic advantage.
Methane-Slip and Life-Cycle GHG Concerns
Well-to-wake studies found methane-slip rates of 2.5-3.5% in high-pressure dual-fuel engines, offsetting roughly one-third of LNG’s CO₂ benefit versus very-low-sulfur fuel oil.[4]International Council on Clean Transportation, “Updated Well-to-Wake Emissions Study,” theicct.org Engine makers introduced low-pressure models in 2025 that cut slip below 1%, yet retrofits cost USD 3-5 million per vessel, raising payback hurdles. The EU’s FuelEU Maritime regulation, effective 2025, penalizes methane slip in carbon-intensity calculations.
*Our forecasts treat driver/restraint impacts as directional, not additive. The impact forecasts reflect baseline growth, mix effects, and variable interactions.
Segment Analysis
By End User: Container Fleet Commands Volume and Growth
Container fleet operations accounted for 39.7% of the LNG bunkering market size in 2025 and are projected to grow at a 35.8% CAGR through 2031. CMA CGM’s fleet of 44 operational LNG-powered vessels and 33 additional units on order illustrates the scale commitment by mega-carriers. The ability to negotiate long-term supply contracts and secure priority berths in hub ports underpins adoption. Tanker fleet uptake remains below 2% of the newbuild pipeline because charterers resist freight premiums, and loading terminals in the Middle East and West Africa lack LNG infrastructure. Bulk and general cargo operators face similar obstacles, as cargo-hold space is sacrificed to fuel tanks, and freight markets remain fragmented.
The LNG bunkering market continues to depend on container traffic along Asia-Europe and trans-Pacific corridors, reinforcing infrastructure concentration in Singapore, Rotterdam, and the U.S. Gulf. Ferries and offshore-support vessels in Norway benefit from subsidies that offset 40% of conversion costs, while cruise lines deploy LNG to meet port-city air-quality mandates in the Mediterranean and Caribbean. Future growth hinges on whether IMO tightens 2030 and 2040 carbon-intensity goals enough to tip investment toward methanol or ammonia. Early evidence suggests container carriers will maintain LNG commitments because network volume allows hedging against fuel-price swings and amortizing capital costs across large fleets.


Geography Analysis
Europe captured 72.4% of the LNG bunkering market share in 2025, supported by early regulatory moves, dense short-sea networks, and the continent’s mature shore infrastructure. Rotterdam, Antwerp, and Scandinavian ports offered simultaneous bunkering for more than 40 vessels by mid-2025. Germany’s repurposed FSRU terminals at Brunsbüttel and Wilhelmshaven added LNG bunkering capability in 2024, serving Baltic and North Sea routes. Updated European Maritime Safety Agency guidelines harmonized safety protocols and simplified cross-border operations in 2024.
Asia-Pacific is forecast to grow at a 40.5% CAGR through 2031, propelled by Singapore’s second terminal, China’s Zhoushan expansion, and South Korea’s deployment of dedicated bunkering vessels. Singapore’s bunkering capacity rose to 12 simultaneous operations in 2024, supporting liner volumes through the Malacca Strait. In China, Zhoushan’s 30,000 cubic-meter shore tanks opened in early 2025, serving domestic coastal feeders and bulk trades. Japan and South Korea favor bunkering vessels over shore tanks to limit upfront capital, though this strategy caps throughput and may require additional assets as the fleet grows.
North America remains a niche, with the U.S. Gulf accounting for most regional volumes. Harvey Gulf operates two bunkering vessels serving offshore supply and container feeders, while West Coast and Canadian ports await clearer regulatory frameworks. South America and the Middle East & Africa contributed less than 3% of 2025 volumes. Petrobras paused expansion in Santos pending domestic gas-price reforms, and Panama lacks LNG storage, diverting bunkering demand to the U.S. Gulf. QatarEnergy’s Q-LNG ordered a bunkering vessel in 2025 for delivery in 2027 to serve Hamad Port, signaling future growth potential in the Middle East.

Competitive Landscape
The LNG bunkering market exhibits moderate concentration. Integrated energy majors (Shell, TotalEnergies, and ENGIE) control around 45% of global volumes through upstream LNG supply, long-term offtake, and co-investment in port infrastructure. Shell expanded operations to 15 ports by 2025 and offers pricing hedges that smaller players cannot match. TotalEnergies’ Brent-indexed 10-year supply contract with CMA CGM reduces exposure to gas-spot volatility and secures throughput for its chartered bunkering vessels.
Regional specialists are carving defensible niches. Gasum operates the Baltic’s only truck-to-ship network and added the 7,500 cubic-meter Coralius bunkering vessel in Gothenburg in 2025. Pavilion Energy collaborates with Singapore’s port authority, using truck-to-ship solutions to serve feeder and cruise traffic. Technology licensors such as GTT capture value through membrane containment systems deployed on 80% of LNG-powered container ships ordered in 2024-2025.
White-space opportunities remain in secondary ports. Crowley Maritime’s truck-to-ship service in Jacksonville, Florida, expanded to Port Everglades in 2025, targeting Caribbean container feeders and cruise vessels. Alternative fuels pose competitive threats: Maersk ordered 25 methanol-ready vessels, and MAN Energy Solutions introduced ammonia-compatible engines, prompting ports to design modular facilities that accommodate multiple fuel types.
Liquefied Natural Gas (LNG) Bunkering Industry Leaders
Shell PLC
TotalEnergies SE
Gasum Oy
Engie SA
Peninsula Petroleum
- *Disclaimer: Major Players sorted in no particular order

Recent Industry Developments
- January 2026: RMK Marine, a Turkish shipbuilder, commenced the steel-cutting ceremony for its latest vessel, the Celsius, designed for LNG and bio-LNG bunkering. In a related move, Gasum has secured a charter for this new bunker vessel, set to commence operations in 2027, bolstering its commitment to enhance the presence of LNG and bio-LNG in Northwestern Europe's maritime sector.
- January 2026: France's Gaztransport & Technigaz (GTT), a specialist in technological containment, has been entrusted by South Korea's Hanwha Ocean shipyard to design tanks for seven new liquefied natural gas carriers (LNGCs).
- December 2025: Galveston LNG Bunker Port (GLBP) has taken a significant step forward, moving past mere permitting and design stages. The port has inked a commercial heads of agreement, marking a pivotal moment for LNG bunker fuel operations in Galveston Bay.
- November 2025: Wärtsilä Gas Solutions, a division of the technology group Wärtsilä, will deliver solutions for a new LNG Bunkering Vessel built at Jiangnan Shipyard in China for Shanghai International Port Group (SIPG) Energy Shanghai Co. The scope includes the cargo handling system, fuel gas supply system, and boil-off gas reliquefaction system.


Global Liquefied Natural Gas (LNG) Bunkering Market Report Scope
Stricter environmental regulations drive LNG bunkering and have emerged as a cleaner alternative for refueling ships, using Liquefied Natural Gas (LNG) instead of traditional marine fuels like heavy fuel oil. While LNG offers the advantage of reduced emissions, its adoption necessitates specialized cryogenic infrastructure and adherence to stringent safety protocols.
The global liquefied natural gas (LNG) bunkering market is segmented by end user and geography. By end user, the market is segmented into tanker fleet, container fleet, bulk and general cargo fleet, ferries and OSV, and other end-users. The market forecasts are provided in terms of volume (Metric Tons).
By End User
| Tanker Fleet |
| Container Fleet |
| Bulk and General Cargo Fleet |
| Ferries and OSV |
| Other End-Users |
By Geography
| North America | United States |
| Canada | |
| Mexico | |
| Europe | Germany |
| France | |
| Spain | |
| Italy | |
| Netherlands | |
| Sweden | |
| Belgium | |
| Russia | |
| Rest of Europe | |
| Asia-Pacific | China |
| Japan | |
| South Korea | |
| Singapore | |
| Malaysia | |
| Australia | |
| Rest of Asia-Pacific | |
| South America | Brazil |
| Panama | |
| Argentina | |
| Rest of South America | |
| Middle East and Africa | United Arab Emirates |
| Saudi Arabia | |
| Oman | |
| South Africa | |
| Egypt | |
| Rest of Middle East and Africa |
| By End User | Tanker Fleet | |
| Container Fleet | ||
| Bulk and General Cargo Fleet | ||
| Ferries and OSV | ||
| Other End-Users | ||
| By Geography | North America | United States |
| Canada | ||
| Mexico | ||
| Europe | Germany | |
| France | ||
| Spain | ||
| Italy | ||
| Netherlands | ||
| Sweden | ||
| Belgium | ||
| Russia | ||
| Rest of Europe | ||
| Asia-Pacific | China | |
| Japan | ||
| South Korea | ||
| Singapore | ||
| Malaysia | ||
| Australia | ||
| Rest of Asia-Pacific | ||
| South America | Brazil | |
| Panama | ||
| Argentina | ||
| Rest of South America | ||
| Middle East and Africa | United Arab Emirates | |
| Saudi Arabia | ||
| Oman | ||
| South Africa | ||
| Egypt | ||
| Rest of Middle East and Africa | ||


Key Questions Answered in the Report
How large is the LNG bunkering market today?
The LNG bunkering market size reached 13.68 million metric tons in 2026 and is forecast to exceed 56.29 million metric tons by 2031.
What is the expected growth rate for LNG bunkering between 2026 and 2031?
Nameplate capacity is anticipated to expand at a robust 32.7% CAGR during the forecast period.
Which vessel segment is driving demand for marine LNG fuel?
Container shipping leads demand, holding 39.7% of bunkering volume in 2025 and projected to grow at 35.8% CAGR through 2031.
Which region is poised for the fastest growth in LNG bunkering?
Asia-Pacific is projected to register the highest regional CAGR of 40.5% through 2031 as Singapore, China, and South Korea expand infrastructure.
What are the main challenges facing wider LNG bunkering adoption?
High capital costs for bunkering assets and concerns over methane slip remain key restraints despite technological progress and supportive regulations.
Who are the leading suppliers in the LNG bunkering space?
Integrated energy majors such as Shell, TotalEnergies, and ENGIE command roughly 45% of global volumes, while regional specialists like Gasum and Pavilion Energy hold strong positions in their home markets.
Page last updated on:


