Lithium Titanate Oxide Battery Market Size and Share
Market Overview
| Study Period | 2020 - 2030 |
|---|---|
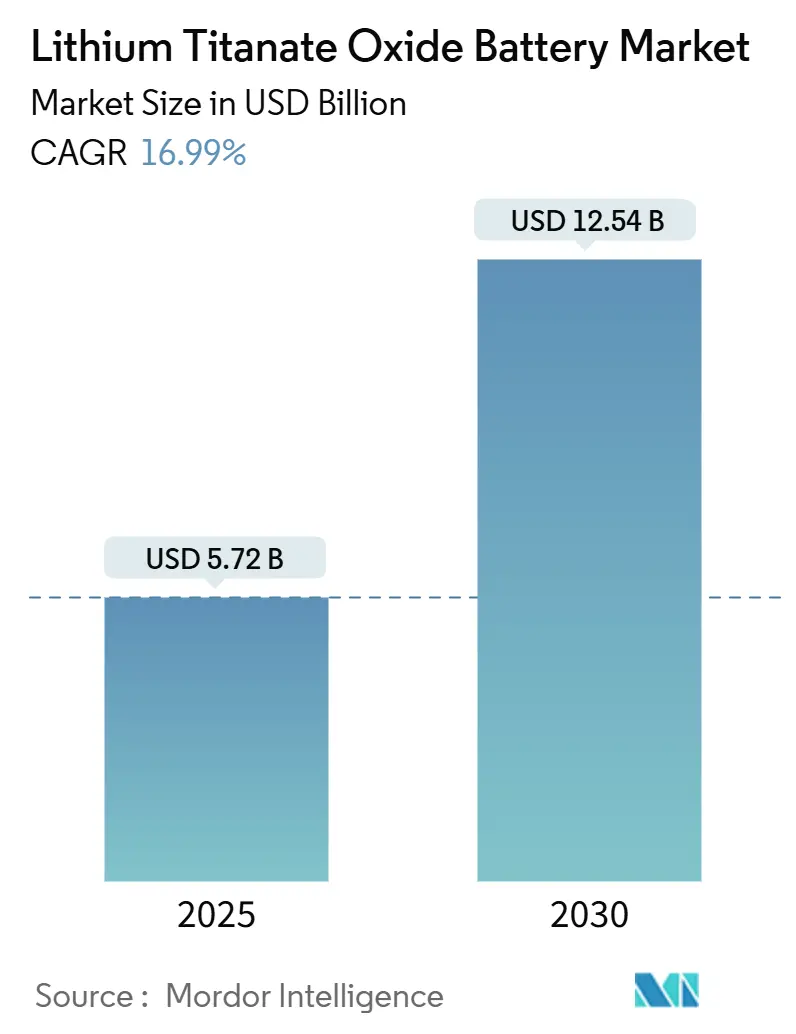
| Market Size (2025) | USD 5.72 Billion |
| Market Size (2030) | USD 12.54 Billion |
| Growth Rate (2025 - 2030) | 16.99% CAGR |
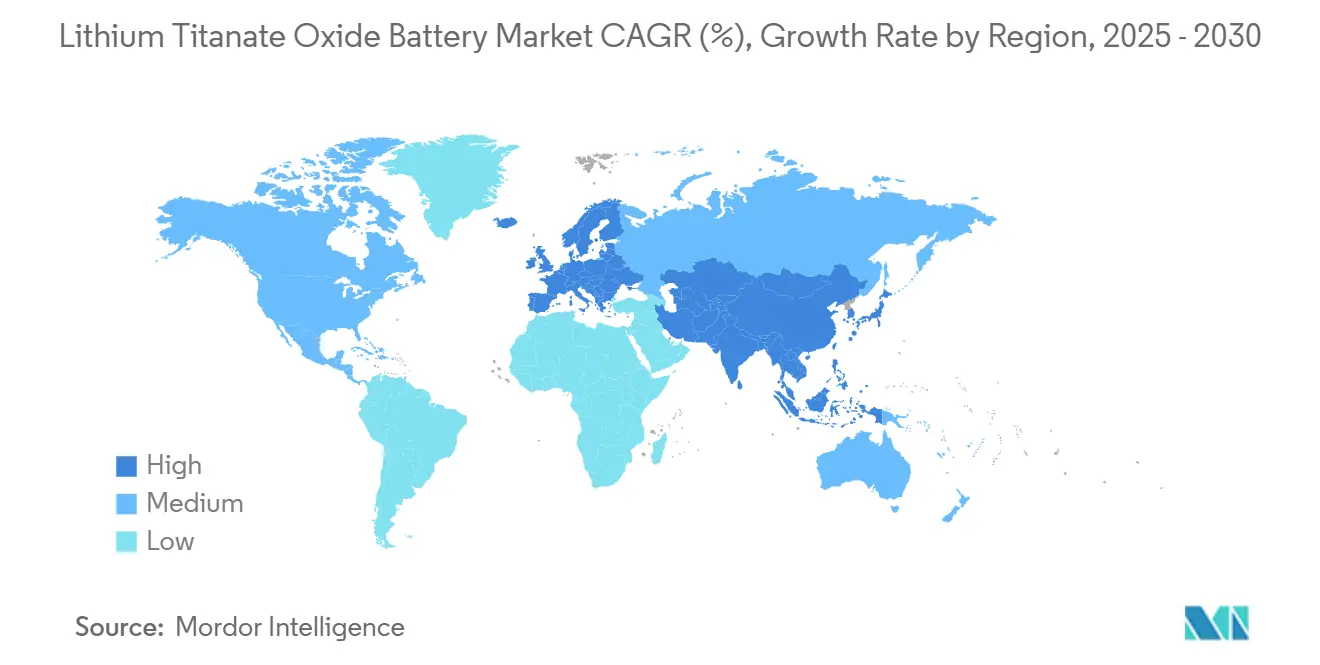
| Fastest Growing Market | Asia Pacific |
| Largest Market | Asia Pacific |
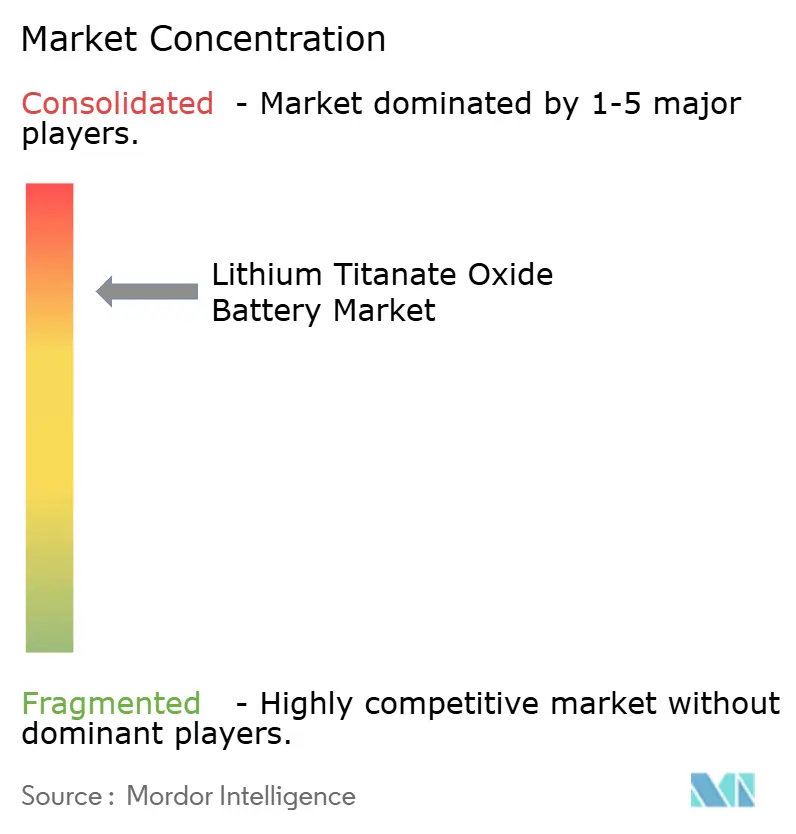
| Market Concentration | Medium |
Major Players *Disclaimer: Major Players sorted in no particular order Image © Mordor Intelligence. Reuse requires attribution under CC BY 4.0. | |
Lithium Titanate Oxide Battery Market Analysis by Mordor Intelligence
The Lithium Titanate Oxide Battery Market size is estimated at USD 5.72 billion in 2025, and is expected to reach USD 12.54 billion by 2030, at a CAGR of 16.99% during the forecast period (2025-2030).
Fast-charging public-transport programs in the United States, India, and China, together worth more than USD 5 billion through 2027, are shifting procurement priorities from energy density toward ultra-high power capability.[1]United States Environmental Protection Agency, “Clean School Bus Program,” epa.gov Fleet operators now optimize total cost of ownership by combining smaller packs with megawatt-class chargers, while stationary-storage developers in frequency markets pay a premium for cells that can deliver millions of short-duration cycles. Government incentives favor chemistries that maintain at least 80% capacity after 5,000 cycles, a specification that LTO cells exceed by a factor of four. Competitive intensity remains moderate because fewer than 10 companies own large-scale LTO anode lines, but recent expansions in the United States and Europe indicate supply diversification is underway.
Key Report Takeaways
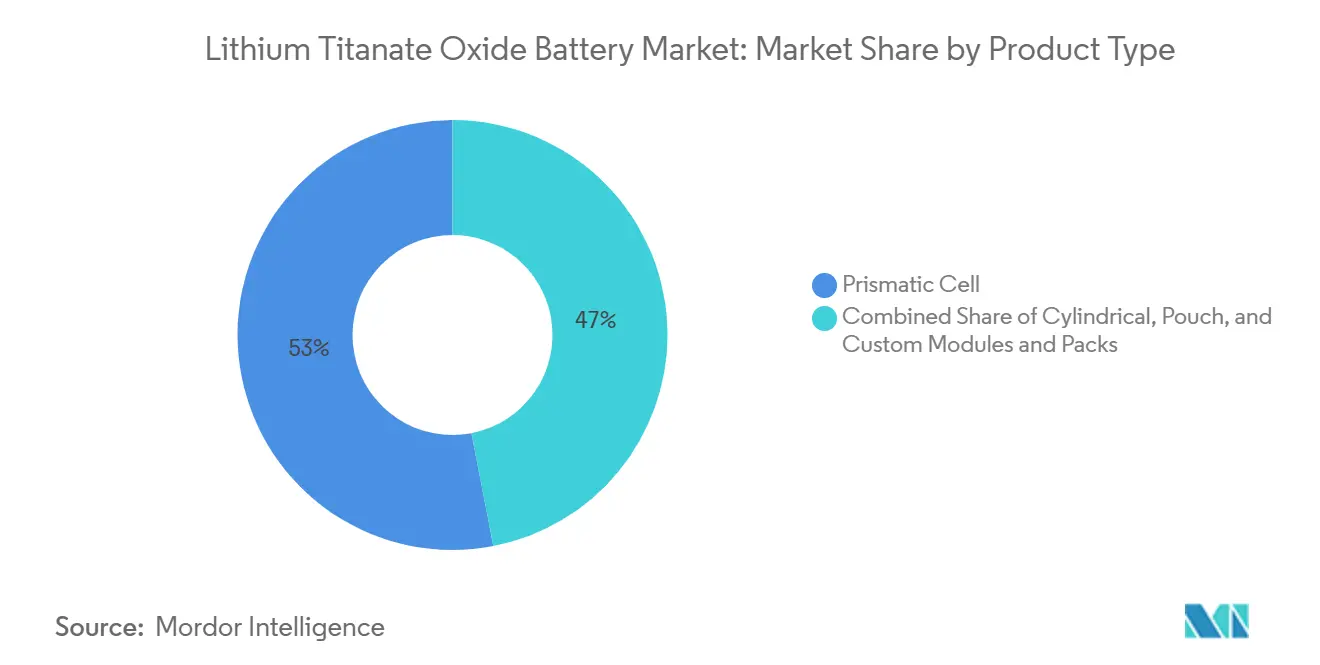
- By product type, prismatic cells held 53.05% of the lithium titanate oxide battery market share in 2024; cylindrical and pouch cells trailed behind.
- By capacity range, the 10 to 100 kWh segment accounted for 52.84% of the lithium titanate oxide battery market size in 2024 and will expand at an 18.07% CAGR through 2030.
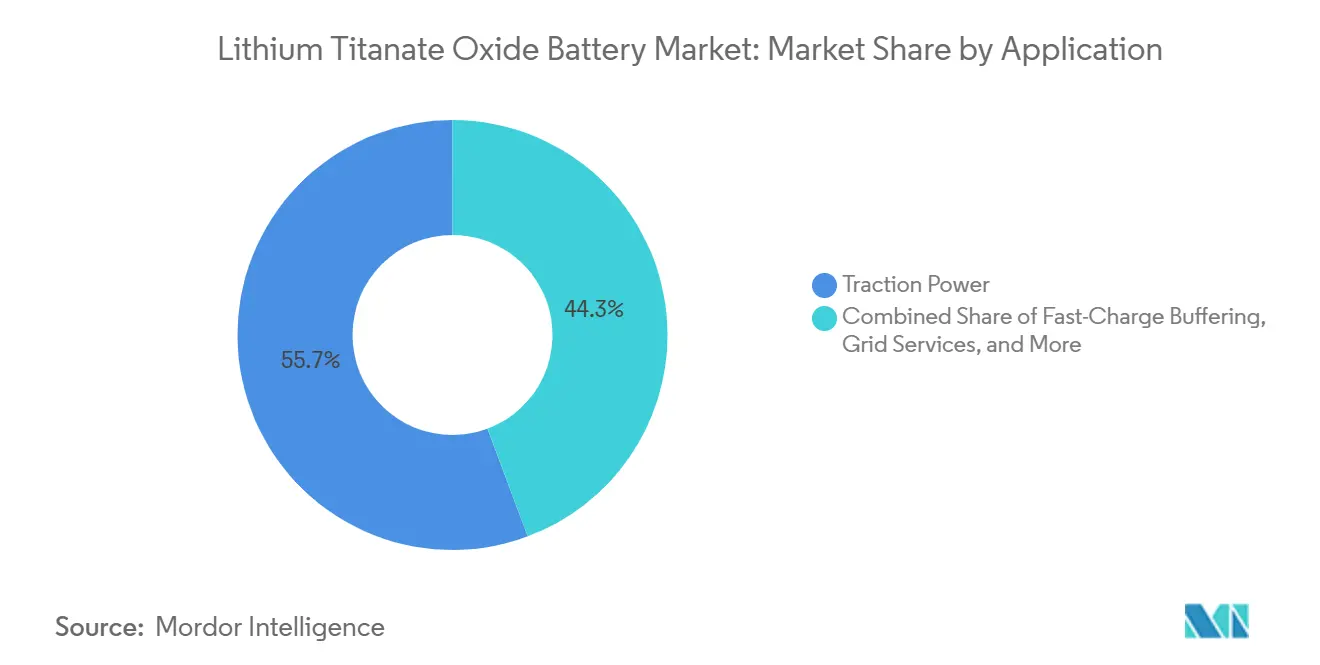
- By application, traction power captured 55.70% revenue in 2024; grid services will post the fastest CAGR at 18.16% to 2030.
- By end-use, automotive led with 35.16% of demand in 2024, while public transportation is projected to grow the fastest at 18.89% through 2030.
- By geography, Asia-Pacific held 44.79% of global revenue in 2024 and is forecast to rise at an 18.57% CAGR through 2030.
Global Lithium Titanate Oxide Battery Market Trends and Insights
Drivers Impact Analysis*
| Driver | (~) % Impact on CAGR Forecast | Geographic Relevance | Impact Timeline |
|---|---|---|---|
| Increasing demand for fast-charging electric buses and trucks | +3.8% | APAC core, North America, Europe | Medium term (2-4 years) |
| Superior safety and ultra-long cycle life for stationary storage | +2.9% | Global, with early concentration in Nordic frequency markets and APAC grid services | Long term (≥ 4 years) |
| Government incentives for low-emission public-transport fleets | +3.2% | North America, Europe, India, China | Short term (≤ 2 years) |
| Emergence of 5-minute battery-swap stations using LTO chemistry | +2.4% | China, with pilot expansion to ASEAN | Medium term (2-4 years) |
| Remote mining micro-grid deployments in extreme climates | +1.1% | Australia, Canada, Nordic regions, select African sites | Long term (≥ 4 years) |
| Defense need for ultra-low-temperature power packs for UAVs | +0.8% | North America, Europe, select Middle East partners | Medium term (2-4 years) |
| Source: Mordor Intelligence | |||
Increasing Demand for Fast-Charging Electric Buses and Trucks
Transit agencies have proved that 10-minute depot charging lets e-buses and heavy trucks complete 18-hour duty cycles without oversized batteries, a model validated in Germany’s eHaul trials during 2024.[2]European Commission, “eHaul Horizon 2020 Final Report,” cordis.europa.eu Nordic mandates require all new buses to support fast-charging protocols by 2030, channeling orders toward chemistries that operate safely at 10C rates.[3]Nordic Council of Ministers, “Transport Policy 2024,” norden.org China’s transport regulator now prioritizes battery-swap-ready buses for intercity corridors, bifurcating fleet specifications between high-utilization LTO packs and overnight-charged LFP packs.[4]Ministry of Transport China, “Battery Swap Guidelines,” mot.gov.cn The United States allocated USD 1.5 billion in 2024 for zero-emission bus grants, embedding 5,000-cycle warranty thresholds that nickel-rich chemistries rarely meet. Together, these moves lift demand for power-centric LTO variants across three continents.
Superior Safety and Ultra-Long Cycle Life for Stationary Storage
Grid operators in Korea, Switzerland, and the Nordic region pay premiums for batteries that can cycle hundreds of times daily without measurable fade, as shown by Kokam’s 16 MW installation achieving a 93-day payback. Frequency-containment markets updated rules in 2025 to demand sub-second response, an area where LTO strings outperform energy-dense chemistries that heat quickly at 10 °C discharge. The spinel structure of lithium titanate eliminates lithium plating, removing the thermal-runaway pathway behind recent high-nickel recalls. Commercial buildings add 50-80 kWh LTO banks to shave demand charges twice daily for 15 years, yielding lower levelized costs than swapping LFP every seven years. Because regulators increasingly link grid-service licenses to life-cycle safety audits, cells with million-cycle credentials gain privileged access to ancillary revenue streams.
Government Incentives for Low-Emission Public-Transport Fleets
India’s FAME III program budgets INR 10,000 crore through 2027 for 50,000 e-buses, requiring 80% residual capacity after 12 years, a warranty bar that only LTO suppliers currently accept. The European Clean Bus Deployment Initiative co-finances 150 kW infrastructure that prismatic LTO packs can absorb without active cooling. China extended commercial-vehicle subsidies through 2027 expressly for battery-swap systems, directing provincial fleets to chemistries that endure 15,000 cycles. In the United States, the Inflation Reduction Act tax credits reward cobalt-free chemistries, adding a cost edge to titanium-based cells. As subsidies pivot from range to lifetime energy throughput, the lithium titanate oxide battery market recalibrates R&D budgets toward power-dense anodes.
Emergence of 5-Minute Battery-Swap Stations Using LTO Chemistry
China surpassed 2,000 heavy-duty swap stations in 2024, letting trucks refuel in 5 minutes and maintain 24-hour utilization. Swap operators amortize LTO packs over 10,000–15,000 cycles; economics are infeasible for nickel-manganese-cobalt systems. Stellantis partnered with Ample to pilot modular LTO packs for delivery vans in California, proving that uptime metrics trump energy density in last-mile logistics. Japan is drafting interoperability standards so one pool of swappable packs can serve multiple brands, echoing the lead-acid model in forklifts. Because swap networks effectively decouple pack ownership from vehicles, cell makers gain predictable second-life demand for stationary buffers, expanding revenue across two adjacent value pools.
Restraints Impact Analysis*
| Restraint | (~) % Impact on CAGR Forecast | Geographic Relevance | Impact Timeline |
|---|---|---|---|
| Higher cost per kWh versus NMC and LFP chemistries | -2.7% | Global, with acute price sensitivity in cost-conscious ASEAN and South American markets | Short term (≤ 2 years) |
| Limited volumetric energy density for passenger-car BEVs | -1.9% | North America, Europe, China passenger vehicle segments | Medium term (2-4 years) |
| Constrained supply of battery-grade titanium feedstock | -1.4% | Global, with bottlenecks in Australia, South Africa ore processing | Long term (≥ 4 years) |
| Recycling complexity due to stable spinel lattice | -0.8% | Europe, North America facing circular-economy mandates | Long term (≥ 4 years) |
| Source: Mordor Intelligence | |||
Higher Cost per kWh Versus NMC and LFP Chemistries
LTO cells cost USD 150–200 per kWh, 30–50% above LFP and NMC cells, which constrains adoption in cost-sensitive car segments. Titanium feedstock is dearer than nickel, manganese, and cobalt on a per-kWh basis, and energy density shortfalls require larger packs to achieve equivalent range. Emerging subsidy schemes tie incentives to domestic content but rarely offset the absolute premium, pushing automakers to reserve LTO for niche commercial models. Stationary-storage developers in India and Brazil still favor cheaper LFP at the expense of cycle life because project-finance models discount long-dated replacements more heavily than upfront capex.
Limited Volumetric Energy Density for Passenger-Car BEVs
Titanate’s theoretical capacity caps pack energy densities at 60-120 Wh/kg; a 400-mile sedan would need a 150 kWh pack exceeding 1,200 kg, versus 550 kg for NMC solutions.[5]SAE International, “Battery Technology Symposium Proceedings 2024,” sae.org The spatial penalty reduces trunk volume and alters crash dynamics, making LTO a non-starter for mainstream BEVs. Fleet trucks over 10 tons can absorb the weight because payload thresholds coincide with regulatory exemptions, and fast charging allows smaller modules. For private buyers prioritizing range and cabin space, LTO’s safety edge does not justify its bulk.
*Our forecasts treat driver/restraint impacts as directional, not additive. The impact forecasts reflect baseline growth, mix effects, and variable interactions.
Segment Analysis
By Product Type: Prismatic Cells Sustain Thermal Advantage in High-Power Duty
Prismatic formats captured 53.05% of the lithium titanate oxide battery market share in 2024 and will expand at a 17.77% CAGR through 2030 as power-dense buses, trucks, and grid systems gravitate to form factors that dissipate heat efficiently. The rigid casing resists vibration in transit fleets, trimming warranty claims and total cost of ownership. Cylindrical cells retain footholds in power tools and some consumer devices, but their round geometry lowers module packing density, limiting uptake in under-floor bus trays. Pouch cells cut weight yet require compression frames to curb swelling, eroding cost gains at the pack level. Manufacturers now align module designs around standardized 50 × 100 × 200 mm prismatic formats, enabling automated assembly lines that drop unit costs by 20%.
Custom module suppliers integrate proprietary cooling plates and battery-management algorithms to meet frequency-regulation demands. In stationary projects exceeding 10 MWh, integrators value the structural stability prismatic cells bring to stacked-container layouts. Aerospace integrators still select pouches for drones where weight trumps mechanical robustness, but that niche remains tiny relative to transit projects. As a result, prismatic cells will dominate additions to the lithium titanate oxide battery market through the forecast horizon.


By Capacity Range: 10 to 100 kWh Modules Mirror Urban-Transit Duty Cycles
The 10 to 100 kWh band accounted for 52.84% of the lithium titanate oxide battery market size in 2024 and will grow at an 18.07% CAGR to 2030, matching the daily energy needs of city buses and commercial buildings. A 60 kWh LTO pack propels a 40-foot bus for 50 miles, enabling terminal charging that avoids the extra mass of 200 kWh overnight-charged packs.[6]United States Federal Transit Administration, “Technical Report on Bus Energy Use,” transit.dot.gov Commercial real-estate owners use 50-80 kWh blocks to shave 200 kW peaks, saving USD 3,000–5,000 each month in demand fees. Below 10 kWh, sales focus on power tools and professional electronics, where 15-minute recharge cycles differentiate premium models.
Packs above 100 kWh address intercity buses and light rail auxiliaries but face competition from overhead electrification projects. Multi-MWh containerized systems above 500 kWh dominate grid services and renewable smoothing, yet these custom solutions represent a smaller unit count than urban-transit modules. As megawatt-class chargers proliferate at depots, the sweet spot for LTO pack sizing will remain the 10–100 kWh window, reinforcing its centrality in value creation across the lithium titanate oxide battery market.
By Application: Traction Power Captures Budget as Fleets Prioritize Uptime
Traction power represented 55.70% of the lithium titanate oxide battery market revenue in 2024 and is forecast to rise at an 18.16% CAGR as public transit agencies trade range for high-frequency charging. The EPA Clean School Bus Program funded more than 8,500 e-buses with fast-charge compatibility in 2024-2025. Grid-service installations contribute 18% of demand today, with ancillary capacities in Korea and Switzerland showcasing sub-second response times unavailable to graphite cells. Fast-charge buffer banks at urban charging hubs are emerging as a third pillar, offering 350 kW bursts to passenger EVs while drawing grid power off-peak.
Behind-the-meter peak-management applications grow steadily in commercial buildings, while backup-power installations displace lead-acid in hospitals and data centers that cycle weekly for readiness testing. Renewable-smoothing and industrial motive power fill the residual 12% of demand. The traction segment’s prominence underscores how charging-time economics rather than range now drive procurement in the lithium titanate oxide battery market.
By End-Use Industry: Public Transportation Delivers the Fastest Upside
Automotive, including heavy commercial vehicles, held a 35.16% share in 2024, but public transport, encompassing bus, rail, and ferry systems, will post the fastest 18.89% CAGR to 2030. Agencies align 12-year vehicle replacement cycles with LTO’s 20,000-cycle design life, avoiding mid-life pack swaps required by LFP. Norway’s Norled ferry operator electrified five short-haul routes with 10-minute boarding-charge protocols, saving 1,200 t CO₂ annually. Energy-storage systems ranked second at 28%, tightening as ancillary-service rules favor million-cycle chemistries in Europe and Asia.
Industrial robotics, aerospace, and defense occupy high-margin niches where temperature resilience and safety command premiums. Consumer electronics make up a minor slice, restricted to professional gear needing daily recharge without fade. Overall, public-transport procurement guidelines that embed cycle-life metrics are pivoting demand away from nickel-rich alternatives, reshaping end-use allocation within the lithium titanate oxide battery market.
Geography Analysis
Asia-Pacific retained 44.79% of global revenue in 2024 and is set to rise at an 18.57% CAGR to 2030 as China’s 2,000-plus swap stations and India’s FAME III bus tenders propel volume.[7]China Electric Vehicle Charging Infrastructure Promotion Alliance, “Swap Station Deployment 2024,” evcipa.org.cn Japan scales rail-storage projects, while South Korea demonstrates 93-day paybacks in ancillary markets. ASEAN pilots in Thailand and Indonesia could unlock follow-on orders once infrastructure subsidies materialize.
North America captured a 28% share in 2024, lifted by USD 3 billion in EPA school-bus grants and IRA manufacturing credits.[8]Home Treasury, “Inflation Reduction Act Guidance 2024,” home.treasury.gov Canada’s Arctic mines choose LTO for −30°C operation without heaters, and Mexico evaluates depot-charge bus corridors pending fiscal approval.
Europe held a 22% share, underpinned by Germany’s eHaul truck corridor trials and Norway’s zero-emission mandates for buses and ferries. The United Kingdom and Sweden structures tenders around 150 kW chargers that prismatic LTO cells can accept continuously. South America, plus the Middle East & Africa, combine for 6%, constrained by funding gaps, yet mining microgrids in South Africa and autonomous shuttles in Dubai showcase high-temperature resilience.[9]Dubai Roads and Transport Authority, “Autonomous Shuttle Specifications 2024,” rta.ae Regional divergence, therefore, reflects policy emphasis on charging-time economics rather than volumetric density.

Competitive Landscape
The lithium titanate oxide battery market remains moderately concentrated, yet its center of gravity has shifted as Saft Groupe SAS, Toshiba Corporation, Microvast Holdings, and a growing cohort of Chinese manufacturers, Grinergy, Hunan Huahui, Yinlong Energy, and Altairnano, now account for about 75% of global lithium titanate oxide (LTO) cell capacity. Saft, backed by TotalEnergies, leans on a century of defense-sector pedigree to position its LTO line as the default option for European unmanned aerial systems that must deliver full power at –40 °C; multiple 2024 framework contracts with Airbus Defence and Leonardo embed that cold-weather benchmark. Toshiba continues to monetize two decades of SCiB field data by bundling maintenance guarantees that promise sub-2 % capacity loss over the first 10,000 cycles, a pledge that rail operators in Japan and the United Kingdom reference in long-term service agreements.
Microvast exploits regulatory fragmentation through a dual-footprint model: low-cost cell fabrication in Huzhou for Asian swap-station integrators and Buy-America-compliant module assembly in Clarksville, Tennessee, which now feeds Oshkosh Defense and U.S. school-bus projects. Chinese challengers focus on cost leadership rather than chemistry innovation; Grinergy and Hunan Huahui each commissioned 1 GWh LTO lines in 2024 dedicated to standardized 50 kWh packs that circulate through the country’s 2,000-plus commercial swap depots. Because cell makers that master both anode synthesis and module-level heat management can drive internal resistance below 10 mΩ at the 20 Ah format, the technical moat around incumbent leaders remains wide and capital-intensive to breach.
Second-tier suppliers are carving defensible niches by differentiating at the system layer rather than competing head-on for cell volume. Leclanché blends imported LTO cells with proprietary power-conversion hardware that meets ENTSO-E’s 500-millisecond response threshold for frequency containment reserves, winning 40 MWh in Swiss and Dutch tenders during 2024. Australian integrator Zenaji markets 10 kWh residential systems carrying 20-year, unlimited-cycle warranties; although volumes are modest, the product sidesteps a crowded lithium-iron-phosphate field by appealing to homeowners focused on lifetime value over first cost. Stanford University researchers disclosed a 180 Wh/kg hybrid anode that blends titanate with silicon nanoparticles while retaining 80% of LTO’s cycle-life benefit, a potential medium-term threat if scale-up costs fall below USD 140 per kWh.
Meanwhile, smaller North American integrators such as ELB Energy Group and Wise Energy Technologies assemble imported cells into application-specific packs, leveraging Inflation Reduction Act domestic-content credits on the module, rather than the cell portion of the bill of materials. Because establishing a 1 GWh greenfield LTO cell line still requires roughly USD 200 million in calcination furnaces and quality-control tooling, venture-backed entrants tend to favor asset-light system-integration models until titanium feedstock and energy-density gains narrow today’s cost delta with nickel-rich chemistries.
Lithium Titanate Oxide Battery Industry Leaders
Toshiba Corporation
Gree Altairnano New Energy Inc.
Saft Groupe SAS
Microvast Holdings, Inc.
Leclanché SA
- *Disclaimer: Major Players sorted in no particular order

Recent Industry Developments
- August 2025: Grinergy Co., Ltd. announced plans to establish a large-scale lithium titanate (Li₄Ti₅O₁₂) battery production facility in Dundee, Scotland, through its joint venture, TitanVolt Limited. The facility will include lithium titanate cell manufacturing, battery pack assembly, and a logistics hub, positioning Dundee as a strategic base for Europe’s green energy transition.
- April 2025: South Korean lithium titanate oxide (Li₄Ti₅O₁₂) battery manufacturer Grinergy Co., Ltd. announced that it has secured a USD 1.5 million (KRW 2 billion) investment from United Kingdom-based energy solutions provider TitanVolt Limited. This development supports Grinergy Co., Ltd.’s efforts to expand into the European market.
- September 2024: Microvast Holdings, Inc., a company that designs, develops, and manufactures lithium-ion battery solutions, is advancing the adoption of electric commercial vehicles by launching its latest high-performance battery solutions at the International Automobile Exhibition (IAA) Transportation 2024.
- March 2024: ZAPBATT, in collaboration with Toshiba, has launched its Battery Operating System (bOS), initially developed for Toshiba’s SCiB™ lithium titanium oxide (LTO) battery chemistry. The bOS enables the integration of various battery chemistries across applications.


Global Lithium Titanate Oxide Battery Market Report Scope
The Lithium Titanate Oxide Battery market report includes:
| Cylindrical Cell |
| Prismatic Cell |
| Pouch Cell |
| Custom Modules and Packs |
| Up to 10 kWh |
| 10 to 100 kWh |
| 100 to 500 kWh |
| Above 500 kWh |
| Traction Power |
| Fast-Charge Buffering |
| Grid Services |
| Behind-the-Meter Peak Management |
| Backup & Emergency Power |
| Other Applications (Renewable Smoothing, Industrial Motive Power, Specialty & Mission-Critical, etc.) |
| Automotive (BEV, HEV, PHEV, e-Bus, e-Truck) |
| Energy Storage Systems |
| Industrial Equipment and Robotics |
| Aerospace and Defense |
| Consumer Electronics and Power Tools |
| Public Transportation (Rail and Ferry) |
| Others |
| North America | United States |
| Canada | |
| Mexico | |
| Europe | Germany |
| United Kingdom | |
| France | |
| Spain | |
| NORDIC Countries | |
| Russia | |
| Rest of Europe | |
| Asia-Pacific | China |
| India | |
| Japan | |
| South Korea | |
| ASEAN Countries | |
| Australia and New Zealand | |
| Rest of Asia-Pacific | |
| South America | Brazil |
| Argentina | |
| Colombia | |
| Rest of South America | |
| Middle East and Africa | Saudi Arabia |
| United Arab Emirates | |
| South Africa | |
| Egypt | |
| Rest of Middle East and Africa |
| By Product Type | Cylindrical Cell | |
| Prismatic Cell | ||
| Pouch Cell | ||
| Custom Modules and Packs | ||
| By Capacity Range | Up to 10 kWh | |
| 10 to 100 kWh | ||
| 100 to 500 kWh | ||
| Above 500 kWh | ||
| By Application | Traction Power | |
| Fast-Charge Buffering | ||
| Grid Services | ||
| Behind-the-Meter Peak Management | ||
| Backup & Emergency Power | ||
| Other Applications (Renewable Smoothing, Industrial Motive Power, Specialty & Mission-Critical, etc.) | ||
| By End-Use Industry | Automotive (BEV, HEV, PHEV, e-Bus, e-Truck) | |
| Energy Storage Systems | ||
| Industrial Equipment and Robotics | ||
| Aerospace and Defense | ||
| Consumer Electronics and Power Tools | ||
| Public Transportation (Rail and Ferry) | ||
| Others | ||
| By Geography | North America | United States |
| Canada | ||
| Mexico | ||
| Europe | Germany | |
| United Kingdom | ||
| France | ||
| Spain | ||
| NORDIC Countries | ||
| Russia | ||
| Rest of Europe | ||
| Asia-Pacific | China | |
| India | ||
| Japan | ||
| South Korea | ||
| ASEAN Countries | ||
| Australia and New Zealand | ||
| Rest of Asia-Pacific | ||
| South America | Brazil | |
| Argentina | ||
| Colombia | ||
| Rest of South America | ||
| Middle East and Africa | Saudi Arabia | |
| United Arab Emirates | ||
| South Africa | ||
| Egypt | ||
| Rest of Middle East and Africa | ||


Key Questions Answered in the Report
What is the projected value of the lithium titanate oxide battery market in 2030?
The lithium titanate oxide market is forecast to reach USD 12.54 billion by 2030, reflecting a 16.99% CAGR.
Why are transit agencies choosing LTO batteries over NMC or LFP?
LTO packs endure 20,000 charge cycles and accept 10-minute depot charging, reducing fleet downtime and long-term replacement costs.
How does the 10 to 100 kWh capacity range support urban bus operations?
A 60 kWh LTO pack enables a 40-foot bus to cover 50 miles between short opportunity charges, trimming vehicle weight versus large overnight-charged packs.
Which region leads in battery-swap infrastructure?
Asia-Pacific leads, with China operating more than 2,000 heavy-duty swap stations by 2024.
What limits LTO adoption in passenger cars?
Volumetric energy density of 60-120 Wh/kg means an LTO pack for a 400-mile sedan would weigh over 1,200 kg, compromising vehicle range and space.
How does titanium supply affect the market?
China controls over 60% of battery-grade titanium; export quotas and limited alternative refining capacity elevate material costs and constrain expansion.
Page last updated on:


