
Biobetters Market Size and Share
Market Overview
| Study Period | 2020 - 2031 |
|---|---|
| Market Size (2026) | USD 67.07 Billion |
| Market Size (2031) | USD 97.91 Billion |
| Growth Rate (2026 - 2031) | 7.86 % |
| Fastest Growing Market | Asia Pacific |
| Largest Market | North America |
| Market Concentration | Medium |
Major Players *Disclaimer: Major Players sorted in no particular order Image © Mordor Intelligence. Reuse requires attribution under CC BY 4.0. | |
Biobetters Market Analysis by Mordor Intelligence
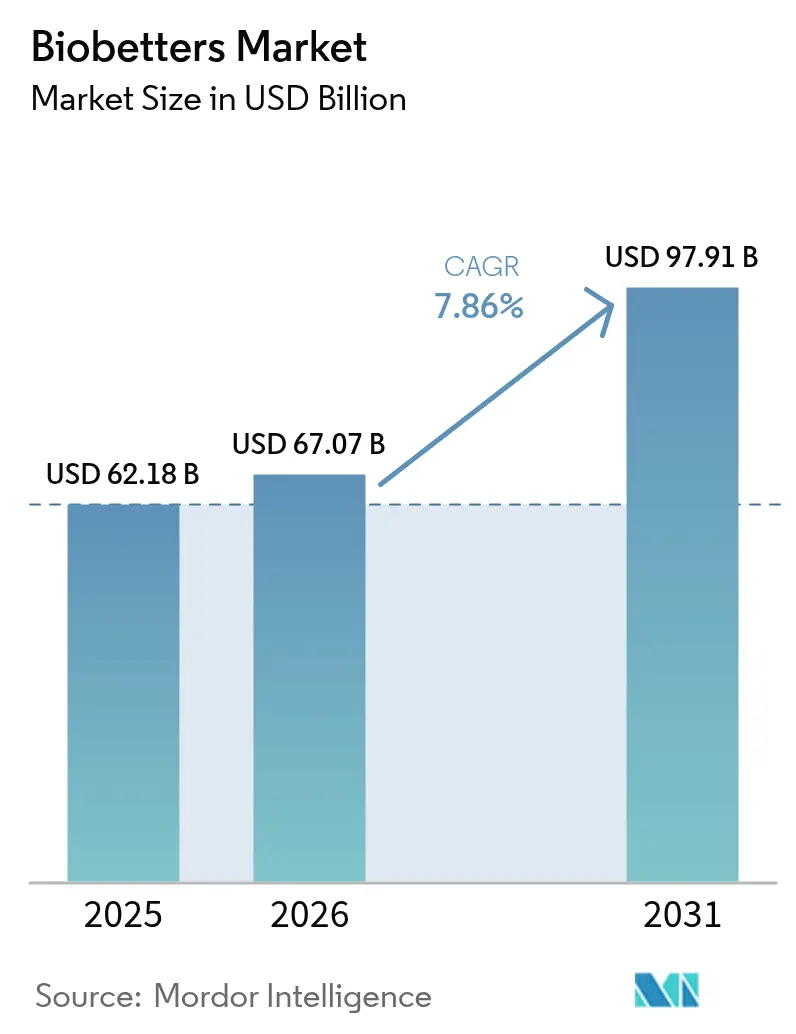
The biobetters market size was valued at USD 62.18 billion in 2025 and estimated to grow from USD 67.07 billion in 2026 to reach USD 97.91 billion by 2031, at a CAGR of 7.86% during the forecast period (2026-2031). This expansion underscores how the pharmaceutical sector is shifting resources toward biologics that move beyond simple parity and instead deliver superior efficacy, safety, or convenience compared with their reference products. Key growth engines include an accelerating patent cliff for legacy blockbusters, steady regulatory support for clinically differentiated biologics, and strong payer appetite for therapies that can lower downstream healthcare costs. At the same time, manufacturing innovations are improving yield and consistency, reducing some historical barriers to entry. Competitive momentum has intensified as biopharma leaders pair in-house R&D with targeted acquisitions to secure advanced protein-engineering platforms, thereby broadening the addressable opportunity within the biobetters market.
Key Report Takeaways
- By drug class, insulin led with 45.62% of the biobetters market share in 2025; monoclonal antibodies are forecast to expand at a 9.93% CAGR through 2031.
- By route of administration, subcutaneous delivery commanded 71.62% share of the biobetters market size in 2025, while oral formulations are projected to advance at a 10.21% CAGR to 2031.
- By application, diabetes accounted for 48.71% of the biobetters market size in 2025 and oncology is advancing at an 11.02% CAGR through 2031.
- By distribution channel, hospital pharmacies held 53.41% of the biobetters market share in 2025; online channels are expected to register the fastest growth at 11.35% CAGR to 2031.
- By region, North America maintained 47.98% share of the biobetters market in 2025, whereas Asia-Pacific is on course for a 9.31% CAGR to 2031.
Note: Market size and forecast figures in this report are generated using Mordor Intelligence’s proprietary estimation framework, updated with the latest available data and insights as of 2026.
Market Trends and Insights
Drivers Impact Analysis of Biobetters Market*
| Driver | (`) % Impact on CAGR Forecast | Geographic Relevance | Impact Timeline |
|---|---|---|---|
| Growing burden of chronic diseases | +1.8% | Global; strongest in North America and Europe | Long term (≥ 4 years) |
| Patent expiry of blockbuster biologics | +2.1% | Global; concentrated in developed markets | Medium term (2-4 years) |
| Rising demand for long-acting formulations | +1.5% | North America and EU; spreading to Asia-Pacific | Medium term (2-4 years) |
| Advances in site-specific protein engineering | +1.2% | Global; led by United States and Germany | Long term (≥ 4 years) |
| Expansion of value-based reimbursement models | +0.9% | North America and Western Europe | Short term (≤ 2 years) |
| Increase in biologics contract development capacity | +0.7% | Global; major capacity in Asia-Pacific | Medium term (2-4 years) |
| Source: Mordor Intelligence | |||
Growing Burden of Chronic Diseases
Chronic illnesses now account for the majority of global mortality, driving long-range demand for disease-modifying therapies. The World Health Organization projects chronic conditions will contribute to 73% of all deaths by 2030[1]World Health Organization, “Global Status Report on Noncommunicable Diseases,” who.int. Diabetes and oncology are at the forefront, where biobetters promise tighter glycemic control and more targeted cancer cell destruction. Novo Nordisk’s glucose-responsive insulin NNC2215 exemplifies this shift by modulating activity in response to real-time glucose fluctuations, thereby reducing hypoglycemia risk. Payers increasingly favor products that can avert hospitalizations and long-term complications, strengthening the economic case for premium-priced yet cost-effective biobetters. Regulators are likewise prioritizing expedited reviews for agents that address clear unmet needs in chronic care pathways.
Patent Expiry of Blockbuster Biologics
The rolling patent cliff is opening a USD 180 billion revenue gap as long-time staples such as Humira lose exclusivity[2]Health Affairs, “The Patent Cliff and Innovation,” healthaffairs.org. While biosimilars have captured a portion of this space, formulary hurdles and rebate structures have left significant untapped demand. Developers are seizing the opportunity to launch biobetter variants that extend patent life by improving dosing schedules, efficacy, or safety. FDA guidance on interchangeability has unintentionally tilted incentives toward superiority trials, where demonstrating clear clinical advantages can bypass switching-study complexities[3]Federal Register, “Guidance for Industry: Interchangeability of Biological Products,” federalregister.gov. Large-scale licensing deals in 2024 reflected this shift, with several agreements topping USD 1 billion as companies scrambled to backfill revenue lost to generic erosion.
Rising Demand for Long-Acting Formulations
Non-adherence to biologics carries a USD 100 billion annual cost burden globally. Long-acting technologies aim to solve this by cutting injection frequency. Eli Lilly’s partnership with Camurus underscores rising corporate interest in delivery platforms that extend GLP-1 activity from weekly to monthly. Pegylation and pro-drug conjugation allow steady drug release, improving real-world effectiveness and reducing clinic visits. Regulators are supporting streamlined pathways when pharmacokinetic superiority over older injectables is convincingly demonstrated.
Advances in Site-Specific Protein Engineering
Precision engineering methods such as sortase-mediated ligation are producing homogeneous antibody-drug conjugates with predictable drug-to-antibody ratios. FDA approvals of site-specific ADCs in 2024 signaled mainstream acceptance of these techniques. Glyco-optimization further enhances effector function, and cell-free synthesis accelerates variant screening, shortening development cycles. Because these technologies are hard to replicate, they also provide durable intellectual-property barriers against biosimilar erosion.
Restraints Impact Analysis of Biobetters Market*
| Restraints Impact Analysis | (~) % Impact on CAGR Forecast | Geographic Relevance | Impact Timeline |
|---|---|---|---|
| High development and manufacturing costs | -1.4% | Global; most acute in smaller biotech firms | Long term (≥ 4 years) |
| Intensifying biosimilar price competition | -1.1% | Developed markets; muted effect in emerging markets | Medium term (2-4 years) |
| Regulatory uncertainty for novel modification technologies | -0.9% | Global; most pronounced in the United States and European Union | Short term (≤ 2 years) |
| Limited access to high-throughput glyco-analytics platforms | -0.6% | Global; critical gap in emerging biotech hubs | Medium term (2-4 years) |
| Source: Mordor Intelligence | |||
High Development and Manufacturing Costs
Average outlays for a full biobetter program reach USD 2.3 billion, exceeding typical biosimilar budgets by a wide margin. Demonstrating superiority requires large, lengthy trials and specialized analytics that can add USD 50–100 million in characterization costs. Manufacturing is equally capital-intensive, often needing bespoke purification or formulation steps that cannot piggyback on existing biosimilar lines. These financial realities have prompted consolidation, with cash-rich pharma companies absorbing smaller innovators to secure pipeline depth.
Intensifying Biosimilar Price Competition
Biosimilar penetration has surpassed 80% within five years of launch in oncology categories, forcing originator products to discount by more than 50% on average. The resulting price erosion challenges the premium positioning essential for biobetter uptake. Pharmacy benefit managers leverage scale to negotiate steep rebates, particularly in TNF inhibitors and anti-VEGF classes. Developers therefore focus on areas where biosimilar replication is technically daunting, such as antibody-drug conjugates and long-acting insulins, to sustain differentiation.
*Our forecasts treat driver/restraint impacts as directional, not additive. The impact forecasts reflect baseline growth, mix effects, and variable interactions.
Biobetters Market Segment Analysis
By Drug Class:
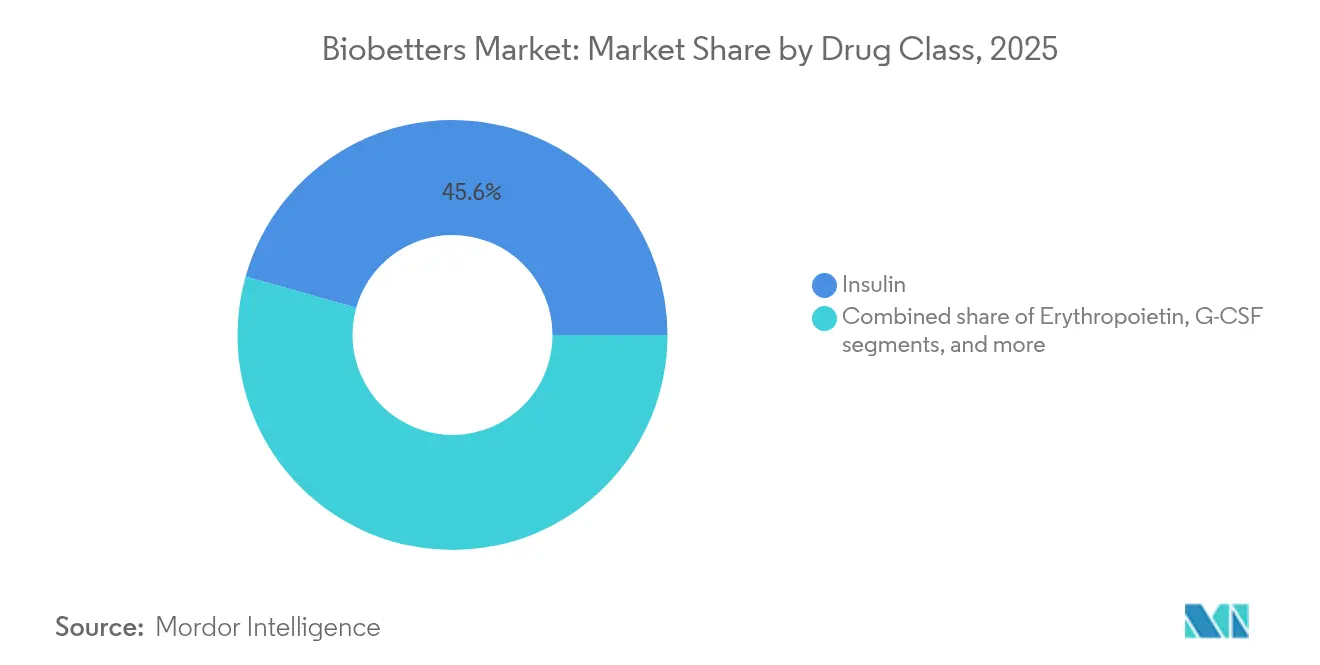
Insulin Innovation Drives Market LeadershipInsulin retained 45.62% of the biobetters market share in 2025, cementing its status as the largest drug-class contributor to the biobetters market. Its dominance reflects both the rising global diabetes burden and the complexity of achieving precise glycemic control, which tilts competition toward clinically enhanced versions rather than straightforward copies. Monoclonal antibodies, although smaller in absolute revenue, posted the fastest growth, advancing at a 9.93% CAGR on the back of antibody-drug conjugate breakthroughs that widen therapeutic indices.
The segment’s momentum is illustrated by glucose-responsive candidates such as Novo Nordisk’s NNC2215, which automatically modulates potency to mitigate hypoglycemia, a risk reported in up to 70% of insulin-treated patients. These innovations extend patent life, create hefty switching barriers, and help sustain premium pricing inside the biobetters market. Growth in granulocyte-colony stimulating factors and anti-hemophilic factors continues, though uptake is tempered by biosimilar encroachment and, in erythropoietin’s case, lingering safety debates.



By Route of Administration:
Subcutaneous Dominance ChallengedSubcutaneous injection accounted for 71.62% of the biobetters market in 2025 thanks to patient familiarity and the renal-sparing advantage of bypassing first-pass metabolism. Oral delivery, though still nascent, is clocking a rapid 10.21% CAGR as novel nanoparticle and enteric technologies safeguard proteins through the gastrointestinal tract. Should upcoming oral insulin programs demonstrate bioequivalence, the biobetters market size linked to diabetes therapy could widen sharply.
Intravenous routes remain indispensable for acute-care dosing and high-titer regimens, whereas inhaled administration targets respiratory conditions and systemic distribution of smaller proteins. Academic-industry consortia are overcoming gastric degradation through liposomal encapsulation and muco-adhesive polymers, raising hopes that once-daily oral forms can reach late-stage trials within the next five years. Success here would erode the injection barrier that currently discourages some patients from initiating biologic therapy.
By Application:
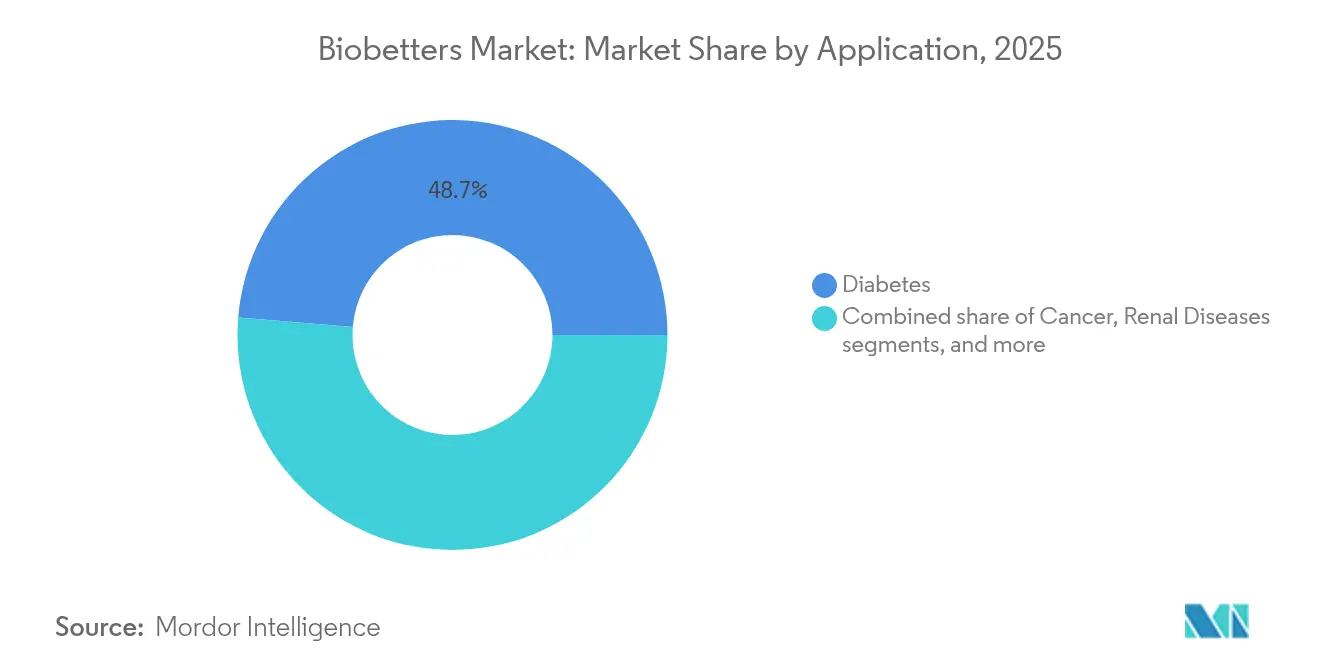
Diabetes Leads While Oncology AcceleratesDiabetes therapies generated 48.71% of the biobetters market size in 2025, anchored by established reimbursement frameworks and the chronic nature of treatment. Real-world adherence data illustrate the economic value of better glycemic control, incentivizing payers to fund premium therapies that curb long-term complications. Oncology, however, is advancing at 11.02% CAGR and may narrow the revenue gap before 2030.
Recent trials of antibody-drug conjugates such as pivekimab sunirine, which achieved 85% overall response in a rare leukemia subtype, underscore the clinical impact of next-generation constructs. Oncology’s growth benefits from orphan-drug incentives and expedited pathways that shorten time to market, making it a focal point for venture capital and strategic pharma alliances seeking to enlarge the biobetters market.
By Distribution Channel:
Hospital Dominance Under Digital PressureHospital pharmacies contributed 53.41% of 2025 revenue within the biobetters market, reflecting cold-chain requirements and physician preference for controlled administration environments. Yet online channels are expanding quickly at an 11.35% CAGR, helped by robust logistics platforms that safeguard temperature-sensitive goods. Retail outlets remain a staple for stable chronic patients, while specialty pharmacies manage complex regimens for rare diseases.
COVID-19 catalyzed demand for home-based care, prompting big pharmacy chains to invest in cold-chain storage, remote-monitoring apps, and auto-replenishment services. Regulatory frameworks are evolving to secure e-prescription validation and reimbursement parity, suggesting that digital distribution will steadily chip away at hospital dominance across the biobetters market.
Geography Analysis
North America Biobetters Market
North America generated 47.98% of global revenue for the biobetters market in 2025. The United States anchors this leadership through an FDA framework that rewards clinical superiority and a payer system willing to reimburse differentiated therapies at premium rates. High venture capital density and an integrated academic-biotech ecosystem speed the translation of lab breakthroughs into late-phase assets. Canada, while smaller, mirrors these dynamics within a single-payer context that scrutinizes cost-effectiveness but still approves innovations offering quantifiable patient benefits.
Europe Biobetters Market
Europe retains meaningful scale due to the European Medicines Agency’s centralized review, although national reimbursement negotiations introduce pricing complexity. Germany stands out for its pharmaceutical manufacturing base and reimbursement policies that acknowledge added therapeutic value. The United Kingdom’s post-Brexit regulatory independence could accelerate local approvals, making it an attractive launch pad for European expansion. Health technology assessments place a premium on real-world outcome data, channeling investment toward biobetters that provide measurable clinical gains.
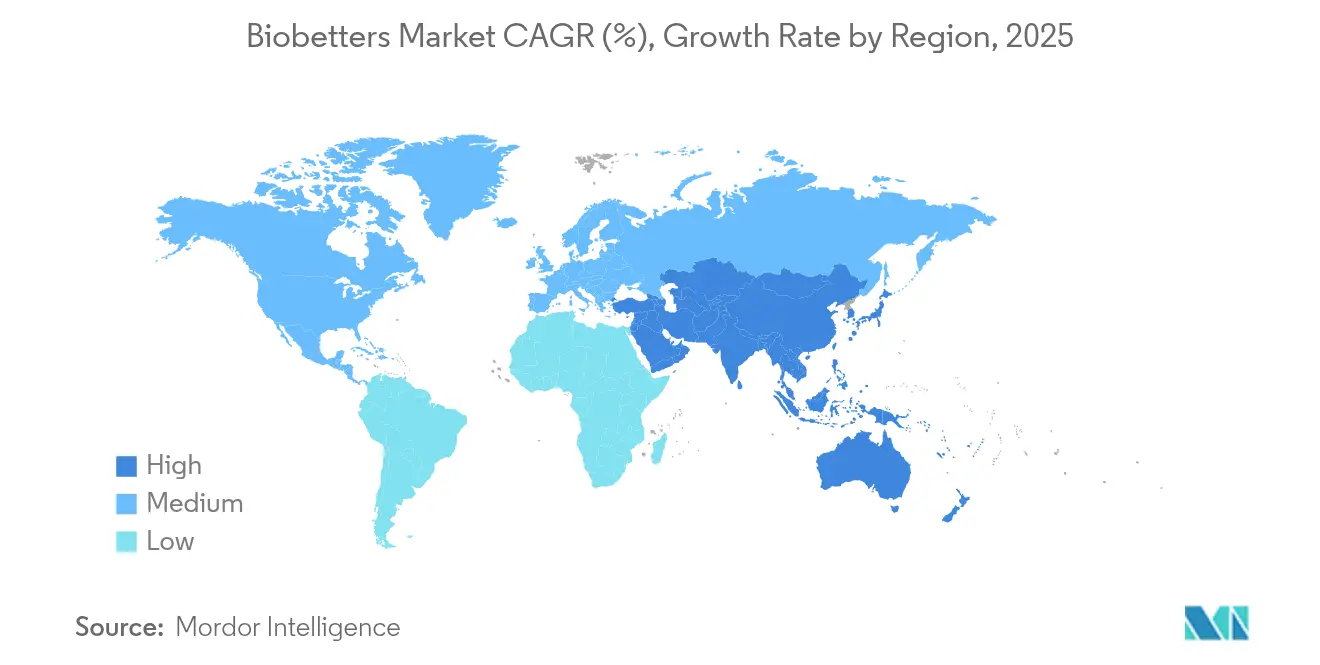
APAC Biobetters Market
Asia-Pacific is the fastest-growing region, posting a 9.31% CAGR that outpaces every other geography. China has rolled out policy reforms that condense review timelines for innovative biologics, enabling domestic champions such as Hansoh Pharmaceutical to attract global partners; Regeneron’s USD 2 billion license for dual GLP-1/GIP agonist HS-20094 is a prime example. Japan’s aging demographic fuels demand for chronic-disease biologics, while South Korea leverages government incentives and advanced manufacturing capacity to become a regional contract development hub. India’s vast patient pool and improving insurance coverage promise future upside, but pricing controls currently moderate premium uptake.

Regulatory Landscape
Biobetters generally do not have a dedicated regulatory pathway in major markets and are reviewed as new biological entities under full biologics applications, while biosimilars use abbreviated comparability frameworks under the BPCI Act in the United States and EMA biosimilar rules in Europe. This distinction affects evidence expectations, because sponsors pursuing clinically differentiated versions typically need head-to-head data showing superiority in outcomes such as dosing convenience, safety profile, or efficacy, rather than relying on analytical similarity alone.
Regulatory updates during 2025-2026 continued to emphasize analytics-led development for biosimilars, shaping how sponsors plan lifecycle strategies around reference products. In March 2026, FDA issued revised draft guidance in a Q&A format to facilitate biosimilar and interchangeable product licensure, and in October 2025 FDA draft guidance recommended reducing comparative efficacy studies and generally advised against switching studies for interchangeability. In Europe, EMA released a reflection paper on tailored clinical approaches in biosimilar development, reinforcing case-by-case reduction of clinical requirements when analytical and pharmacokinetic evidence is strong. EU-level work on a proposed European Biotech Act (2025) also points to policy momentum aimed at simplifying and accelerating biotechnology-related procedures.
Competitive Landscape
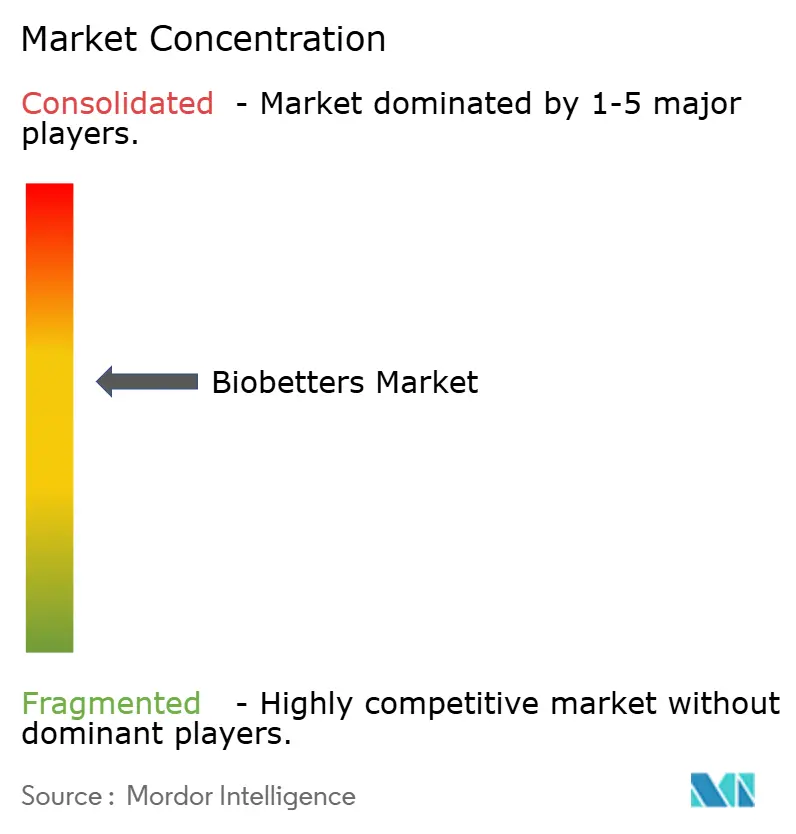
Biobetters market competition is moderate, with top players balancing deep capital pools against the nimbleness of smaller innovators. Global pharmaceutical leaders wield expansive clinical networks, regulatory acumen, and manufacturing scale, allowing them to derisk late-stage programs. Specialty biotech firms differentiate through proprietary engineering technologies that create hard-to-copy molecules. Strategic licensing has thus become the prevailing commercialization route, illustrated by BioNTech and Bristol Myers Squibb’s USD 9.1 billion bispecific-antibody alliance and AbbVie’s USD 1.7 billion acquisition of FutureGen’s TL1A antibody portfolio.
Technological moats center on site-specific conjugation, advanced pegylation, and delivery systems that can stretch dosing intervals. These platforms not only enhance clinical profiles but also establish robust patent estates, shielding revenue from biosimilar encroachment. Market access dynamics are evolving as payers increasingly adopt value-based contracts, pressuring suppliers to link reimbursement to patient-level outcomes. Companies therefore invest heavily in real-world evidence programs that quantify reductions in hospitalization, improved adherence, and quality-of-life enhancements.
White-space opportunities persist in rare diseases and complex chronic conditions where biologic competition remains limited. With manufacturing capabilities becoming more distributed—particularly through Asia-Pacific CDMOs—mid-size firms can now scale production without building multi-billion-dollar facilities. Nonetheless, regulatory uncertainty around demonstrating clinical superiority and sustained pressure from biosimilar price erosion maintain a competitive tension that encourages mergers, technology-focused acquisitions, and risk-sharing development pacts with contract manufacturers and academic spinouts.
Biobetters Industry Leaders
Amgen Inc.
Novo Nordisk A/s
F. Hoffmann-La Roche
Biogen
Merck & Co., Inc.
- *Disclaimer: Major Players sorted in no particular order
Biobetters Market Companies Covered in this Report
- Amgen
- Novo Nordisk
- Roche
- Merck
- Sanofi
- Genentech USA
- Eli Lilly and Company
- Biogen
- CSL Behring
- Pfizer
- Regeneron Pharmaceuticals
- Samsung Bioepis
- Celltrion Healthcare
- Biocon Biologics
- Xencor
- Argenx
- Ambrx
- AbCellera
- Outlook Therapeutics
- Sandoz Group

Market Opportunities and Future Outlook
Opportunities cluster where sponsors can translate clear clinical differentiation into platform-enabled products, particularly in monoclonal antibodies and complex formats such as bispecifics and antibody-drug conjugates. These formats are harder to replicate and can support stronger intellectual-property positions. In 2026, academic and peer-reviewed outputs highlighted accelerating toolkits for protein and expression engineering, including a May 2026 report describing a zero-shot antibody design approach that generated an anti-EGFR candidate with higher binding affinity versus cetuximab, and a June 2026 Scientific Reports publication describing a bicistronic expression system that improved light and heavy chain expression versus traditional IRES-based vectors. These advances support faster variant screening and manufacturability improvements, two practical constraints in biobetter programs.
Commercial whitespace also concentrates at the intersection of long-acting delivery and chronic diseases, where dosing interval, adherence, and total cost of care drive payer discussions. This aligns with the market shift toward subcutaneous dominance and the push for less frequent administration. Company activity in long-acting incretin and biologics delivery platforms, including Eli Lilly's agreement with Camurus for FluidCrystal-based long-acting GLP-1 and incretin programs, illustrates continued demand for enabling technologies that convert established mechanisms into more convenient regimens. In Asia-Pacific, regulatory modernization and a growing biologics development ecosystem provide additional entry points, supported by transactions and partnerships involving China-based innovators and global partners in advanced metabolic and biologic programs.
Recent Industry Developments in Biobetters Market
- July 2026: Teva Pharmaceutical Industries Ltd. and Polpharma Biologics announced an exclusive licensing agreement for commercialization of the ocrelizumab biosimilar PB018 across multiple regions, including the United States, Europe, and Brazil. The deal expands access to a major anti-CD20 therapy class while increasing competitive pressure on reference products as exclusivity eras end. It also reinforces licensing as a primary route to scale late-stage biologics portfolios without fully internalizing development and manufacturing risk.
- March 2026: Samsung Bioepis and Epis NexLab entered a research collaboration and license agreement with G2GBIO to develop a long-acting semaglutide candidate using G2GBIOs microsphere-based drug delivery platform. The collaboration signals continued investment in formulation and delivery engineering to extend dosing intervals for high-demand metabolic therapies. Platform-led partnerships like this can accelerate entry into differentiated biologics programs by pairing established biologics developers with specialized long-acting technologies.
- June 2024: Simcere Zaiming (Simcere Pharmaceutical Group) received marketing approval from Chinas NMPA for Enlituo (cetuximab beta), a next-generation EGFR-targeted antibody product. The approval highlights regulatory throughput for antibody innovations in China and supports the role of the local market as a launch and scale venue for modified biologics. It also raises the competitive bar in EGFR-targeted therapy by adding an additional antibody option beyond first-wave reference products.


Biobetters Market Report Scope and Research Methodology
Market Definition and Coverage
For this methodology, the biobetters market covers global sales value of clinically differentiated, protein based therapeutics that are engineered to improve on an approved reference biologic (such as better half life, dosing convenience, efficacy, or safety), and that are commercially launched.
Scope exclusions: We exclude veterinary and research use only biologic variants, and we do not count pre-launch pipeline candidates.
Segments Covered in This Report
- By Drug Class
- Erythropoietin
- Insulin
- G-CSF
- Monoclonal Antibodies
- Anti-Haemophilic Factor
- Other Drug Classes
- By Route Of Administration
- Subcutaneous
- Intravenous
- Inhaled
- Oral
- Other Route Of Administrations
- By Application
- Cancer
- Diabetes
- Renal Diseases
- Neuro-Degenerative Disorders
- Genetic Disorders
- Infectious Diseases
- Other Applications
- By Distribution Channel
- Hospital Pharmacies
- Retail Pharmacies
- Online Pharmacies
- Geography
- North America
- United States
- Canada
- Mexico
- Europe
- Germany
- United Kingdom
- France
- Italy
- Spain
- Rest of Europe
- Asia-Pacific
- China
- Japan
- India
- Australia
- South Korea
- Rest of Asia-Pacific
- Middle East & Africa
- GCC
- South Africa
- Rest of Middle East & Africa
- South America
- Brazil
- Argentina
- Rest of South America
- North America
Data Sources, Market Sizing, and Validation
Desk Research
Desk work starts by confirming which products qualify as a biobetter and when they became commercial, so the model counts only real sales periods. We review public regulatory and reference listings, such as the US FDA and EMA drug databases, to confirm approvals, label changes, and route of administration details that can shift demand.
We then anchor demand signals and pricing context using sources such as OECD health statistics, the World Bank health expenditure series, WHO health data, and trade and customs publications where relevant for biologics movements. Company filings and investor presentations help us map revenue mix, launch timing, and geographic exposure, and these are cross-checked with reputable press and association websites. Where needed, paid subscriptions supporting company financials and a patent database are used to speed up verification of product line ownership and lifecycle events. The desk sources listed here are illustrative, and we also used other public documents for data collection, validation, and clarification.
Primary Interviews and Surveys
Primary inputs come from interviews and short surveys with people who see demand and pricing decisions directly, such as commercial leaders, medical affairs, formulary and market access experts, and specialty channel stakeholders. We also recheck assumptions by region (APAC, EMEA, and the Americas) so the uptake curve, dosing pattern shifts, and launch sequencing are not treated as identical everywhere.
Distribution of primary research fieldwork respondents
| Company type | Respondent position | Region |
|---|---|---|
| Top tier: 29% | CXOs: 13% | APAC: 50% |
| Mid tier: 55% | Functional/Unit leaders: 30% | EMEA: 30% |
| Smaller Players: 16% | Managers: 57% | Americas: 20% |
Market-Sizing & Forecasting
Sizing is built using a top-down and bottom-up mix, starting with a top-down demand pool reconstructed from therapy adoption and the addressable treated population for relevant indications, then filtering through eligibility for improved biologic formats and realistic launch timing. Once the demand pool is formed, value is derived using region level price assumptions and utilization factors that reflect route of administration and dosing cadence.
To keep the model tied to observed market behavior, we corroborate totals with selective bottom-up checks, such as product level revenue attribution from public disclosures, sampled price per treatment course multiplied by estimated patient volumes, and channel checks across hospital and specialty pharmacy flows. A few practical inputs that move the outputs include approval and label expansion timelines, switching rates from the reference biologic, average dose and frequency changes, regional reimbursement access, and observed price progression after launch. Forecasts lean on scenario analysis supported by expert consensus, so upside and downside cases reflect how fast new launches scale and how payer policies tighten or loosen. When a product or region has weak disclosure, gap handling is done using peer product analogs and conservative ramp curves, then revisited during follow-up calls.
Data Validation & Update Cycle
Validation is done through several passes, starting with cross-checks between modeled sales and independent signals like approval dates, major label changes, and reported revenue direction in public updates. Outliers are flagged early, and assumptions are reopened if a single variable (such as uptake speed or dosing frequency) drives an unrealistic jump.
Before sign-off, the work is reviewed step by step by another analyst so unit logic, currency handling, and regional rollups match the stated scope. Reports are refreshed annually, and interim updates are made when material events occur, such as major approvals, safety related label actions, or meaningful policy shifts. Right before delivery, we run a final pass so clients receive the latest updated view that matches the stated base year and forecast period.
Mordor Intelligence's Biobetters Market Size Compared With Other Published Estimates
Published market sizes for biobetters can differ even when the topic name looks identical, because the counted products, the year selected as the "current" number, and the way pricing and uptake are treated are not always aligned. Differences also come from whether estimates are tied to approved, commercial products or if adjacent biologics categories are blended in to simplify reporting.
A common gap driver is scope expansion, where some published figures bundle biosimilars, next generation biologics, or even broader biologics revenue into one total to show a larger pool. Another driver is how price is handled over time, since some models assume flat pricing while others assume a steady decline, and those choices materially change a 5 year forecast when launch ramps are still underway.
Benchmark comparison
| Source | Market Size | Gaps in Research Methodology |
|---|---|---|
| Mordor Intelligence | USD 67.07 B (2026) | |
| Global Consultancy A | USD 75.40 B (2026) | This estimate appears to use a broader biologics related scope that can fold in adjacent improved biologics and biosimilar revenues, which increases the total even if launch timing assumptions are similar. |
| Trade Journal B | USD 58.20 B (2026) | This estimate likely restricts the count to a smaller set of high visibility products and applies more conservative uptake and price progression assumptions, which can understate newer launches and emerging region demand. |
The table shows that the spread mostly comes from what gets bundled into the definition and how quickly value is allowed to build after launch, rather than from one single forecast math choice. Some estimates fold in adjacent biologics classes to smooth the reporting, then Mordor Intelligence counts only commercially launched biobetters that show clinically meaningful improvement over an approved reference biologic, which keeps the total traceable to approvals, indication demand, and realistic pricing steps.


Key Questions Answered in the Report
What is the current value and expected growth of the biobetters market?
The biobetters market stands at USD 67.07 billion in 2026 and is forecast to reach USD 97.91 billion by 2031, advancing at an 7.86% CAGR.
Which drug class holds the largest share of the biobetters market?
Insulin leads the drug-class landscape with 45.62% share thanks to its critical role in diabetes care and the technical complexity that favors differentiated products.
Why are monoclonal antibodies the fastest-growing segment?
Breakthrough antibody-drug conjugate technologies and site-specific protein engineering are lifting monoclonal antibodies at a 9.93% CAGR by improving tumor targeting and safety profiles.
Which region is expanding the quickest and what drives its momentum?
Asia-Pacific is growing at a 9.31% CAGR, fueled by regulatory modernization, new biomanufacturing capacity, and rising healthcare spending in China, Japan, and South Korea.
What is the primary commercial hurdle for biobetter developers in mature markets?
Intensifying price competition from biosimilars forces biobetter sponsors to prove clear clinical advantages that justify premium pricing within payer negotiations.
Page last updated on:


 Your data is secure and never sold or shared.


