
Life Science Reagents Market Size and Share
Market Overview
| Study Period | 2020 - 2031 |
|---|---|
| Market Size (2026) | USD 73.05 Billion |
| Market Size (2031) | USD 99.07 Billion |
| Growth Rate (2026 - 2031) | 6.28 % |
| Fastest Growing Market | Asia Pacific |
| Largest Market | North America |
| Market Concentration | Medium |
Major Players
*Disclaimer: Major Players sorted in no particular order Image © Mordor Intelligence. Reuse requires attribution under CC BY 4.0. |
|
Life Science Reagents Market Analysis by Mordor Intelligence
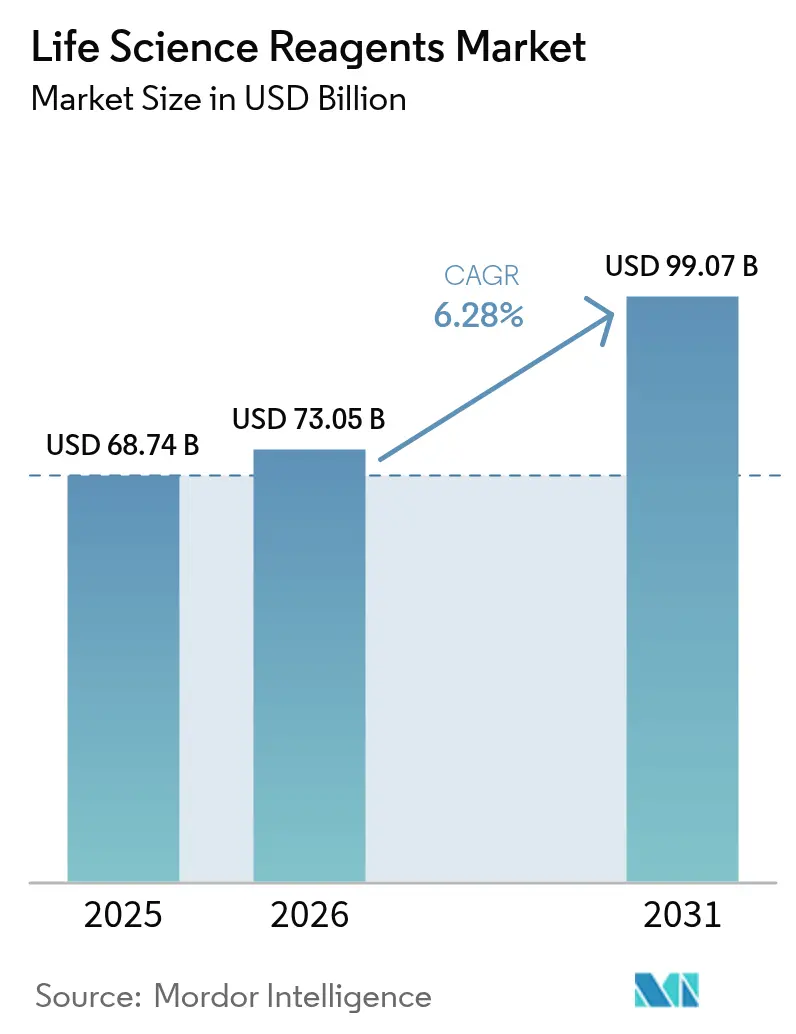
The life science reagents market size was valued at USD 68.74 billion in 2025 and estimated to grow from USD 73.05 billion in 2026 to reach USD 99.07 billion by 2031, at a CAGR of 6.28% during the forecast period (2026-2031). Robust uptakes in precision diagnostics, single-cell multiomics and automated laboratory workflows keep demand buoyant even as regulators tighten quality requirements. Hospital laboratories continue to place the largest orders, but pharmaceutical and biotechnology companies are expanding in-house usage as biologics pipelines become more complex. Rapid adoption of AI-guided reagent selection, growing investment in sustainable animal-free formulations and the reshoring of manufacturing capacity collectively protect the growth outlook against lingering supply-chain risks. Emerging disruptors are turning decentralised microfluidic cartridge production into a viable alternative to bulk supply, creating new price and service models that favour agile suppliers with digital logistics [1]U.S. Food & Drug Administration, “Emergency Use Authorizations for Medical Devices,” fda.gov.
Key Report Takeaways
- By product category, cell and tissue culture reagents held 29.68% of the life science reagents market share in 2025, while molecular diagnostic reagents are projected to clock the fastest 7.05% CAGR through 2031.
- By end user, hospitals and diagnostic laboratories accounted for 54.05% of the life science reagents market size in 2025, whereas pharmaceutical and biotechnology companies are set to expand at a 7.12% CAGR to 2031.
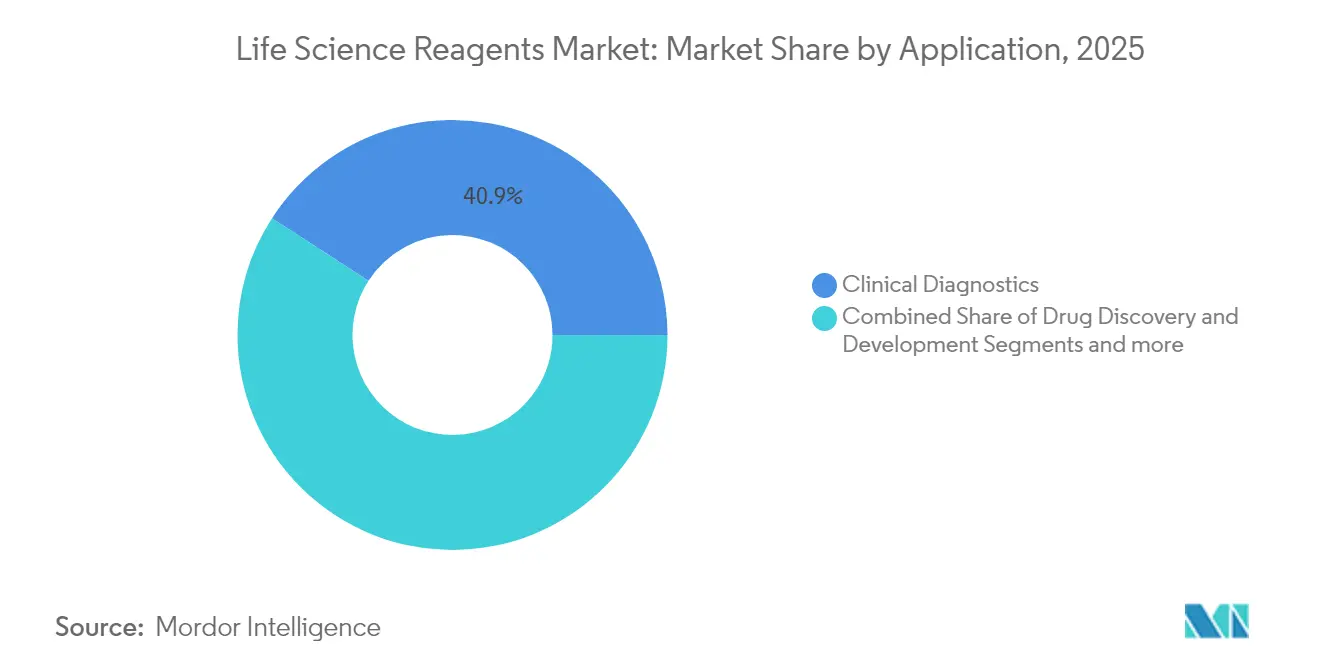
- By application, clinical diagnostics captured 40.86% revenue share in 2025; precision and personalised medicine will post the briskest 7.18% CAGR during 2026-2031.
- By form, liquid formulations commanded 47.35% of the life science reagents market share in 2025, but lyophilised products are forecast to rise at a 7.02% CAGR through 2031.
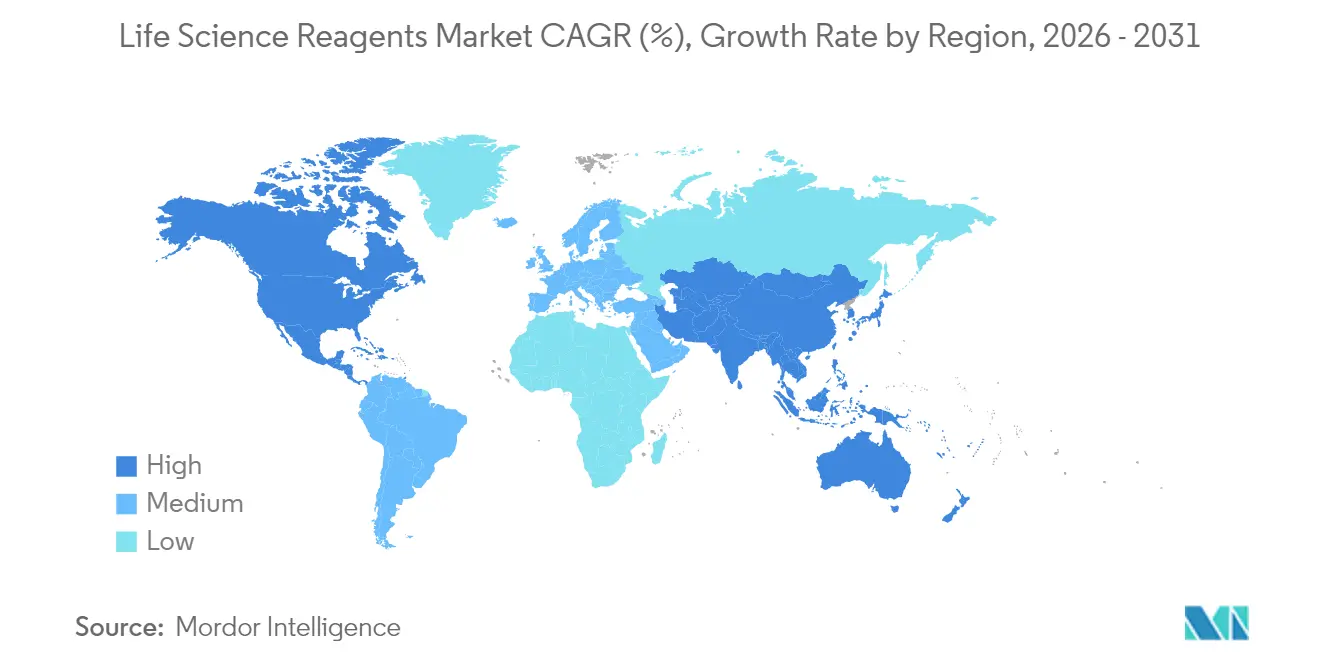
- By geography, North America led with 38.74% of the life science reagents market size in 2025, while Asia-Pacific is advancing at a 7.29% CAGR to 2031.
Note: Market size and forecast figures in this report are generated using Mordor Intelligence’s proprietary estimation framework, updated with the latest available data and insights as of 2026.
Market Trends and Insights
Drivers Impact Analysis of Life Science Reagents Market*
| Driver | (~) % Impact on CAGR Forecast | Geographic Relevance | Impact Timeline |
|---|---|---|---|
| High burden of infectious diseases | +1.2% | Global – strongest in APAC and MEA | Medium term (2-4 years) |
| Technological advancements in genomics & proteomics | +1.8% | North America & EU in lead; APAC catching up | Long term (≥ 4 years) |
| Rising R&D funding & public-private partnerships | +1.1% | North America and China | Medium term (2-4 years) |
| Growing demand for precision diagnostics & personalised medicine | +1.5% | Early adoption in developed markets | Long term (≥ 4 years) |
| AI-enabled reagent e-commerce & on-demand synthesis | +0.7% | North America & EU first movers; APAC scaling | Short term (≤ 2 years) |
| Microfluidic cartridge-based decentralised manufacturing | +0.3% | Technology hubs worldwide | Long term (≥ 4 years) |
| Source: Mordor Intelligence | |||
High Burden of Infectious Diseases
Global outbreaks keep molecular and immunoassay reagent volumes elevated. The FDA’s flexible emergency-use guidance accelerates market entry for validated rapid-response kits, giving an edge to suppliers with ready-to-scale production platforms [2]Federal Register, "Validation of Certain In Vitro Diagnostic Devices for Emerging Pathogens During a Section 564 Declared Emergency; Draft Guidance for Industry and Food and Drug Administration Staff; Availability," federalregister.gov. Uptake of point-of-care systems in resource-limited regions is widening access, yet logistics and pricing hurdles persist. Manufacturers able to bundle reagents with compact detection devices gain share by simplifying field deployment. Continuing antimicrobial-resistance surveillance furthers demand for high-throughput PCR mastermixes and selective culture media suited to novel pathogen detection.
Technological Advancements in Genomics & Proteomics
Single-cell sequencing and spatial proteomics are setting new reagent performance benchmarks. Illumina’s acquisition of Fluent BioSciences underscores strategic bets on scalable multiomics workflows, pushing suppliers to deliver ultra-low-input enzymes with consistent lot-to-lot kinetics [3]Illumina Inc., “Illumina to Acquire Fluent BioSciences,” illumina.com. Automation-ready buffer systems that integrate with self-driving labs have shortened R&D cycles by more than 500 days, cutting reagent wastage and elevating premium SKUs. Vendors able to co-develop kits with instrument makers enjoy preferred-supplier status in expanding install bases.
Rising R&D Funding & Public-Private Partnerships
Record corporate and government outlays keep laboratories flush with procurement budgets. Roche’s USD 50 billion commitment to U.S. operations signals long-term reagent consumption across discovery, QC and companion-diagnostic pipelines. Academia–industry schemes such as UCSF’s Catalyst Program with MilliporeSigma align early-stage innovation with commercial manufacturability, generating next-generation antibody, media and nanoparticle reagents that transition smoothly from bench to GMP batches. Local manufacturing grants in the United States and China further spur reagent capacity additions that mitigate import bottlenecks.
Growing Demand for Precision Diagnostics & Personalised Medicine
Liquid biopsy assays like SPOT-MAS that reach 70.83% sensitivity across multiple cancers rely on ultrasensitive reagents able to recover fragmented circulating DNA from minute blood volumes. AI models require datasets generated with highly consistent chemistries; suppliers offering rigorously validated panels see repeat orders from algorithm developers. Expansion of pharmacogenomics into mainstream care is stimulating multiplexed reagent kits optimized for degraded FFPE specimens and small saliva samples, opening recurring revenue in hospital labs adopting personalised therapeutics protocols.
Restraints Impact Analysis of Life Science Reagents Market*
| Restraint | (~) % Impact on CAGR Forecast | Geographic Relevance | Impact Timeline |
|---|---|---|---|
| High cost & pricing pressure of specialty reagents | -0.8% | Emerging markets most exposed | Medium term (2-4 years) |
| Stringent multi-regional regulatory compliance | -0.6% | Complexity peaks in US and EU | Long term (≥ 4 years) |
| Upstream supply-chain volatility for critical enzymes & buffers | -0.5% | Reliant on Asian suppliers | Short term (≤ 2 years) |
| Sustainability push toward PFAS-free formulations | -0.4% | EU and North America spearhead reforms | Medium term (2-4 years) |
| Source: Mordor Intelligence | |||
High Cost & Pricing Pressure of Specialty Reagents
GMP-grade CRISPR components can cost 5-10 times their research-use equivalents, constraining adoption in budget-limited biotechs. Casgevy therapy’s USD 2.2 million price tag demonstrates how reagent expenses cascade into final treatment costs. Lotus-to-plateau pricing dynamics encourage bulk purchasing, but consolidation among enzyme and antibody vendors narrows bargaining power for smaller buyers. Emerging plant-based cell-culture supplements that replace 90% of human platelet lysate hint at cost-relief pathways yet need broader validation.
Stringent Multi-Regional Regulatory Compliance
The FDA’s forthcoming QMSR rule synchronises with ISO 13485:2016, compelling companies to overhaul documentation and software by 2026. Additional Laboratory-Developed-Test regulations through 2027 impose fresh verification steps for reagents used in clinical labs, particularly those incorporating animal-derived raw materials. Smaller manufacturers lacking dedicated regulatory teams face slower time-to-market and higher overhead, potentially accelerating industry consolidation around better-capitalised players.
*Our forecasts treat driver/restraint impacts as directional, not additive. The impact forecasts reflect baseline growth, mix effects, and variable interactions.
Life Science Reagents Market Segment Analysis
By Product Type:
Cell Culture Dominance Drives InnovationCell and tissue culture reagents retained 29.68% of the life science reagents market share in 2025, a lead anchored in their indispensability to biomanufacturing workflows. The segment benefits from continuous upgrades toward chemically defined, xeno-free media that curb variability and immunogenicity. Companies such as Rohto Pharmaceutical are advancing serum-free stem-cell media that minimise product-to-product drift, commanding premium list prices in regenerative-medicine pipelines. Chromatography reagents post steady revenue underpinned by antibody purification demand, while clinical chemistry panels gain volume through laboratory automation. Molecular diagnostic reagents, projecting a 7.05% CAGR, outpace peers as liquid biopsy, NGS library prep, and microRNA detection protocols scale.
The molecular diagnostics surge illustrates how precision oncology elevates reagent complexity. Declining sequencing costs unlock smaller hospitals and reference labs as new customers. Coupled enzyme mixes for single-tube library construction slash hands-on time and shrink error rates, amplifying brand differentiation. Emerging CRISPR, microbiome and spatial biology kits populate the “other product types” bracket, showcasing how rapid R&D outpaces traditional catalog structures in the life science reagents industry.




By End User:
Pharma Sector Accelerates AdoptionWhile hospitals and diagnostic laboratories consumed 54.05% of the life science reagents market size in 2025, pharmaceutical and biotechnology companies will register the fastest 7.12% CAGR over 2026-2031. Intensifying biologics pipelines spur firms to internalise previously outsourced analytics, driving purchases of high-purity growth factors, resin sets and companion-diagnostic kits. AbbVie’s USD 217.74 billion R&D allocation underscores how upstream reagent commitments parallel therapeutic ambitions. Automation-heavy hospital labs favour integrated reagent-instrument bundles that consolidate procurement and quality monitoring.
Academic institutes remain reliable customers backed by national grants. NIH’s yearly USD 41 billion spend maintains baseline demand for discovery-grade primers, antibodies and reporter dyes, ensuring catalogue breadth retention. Contract research organisations within the “others” cohort widen addressable volumes by requesting flexible lot sizes and fast lead times, rewarding distributors with agile stocking algorithms.
By Application:
Precision Medicine Transforms DiagnosticsClinical diagnostics accounted for 40.86% of 2025 revenue, but precision and personalised medicine reagents are forecast to advance at a 7.18% CAGR to 2031. Liquid biopsy-compatible enzymes, cfDNA stabilisers and high-fidelity polymerases headline growth as oncologists pivot to minimally invasive monitoring. Drug discovery remains a material buyer of cell-based assay kits and high-throughput screening buffers, with Regeneron’s capacity-doubling alliance with FUJIFILM Diosynth translating into bulk media contracts. Forensic laboratories sustain a niche yet technology-demanding market that gravitates toward rapid DNA extraction cartridges to meet courtroom turnaround benchmarks.
The life science reagents market size attached to pharmacogenomics panels is poised to expand as clinical guidelines incorporate genotype-guided prescribing. Multiplex PCR reagents with built-in internal controls safeguard result integrity in routine hospital settings. Simultaneously, environmental and food-safety sub-segments under “others” adopt next-generation lateral-flow formats, blending immunochemistry with nanomaterial labels for on-site quantification.
By Form:
Liquid Reagents Maintain DominanceLiquid formulations captured 47.35% of the 2025 life science reagents market share, valued for plug-and-play convenience in automated analysers. Nonetheless, lyophilised alternatives will exhibit a 7.02% CAGR driven by supply-chain resilience and ambient-temperature stability. New freeze-drying protocols preserve enzyme activity in complex cocktails, enabling kit shelf lives beyond 24 months. Pilot programmes demonstrate 50% freight-cost savings when liquid kits convert to lyophilised formats.
Solid-phase beads, encapsulated nanoparticles, and paper-based reaction zones inhabit the “others” segment, suiting microfluidic and wearable-sensor applications. Start-ups commercialising drop-in dry-room solutions for cartridge integration point to future fragmentation within the life science reagents industry as use cases diversify.
Geography Analysis
North America Life Science Reagents Market
North America led the life science reagents market size with a 38.74% share in 2025, fuelled by a dense cluster of pharma majors, top-tier research universities and venture-backed start-ups. Substantial Series C rounds, exemplified by ElevateBio’s USD 1.3 billion raise, maintain reagent throughput in cell-therapy suites even amid macroeconomic fluctuations. Regulatory predictability under the FDA and strong IP enforcement keep multinational suppliers anchoring bulk production here.
APAC Life Science Reagents Market
Asia-Pacific is the fastest mover, expanding at a 7.29% CAGR on the back of national biotech blueprints in China, Japan and South Korea. Generous tax credits and park-level infrastructure attract contract development-and-manufacturing organisations that source large-volume media and purification resins locally. Harmonisation with ICH guidelines eases export of region-made reagents to Western clients, closing historical quality-perception gaps.
Europe Life Science Reagents Market
Europe sustains mid-single-digit growth as Horizon Europe grants channel funds into advanced omics and green-chemistry reagent research. However, incremental compliance layers under the In Vitro Diagnostic Regulation stretch smaller laboratory budgets, nudging purchasing decisions toward dual-certified products that satisfy CE and FDA expectations simultaneously.
MEA and LATAM Life Science Reagents Market
Middle East & Africa register rising orders as governments equip new clinical genomics centres, while Latin America benefits from Brazil’s biosimilar expansion that raises demand for GMP-grade media and chromatography solutions. Across emerging regions, lyophilised kits capable of withstanding temperature excursions gain traction, underlining format diversification trends in the life science reagents market.

Regulatory Landscape
Life science reagents that function as in vitro diagnostics (IVDs) are governed through risk-based frameworks that increasingly link reagent chemistry, labeling, and manufacturing controls to clinical claims. In the United States, the FDA regulates IVDs under the FD&C Act and classifies products under 21 CFR Parts 862-892 based on intended use and risk. A May 2026 Federal Register final amendment (Docket No. FDA-2026-N-4644) classified devices used to preserve and stabilize microbial nucleic acids in clinical samples as Class II with special controls, raising the bar for validation and documentation in specimen-related reagent workflows. Separately, the FDA’s May 2024 final rule to phase out enforcement discretion for laboratory developed tests over a four-year period increases verification and quality-system expectations for reagents used in clinical laboratory settings, particularly for suppliers selling RUO-to-clinical transition kits.
In Europe, IVD reagents fall under the In Vitro Diagnostic Medical Devices Regulation (IVDR, Regulation (EU) 2017/746), which continues to raise the level of conformity assessment demand, technical documentation depth, and post-market obligations. In May 2026, Commission Implementing Regulation (EU) 2026/977 introduced more uniform procedural and quality management requirements for Notified Body conformity assessments under MDR and IVDR, tightening operational scrutiny across audits and technical file reviews. Updated MDCG guidance in 2026 further supports classification and borderline determinations, emphasizing the need for precise intended-use claims, consistent EMDN coding, and defensible performance evidence across multi-country commercialization.
Value Chain Analysis
The life science reagents value chain starts with upstream sourcing of critical raw materials and biologic inputs (enzymes, antibodies, recombinant proteins, buffers, resins, specialty chemicals, and packaging consumables), then moves through formulation, filling and lyophilization, QC release testing, and documentation to support RUO, clinical, and GMP use cases. Scale suppliers, including Thermo Fisher Scientific and Merck KGaA, as well as Danaher-aligned platforms, run multi-site manufacturing networks, while specialized producers focus on niche assays and custom GMP-grade lots where lead times can extend beyond standard catalog supply due to release testing and change-control requirements. Cold-chain and stability management, lot-to-lot consistency, and traceability remain key constraints, especially for clinical diagnostics and cell and gene therapy-grade reagents.
Downstream, distributors and logistics providers handle thousands of SKUs and deliver regional stocking, temperature-controlled transport, and technical support through multi-year agreements. TriLink BioTechnologies partnered with Avantor in February 2025 to broaden distribution of nucleic acid solutions across EMEA. Rapid Micro Biosystems signed a five-year global distribution and collaboration agreement with Merck KGaA’s Life Science business in February 2025, linking systems and consumables placement to ongoing reagent pull-through. The channel continues to split between high-velocity commodity reagents, where private label and price competition are prominent, and regulated or GMP-grade reagents, where service, documentation, and supply assurance differentiate providers. This structure encourages dual sourcing, regionalized stocking, and tighter manufacturer-distributor coordination to limit stockouts and compliance exposure.
Competitive Landscape
The life science reagents market remains moderately fragmented. In antibodies, the largest supplier controls close to 5% revenue, indicating ample room for niche innovators. Protein reagents show tighter clustering among a handful of global vendors leveraging scale to bundle consumables with instruments and analytics services. Pricing pressure persists in commodity buffers, leading to private-label expansion by large distributors.
Strategic acquisitions dominate growth agendas. Thermo Fisher’s USD 4.1 billion purchase of Solventum’s purification unit extends its upstream bioprocess footprint, while its disclosed USD 40-50 billion M&A war-chest signals further roll-ups. Becton Dickinson’s planned USD 17.5 billion merger with Waters will merge diagnostics with separations technology, creating cross-selling potential from clinical labs to biopharma pilot plants. Partnerships such as Bio-Techne’s alliance with USP align reagent developers with standards bodies, bolstering credibility in QC-intensive biologics production.
Technology leadership centres on automation-ready, digitally tracked reagent lines. Cloud-based inventory portals tie back to production MES data, helping clients forecast demand and ensure audit compliance. Suppliers offering validated AI-optimised chemistries report lower churn. Barriers to entry rise as the FDA finalises Q2(R2) analytical-procedure expectations, favouring incumbents with deep validation portfolios.
Life Science Reagents Industry Leaders
-
F. Hoffmann-La Roche Ltd
-
Becton, Dickinson and Company
-
BioMerieux SA
-
Thermo Fisher Scientific, Inc
-
Abbott Laboratories
- *Disclaimer: Major Players sorted in no particular order

Life Science Reagents Market Companies Covered in this Report
- Roche
- Thermo Fisher Scientific
- Beckton Dickinson
- Abbott Laboratories
- bioMérieux
- Merck
- Danaher
- Siemens Healthineers
- DiaSorin
- Sysmex
- Bio-Rad Laboratories
- Promega
- Agilent Technologies
- QIAGEN
- Illumina
- New England Biolabs
- PerkinElmer
- Lonza Group
- Genscript
- Takara Bio
- Waters Corporation
- Bruker
- Corning
- Charles River

Market Opportunities and Future Outlook
Opportunities cluster where compliance requirements, biologics complexity, and sustainability goals overlap, which tends to favor higher-specification and better-documented reagent inputs. USP’s June 2026 publication of product-specific emerging biologics standards for public comment, covering methods for molecules such as epoetin, interferon beta 1a, rituximab, and bevacizumab, supports the use of reference methods and standard-aligned testing. That direction creates room for suppliers that bundle reagents with validated assays and documentation packages for QC-intensive users. At the same time, animal-free and traceability-friendly components are moving from preference to procurement criteria across multiple workflows. Proliant Health & Biologicals launched AlbufreeDX in June 2026, a recombinant human albumin positioned for diagnostic and life science applications, signaling practical movement toward animal-free ingredients that can reduce variability and sourcing constraints.
Whitespace also opens as manufacturing and service networks expand for scale-up, tech transfer, and multi-site quality consistency. Thermo Fisher Scientific announced a USD 1 billion 2026 investment plan across its global CDMO network (60 sites), reinforcing integrated supply models where development, analytical workflows, and consumable pull-through are managed alongside bioprocess services. On regulated-materials use, ACROBiosystems reported PMDA material suitability confirmation for its GMP-grade IL-15 in July 2026, underscoring how third-party confirmations and region-specific documentation can speed biopharma adoption of GMP-grade reagents and de-risk filings. Taken together, these signals point to advantage for platforms that combine robust QMS, standardized validation, and regional availability across clinical diagnostics, cell and gene therapy, and biologics QC workflows.
Recent Industry Developments in Life Science Reagents Market
- July 2026: Roche introduced the cobas Hepatitis D Virus (HDV) test, a fully automated assay designed for the cobas 5800/6800/8800 systems. The launch expands automated infectious-disease testing menus that rely on tightly controlled reagent packs, supporting higher throughput and standardization in clinical laboratories.
- July 2025: BD Biosciences and Diagnostic Solutions and Waters announced a USD 17.5 billion merger to form an integrated life-sciences platform spanning reagents, diagnostics, and analytical instruments. The combination strengthens cross-selling between separations workflows and diagnostic testing, with procurement leverage for bundled consumables and service agreements.
- September 2024: FUJIFILM Irvine Scientific broadened its life-sciences offering by integrating laboratory chemicals and diagnostics from FUJIFILM Wako Chemicals. This extended the supplier’s end-to-end portfolio for cell culture and laboratory workflows, supporting customers that prefer consolidated sourcing and harmonized quality documentation across reagent categories.


Life Science Reagents Market Report Scope and Research Methodology
Market Definition and Coverage
For this study, the life science reagents market covers the recurring, consumable chemical and biological inputs used to run life science workflows, from sample preparation and cell work to assays and analytical readouts, across research and applied laboratory settings.
Scope exclusions: Capital instruments, general lab equipment, and routine non-reagent consumables (such as standard plastics) are excluded unless they are bundled and priced as a reagent kit.
Segments Covered in This Report
-
By Product Type
- Cell and Tissue Culture Reagents
- Chromatography Reagents
- Clinical Chemistry Reagents
- Immunoassay Reagents
- Molecular Diagnostic Reagents
- Microbiology Reagents
- Proteomics and Protein Analysis Reagents
- Next-Generation Sequencing (NGS) Reagents
- Other Product Types
-
By End User
- Hospitals and Diagnostic Laboratories
- Academic and Research Institutes
- Pharmaceutical and Biotechnology Companies
- Others
-
By Application
- Clinical Diagnostics
- Drug Discovery and Development
- Precision and Personalized Medicine
- Forensic and Security Testing
- Others
-
By Form
- Liquid Reagents
- Lyophilized Reagents
- Others
-
By Geography
-
North America
- United States
- Canada
- Mexico
-
Europe
- Germany
- United Kingdom
- France
- Italy
- Spain
- Rest of Europe
-
Asia-Pacific
- China
- Japan
- India
- Australia
- South Korea
- Rest of Asia-Pacific
-
Middle East and Africa
- GCC
- South Africa
- Rest of Middle East and Africa
-
South America
- Brazil
- Argentina
- Rest of South America
-
North America
Data Sources, Market Sizing, and Validation
Desk Research
Desk work started by mapping how reagents are produced, sold, and consumed, so the same revenue is not counted twice across manufacturer and distributor layers. We used public references such as NIH and NSF funding releases, CDC laboratory testing guidance, FDA databases for regulated diagnostics context, and OECD and World Bank macro indicators to anchor demand direction.
To keep assumptions practical, we also reviewed sources such as customs and trade statistics for chemical and biological materials, peer-reviewed articles that describe reagent usage intensity in common protocols, and supplier annual reports and investor presentations for category mix and pricing commentary. Where needed, paid company financials and news were used to sanity check growth steps and major event timing, and a paid patent database was used only to understand where new assay formats could change reagent mix. These desk sources are illustrative, and additional public references were used for data collection, validation, and clarification.
Primary Interviews and Surveys
Primary work was used to confirm what gets counted as a reagent sale, how kit bundling is treated, and how prices move by grade and application over the year. Interviews covered manufacturers, distributors, lab procurement teams, and end users, so gaps from desk inputs could be closed. Assumptions were then rechecked across APAC, EMEA, and the Americas to avoid over-weighting any single region.
Distribution of primary research fieldwork respondents
| Company type | Respondent position | Region |
|---|---|---|
| Top tier: 38% | CXOs: 12% | APAC: 39% |
| Mid tier: 47% | Functional/Unit leaders: 38% | EMEA: 37% |
| Smaller Players: 15% | Managers: 50% | Americas: 24% |
Market-Sizing & Forecasting
Sizing was built using a top-down demand pool approach, where life science activity signals were reconstructed into reagent consumption and then translated into value using observed price bands. The model was then checked with selective bottom-up approximations, including sampled kit volumes and price points from major channels, plus supplier roll-ups for a few high-visibility reagent families. This helped adjust totals where overlap or undercount was spotted.
Inputs that were tracked include research and clinical testing intensity, funding cycles that influence lab throughput, mix shifts toward kits versus standalone reagents, cold chain and specialty logistics constraints for sensitive reagents, and average selling price movement by grade and package size. When a data point was thin for a smaller country, proxy indicators were used first, then corrected using regional shares validated in interviews so the gaps did not inflate growth.
For forecasting, we leaned on multivariate regression because demand tends to move with a set of drivers rather than a single trend line. The forward view was stress tested through scenario analysis around funding normalization, diagnostics testing levels, and pricing softness or firmness, and then the final path was aligned with what industry participants considered achievable.
Data Validation & Update Cycle
Numbers were checked through more than one lens, so the outputs align with real-world signals rather than a single data series. Variance checks were run across regions and product families, and outliers were investigated by revisiting underlying drivers like throughput, mix, and pricing.
Before sign-off, the model and assumptions go through an internal analyst review so calculation logic and definitions remain consistent across the report. The report is refreshed annually, and if a material event changes pricing, supply, or regulated testing demand, interim checks are triggered and the affected assumptions are revalidated. Right before delivery, a final pass is completed so clients receive the latest updated view.
Mordor Intelligence's Life Science Reagents Market Sizing Compared With Other Published Estimates
Published market sizes for life science reagents can look far apart even when the topic sounds the same, because the counting boundary is not uniform and pricing is not captured on the same timing. Some estimates emphasize factory gate revenues, while others follow downstream spending, and the difference grows when kits and specialty grades are bundled differently.
In practice, the spread usually comes from when currency is converted, how average selling prices step up year to year, and whether one-off volume spikes are treated as structural demand. A refresh-led build reduces these swings because assumptions are re-checked against the latest funding and lab activity signals, and price movement is validated through channel feedback before totals are finalized, which is how the 2026 figure is maintained in Mordor Intelligence.
Benchmark comparison
| Source | Market Size | Gaps in Research Methodology |
|---|---|---|
| Mordor Intelligence | USD 73.05 B (2026) | |
| Global Consultancy A | USD 66.32 B (2024) | Uses an earlier base year snapshot and can understate the later-year uplift if ASP progression and kit mix changes are not revalidated close to the sizing year. |
| Industry Publisher B | USD 56.16 B (2025) | Reported on a factory gate basis and can miss distributor and value-added channel markups, which pulls the total down versus an end-market revenue view. |
The comparison shows that timing and scope boundaries, not only growth expectations, explain most of the difference across published values. By tying the market total to observable activity drivers and then rechecking price and mix assumptions on an update cadence, the resulting size stays traceable to clear steps and can be repeated when new information arrives.


Key Questions Answered in the Report
What is the current value of the life science reagents market?
The market is valued at USD 73.05 billion in 2026.
How fast is the Asia-Pacific region growing in life-science reagents?
Asia-Pacific is forecast to expand at a 7.29% CAGR between 2026-2031.
Which product type holds the largest share in life-science reagent sales?
Cell and tissue culture reagents lead with a 29.68% share in 2025.
Why are lyophilised reagents gaining popularity?
They offer longer shelf life, lower shipping costs and eliminate cold-chain dependence.
Which end-user segment is expanding the quickest?
Pharmaceutical and biotechnology companies will grow reagent purchases at a 7.12% CAGR to 2031.
How will pending FDA regulations affect reagent suppliers?
Tighter QMS and LDT requirements increase compliance costs, favouring well-capitalised incumbents.
Page last updated on:


 Your data is secure and never sold or shared.


