Market Overview
| Study Period | 2020 - 2031 |
|---|---|
| Forecast Data Period | 2026 - 2031 |
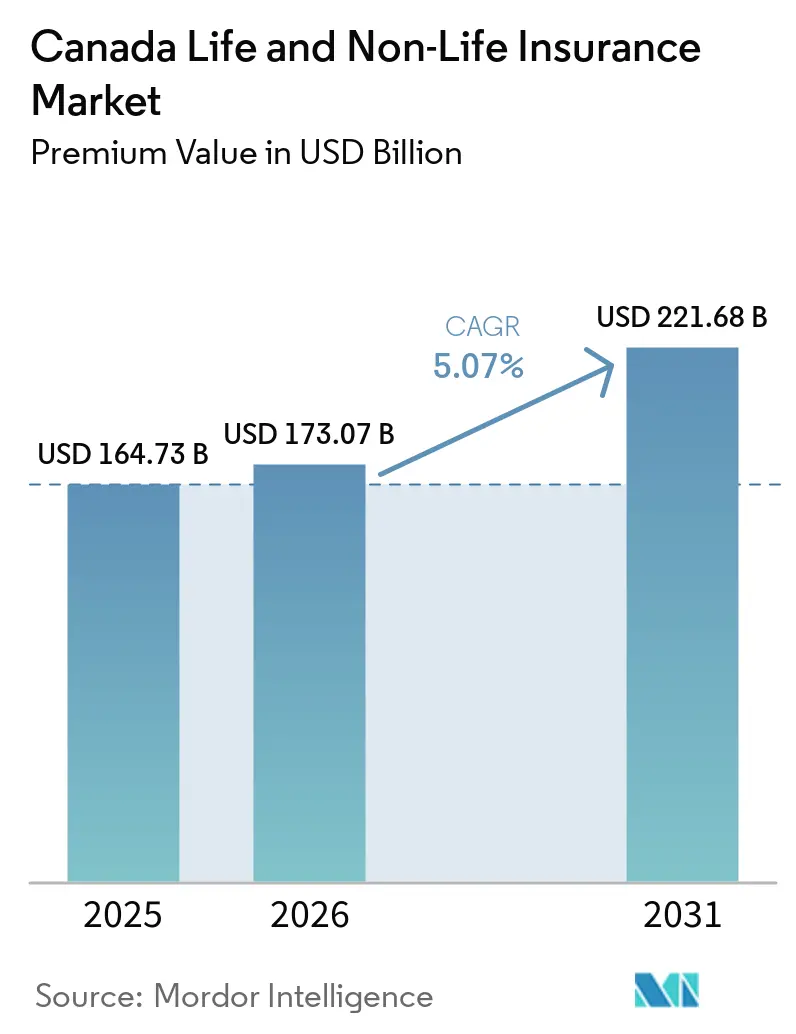
| Base Year Market Size (2025) | USD 164.73 Billion |
| Market Size (2026) | USD 173.07 Billion |
| Market Size (2031) | USD 221.68 Billion |
| Growth Rate (2026 - 2031) | 5.07% CAGR |
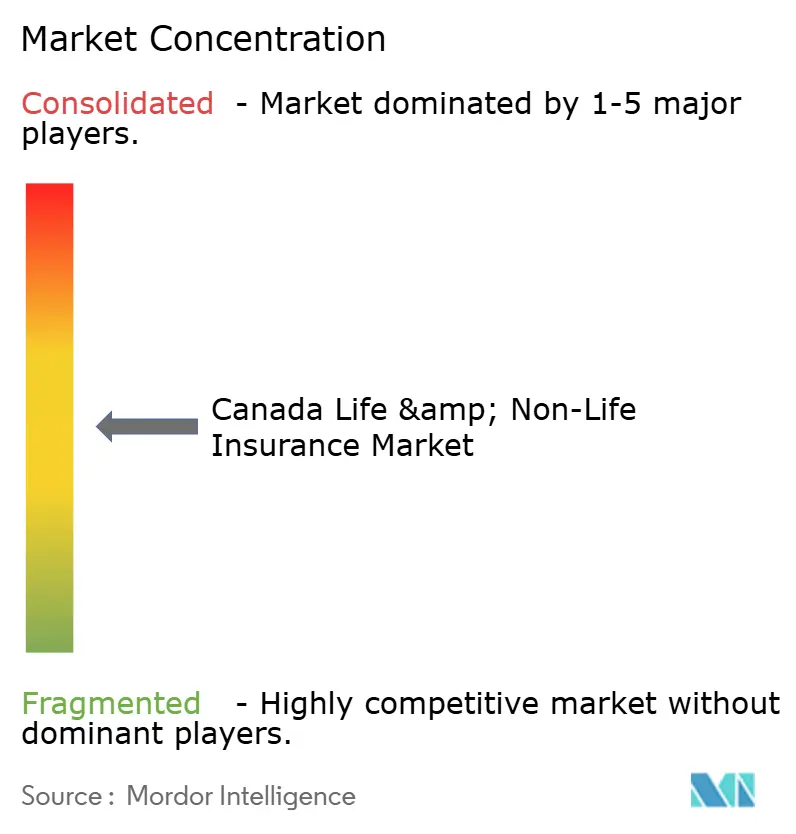
| Market Concentration | Medium |
Major Players *Disclaimer: Major Players sorted in no particular order Image © Mordor Intelligence. Reuse requires attribution under CC BY 4.0. | |
Canada Life and Non-Life Insurance Market Analysis by Mordor Intelligence
The Canada Life And Non-Life Insurance Market size in terms of premium value is projected to expand from USD 164.73 billion in 2025 and USD 173.07 billion in 2026 to USD 221.68 billion by 2031, registering a CAGR of 5.07% between 2026 to 2031.
This expansion is fueled by mandatory auto coverage, escalating climate-related property risks, and steady demand for creditor life protection, even as legacy low-interest blocks constrain life-insurer spreads. Digital distribution is reshaping acquisition economics, with direct online platforms accelerating while agents remain relevant for complex advisory needs. Well-capitalized incumbents leverage superior data analytics to underwrite volatile auto theft and catastrophe exposures, whereas smaller regional carriers face scale disadvantages under OSFI’s evolving LICAT requirements. Intensifying competition, heightened regulatory oversight, and rapid technology adoption together define the market’s near-term opportunity landscape[1]Office of the Superintendent of Financial Institutions, “LICAT 2025 Guideline Revision,” osfi-bsif.gc.ca..
Key Report Takeaways
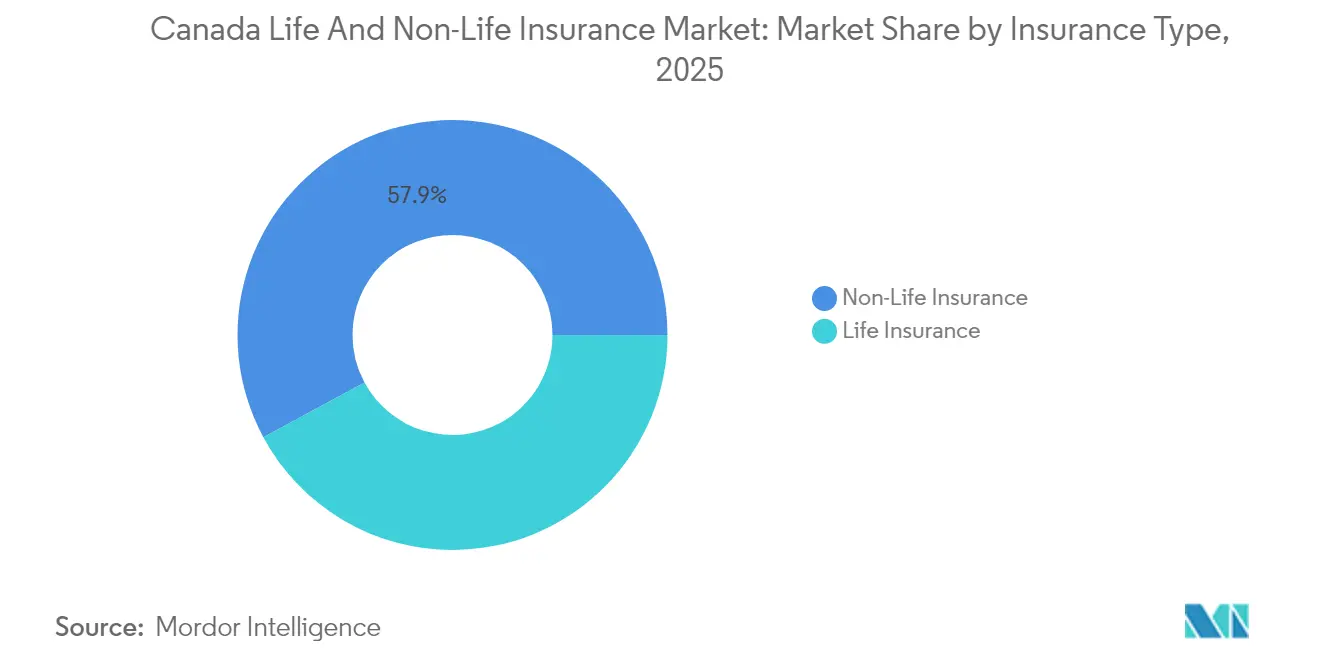
- By insurance type, non-life products captured 57.88% of the Canada insurance market share in 2025. Life coverage is forecast to expand to a 5.72% CAGR by 2031.
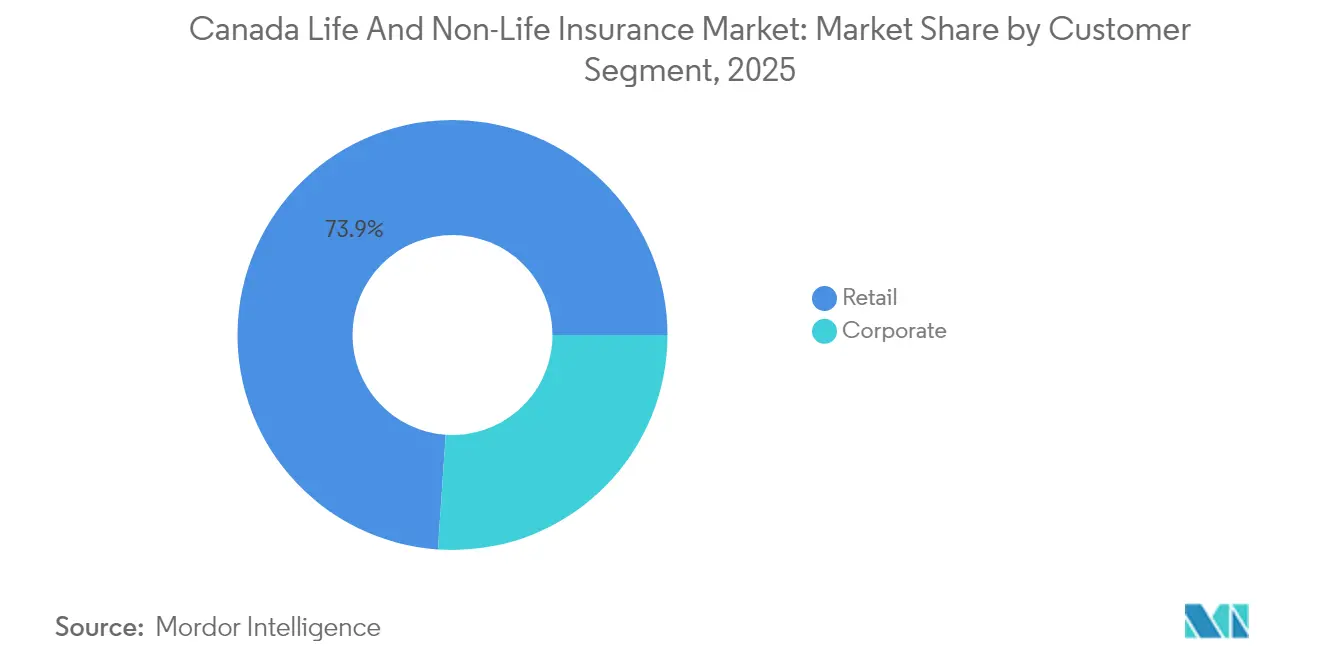
- By customer segment, retail policies accounted for 73.92% of the Canada insurance market size in 2025, while corporate purchases are advancing at a 5.45% CAGR to 2031.
- By distribution channel, agents held 32.11% of Canada's insurance market's total premiums in 2025; direct online sales are rising at a 6.05% CAGR through 2031.
Note: Market size and forecast figures in this report are generated using Mordor Intelligence’s proprietary estimation framework, updated with the latest available data and insights as of 2026.
Canada Life and Non-Life Insurance Market Trends and Insights
Drivers Impact Analysis*
| Driver | (~) % Impact on CAGR Forecast | Geographic Relevance | Impact Timeline |
|---|---|---|---|
| Digital-first product design & self-service claims platforms | +0.7% | National, urban concentration | Medium term (2-4 years) |
| Rising chronic-disease prevalence is boosting supplemental health cover | +1.1% | National, aging demographics focus | Long term (≥ 4 years) |
| Auto-telematics driving differentiated motor-insurance pricing | +0.5% | Provincial variation | Short term (≤ 2 years) |
| Mortgage growth sustaining creditor life policies | +0.4% | Urban housing markets | Medium term (2-4 years) |
| Climate-related catastrophe losses are prompting property insurance uptake | +1.3% | Western Canada high-risk zones | Medium term (2-4 years) |
| Embedded-insurance partnerships in Canadian e-commerce ecosystems | +0.3% | National digital commerce focus | Long term (≥ 4 years) |
| Source: Mordor Intelligence | |||
Digital-First Product Design & Self-Service Claims Platforms
Insurers are prioritizing web and mobile portals that let policyholders bind coverage, upload documents, and track claims in near real time. Automated workstreams cut processing times from weeks to days, especially in standardized auto and tenant lines. Continuous data captured from customer interactions feeds machine-learning models that refine underwriting rules and personalize offers. Operational savings from straight-through processing are redeployed into cybersecurity and user-experience upgrades that boost retention. Regulators encourage these innovations as long as privacy safeguards and fair-access requirements remain intact.
Rising Chronic-Disease Prevalence Boosting Supplemental Health Cover
An aging population and higher incidence of diabetes, cardiovascular illness, and mental-health disorders widen gaps in provincial health benefits. Employers increasingly fund supplemental plans covering prescription drugs and psychological services to attract and retain talent. Individual Canadians purchase top-ups to protect against out-of-pocket costs that strain household finances. Insurers embed wellness apps and remote-monitoring tools that incentivize preventive behaviors and help control long-term claims. Favorable tax treatment for health spending accounts further catalyzes adoption [2]Statistics Canada, “Chronic Disease Table 2025,” statcan.gc.ca..
Auto-Telematics Driving Differentiated Motor-Insurance Pricing
Connected-car devices track kilometers driven, acceleration, and braking to reward safe motorists with lower premiums and flag high-risk behaviors in real time. Usage-based programs are expanding as automakers integrate factory-installed telematics units. Provincial regulators allow data-driven rating, provided privacy rules are observed, accelerating product rollout. In parallel, geo-fencing alerts and immobilizers help curb organized auto-theft rings that cost insurers USD 1.07 billion (CAD 1.55 billion) in 2023. More accurate risk segmentation improves combined ratios despite repair-cost inflation.
Mortgage Growth Sustaining Creditor Life Policies
Persistent housing-demand pressure keeps mortgage originations high even amid interest-rate volatility. Federally backed mortgage-default rules require protection on loans above 80% loan-to-value, sustaining a steady pipeline for creditor life cover. Longer amortization schedules enlarge outstanding balances, raising policy face values and strengthening premium flows. Banks bundle life and disability protection at the point of sale, capturing convenience-driven uptake on digital mortgage portals. Insurers refine underwriting to reflect employment stability and debt-service ratios rather than solely age and sum-insured criteria.
Restraints Impact Analysis*
| Restraint | (~) % Impact on CAGR Forecast | Geographic Relevance | Impact Timeline |
|---|---|---|---|
| Persistent low-interest-rate legacy blocks are pressuring life insurer spreads | -0.8% | National | Long term (≥ 4 years) |
| Heightened regulatory capital (LICAT) requirements | -0.6% | National | Medium term (2-4 years) |
| Rising auto-repair inflation is squeezing underwriting margins | -1.0% | National, urban | Short term (≤ 2 years) |
| Data privacy concerns are limiting cross-sector data-sharing for underwriting | -0.4% | National | Medium term (2-4 years) |
| Source: Mordor Intelligence | |||
Persistent Low-Interest-Rate Legacy Blocks Pressuring Life-Insurer Spreads
Guaranteed policies sold in the 2010-2020 era lock in crediting rates that surpass today’s investable yields, squeezing net interest margins. Hedging programs and asset-liability matching lessen but do not eliminate spread compression. Capital tied to these blocks limits resource allocation toward faster-growing unit-linked or fee-based offerings. Investors scrutinize sources of earnings volatility, elevating the cost of capital for life carriers with outsized legacy exposure. Enhanced disclosure under IFRS 17 keeps market pressure high.
Heightened Regulatory Capital (LICAT) Requirements
OSFI continues to tighten calibration for longevity, credit, and catastrophe risk within the Life Insurance Capital Adequacy Test. Additional buffers for climate and cyber exposures raise the target core ratio, compelling insurers to issue subordinated debt or curtail share buybacks. Smaller provincially focused carriers face disproportionate compliance expense, accelerating industry consolidation. Strategic reinsurance and capital-lite product development mitigate impacts, yet slow greenfield expansion. Governance expectations around operational resilience further escalate overhead.
*Our forecasts treat driver/restraint impacts as directional, not additive. The impact forecasts reflect baseline growth, mix effects, and variable interactions.
Segment Analysis
By Insurance Type: Non-Life Leadership Amid Regulatory Pressures
Non-life lines generated 57.88% of premiums in 2025, underscoring the Canada insurance market’s reliance on mandatory auto and expanding property coverage. Auto theft losses of USD 1.04 billion (CAD 1.5 billion) in 2023 spotlight the operational headwinds yet also validate premium growth levers . Property accounts gain momentum as wildfire and flood risks spur higher sums insured and new parametric offerings. Conversely, life products, while smaller in volume, record a 5.72% CAGR, reflecting demand for income-protection and creditor policies in a volatile macro environment. The Canada insurance market size for life cover is projected to widen materially as digital onboarding cuts distribution expense and widens reach into underserved demographics. Risk-based capital requirements encourage capital-efficient unit-linked designs that lessen spread risk. Insurers balance competitive pricing with hedging depth to preserve solvency ratios. Non-life carriers harness geospatial analytics to refine catastrophe aggregates, enhancing reinsurance purchasing strategies. Life insurers leverage predictive underwriting engines that shorten policy issuance to near real-time.
Motor insurance remains a focal point given its scale and regulatory volatility. Telematics-enabled pay-how-you-drive programs help mitigate theft-driven claim frequency and repair-cost escalation. Property insurers encourage mitigation via premium credits for fire-resistant materials and back-up valve installations. Supplemental health rides demographic tailwinds as provincial coverage gaps widen. The Canada insurance market share of health riders within non-life lines is poised to increase as group-benefit brokers target small-business clients seeking competitive talent packages. OSFI capital rule evolutions influence portfolio-mix decisions, nudging insurers toward fee-based arrangements over high-guarantee blocks.


By Customer Segment: Corporate Growth Momentum Challenges Retail Scale
Retail buyers contributed 73.92% of written premiums in 2025, affirming the Canada insurance market’s deep consumer base anchored by compulsory auto and widespread mortgage protection. Yet corporate accounts, though smaller, expand at a 5.45% CAGR on heightened cyber, supply-chain, and climate-related exposures. The Canada insurance market size for commercial lines is expected to approach USD 59.1 billion by 2031, assuming current risk-transfer trends persist. Multinationals operating in Canada demand global program alignment and higher deductibles, prompting carriers to refine captive and fronting services. Mid-market enterprises adopt packaged solutions that consolidate property, casualty, and employee benefits.
Retail products evolve through hyper-personalized offers delivered via mobile wallets and embedded e-commerce flows. Behavioral analytics tailors’ coverages, boosting conversion among digital-native customers. Corporate sector growth invigorates specialty underwriting segments such as directors’ and officers’ liability, intellectual-property cover, and renewable-energy project insurance. Brokers remain pivotal in commercial placement, given bespoke wording and risk-engineering needs. Value-added advisory, including enterprise-risk mapping and resilience consulting, cements client relationships and supports premium retention.
By Distribution Channel: Direct Sales Innovation Amid Agent Resilience
Agents held 32.11% of 2025 premiums, illustrating the enduring relevance of human advice in life and commercial placements. Online direct channels, however, compound at a 6.05% CAGR as insurers invest in quote-bind APIs and instant-issue workflows. The Canada insurance market size attributable to direct digital sales is set to exceed USD 53.6 billion by 2031, narrowing the cost gap versus aggregator-driven markets abroad. Bancassurance leverages single-sign-on integration to sell creditor and travel cover during routine banking sessions, enhancing wallet-share retention. Independent brokers curate complex risk solutions, particularly for mid-market businesses lacking in-house risk staff.
Hybrid models flourish, where digital onboarding funnels route to licensed advisors for upsell or complex queries. Video chat and co-browse functions replicate face-to-face trust while maintaining cost efficiency. Direct writers refine omnichannel service to avoid customer attrition once a claim occurs. Embedded insurance partnerships with e-retailers blur distribution boundaries, as checkout journeys integrate one-click micro-policies. Regulatory scrutiny ensures fair disclosure and opt-out clarity in these frictionless sales flows.
Geography Analysis
Ontario dominates premium generation, propelled by dense population and significant commercial activity, yet it confronts the nation’s steepest auto-theft cost escalation at 524% from 2018 to 2023. Provincial regulators weigh reforms to rating territories and mandatory benefits to curb rate pressure. Québec’s public auto bodily-injury scheme limits private participation to property-damage and ancillary covers, fostering price competition and product differentiation in optional segments. The province’s multilingual distribution dynamics necessitate localized marketing and bilingual service infrastructure.
Western Canada contributes a rising share of property premiums due to wildfire and hailstorm frequency. Alberta’s 2023 insured-loss tally surpassed USD 2.08 billion (CAD 3 billion), prompting carriers to reassess deductibles and catastrophe capacity. British Columbia’s public auto monopoly restricts private opportunity to optional collision and comprehensive endorsements, shaping a market where property, life, and specialty lines hold greater growth prospects. The Canada insurance market share of non-life lines in the province skews toward homeowners seeking overland-flood extensions after 2021 atmospheric river events.
Atlantic provinces, though representing a smaller economic footprint, offer steady opportunities as diversified industry investments spur employment. Lower catastrophe exposure relative to the West translates into more stable combined ratios, attracting niche carriers. Northern territories remain coverage-thin owing to sparse population and high servicing costs, yet mining and infrastructure investment could generate future specialty demand. National carriers deploy centralized underwriting hubs while maintaining region-specific broker relationships to navigate regulatory nuances and cultural differences.
Competitive Landscape
Canada’s insurance sector exhibits moderate concentration. Scale confers advantages in data analytics, reinsurance purchasing, and regulatory compliance, enabling incumbents to manage volatile catastrophe and auto-theft trends. Technology investment intensifies competitive divergence, as leaders automate straight-through claims that shrink settlement cycles from 10 days to 24 hours in low-severity events. AI-driven triage flags potential fraud, reducing leakage and reinforcing profitability.
Cross-border M&A accelerates, with global insurers seeking Canadian market entry to diversify earnings and exploit robust solvency regulation. Domestic players divest non-core business lines, concentrating on segments aligned with capital-light models. Ecosystem partnerships emerge as insurers embed coverage within telecom, retail, and mobility platforms, expanding distribution reach. Regulatory focus on customer outcomes propels transparent pricing and simpler product wording, gradually improving consumer trust metrics.
Talent strategies pivot to data science and cybersecurity hiring to support advanced analytics and safeguard customer information. ESG commitments guide portfolio-allocation decisions, with carriers limiting exposure to high-emission industries and supporting green-infrastructure underwriting. Insurtech collaborations pilot parametric flood products and blockchain-based proof-of-insurance certificates. Reinsurers raise attachment points, pushing primary carriers to hold more volatility, prompting joint ventures that share aggregate-loss layers.
Canada Life and Non-Life Insurance Industry Leaders
Manulife Financial
Sun Life Financial
Great-West Lifeco (Canada Life)
Intact Financial
Desjardins Insurance
- *Disclaimer: Major Players sorted in no particular order

Recent Industry Developments
- June 2024: Insurance Bureau of Canada reported USD 1.0759 billion (CAD 1.5478 billion) in 2023 theft-related claims, a 19% climb over 2022 and a 254% jump versus 2018.
- June 2024: Insurance Bureau of Canada revealed Ontario's top 10 costliest cities for auto theft claims, highlighting that provincial theft claims costs rose 524% from 2018 to 2023, surpassing USD 0.69 billion (CAD 1 billion) in 2023.
- March 2024: Équité Association’s Auto Theft Trend Report confirmed a vehicle is stolen every 5 minutes nationally, with Ontario theft incidents up 48.2% between 2021-2023.
- January 2024: Torys LLP published an analysis positioning Canada as an early-stage but quickly maturing market for parametric insurance that addresses climate-driven and supply-chain disruptions.


Canada Life and Non-Life Insurance Market Report Scope
The life insurance market refers to the sector that deals with policies providing financial protection and long-term savings options for individuals and families. Non-life insurance market, also known as property and casualty insurance, covers insurance policies that protect against risks such as auto accidents, property damage, liability claims, and natural disasters. The life and non-life insurance market in Canada is segmented by insurance type, non-life insurance, and distribution channel. By insurance type, the market is segmented into individuals and groups. By non-life insurance, the market is segmented into home, motor, health, and the rest of non-life insurance. By distribution channel, the market is segmented into direct, agency, banks, and other distribution channels (credit institutions). The report offers market size and forecasts in terms of value (USD) for all the above segments.
By Insurance Type
| Life Insurance | |
| Non-Life Insurance | Motor Insurance |
| Health Insurance | |
| Property Insurance | |
| Liability Insurance | |
| Other Insurance |
By Customer Segment
| Retail |
| Corporate |
By Distribution Channel
| Brokers |
| Agents |
| Banks |
| Direct Sales |
| Other Channels |
| By Insurance Type | Life Insurance | |
| Non-Life Insurance | Motor Insurance | |
| Health Insurance | ||
| Property Insurance | ||
| Liability Insurance | ||
| Other Insurance | ||
| By Customer Segment | Retail | |
| Corporate | ||
| By Distribution Channel | Brokers | |
| Agents | ||
| Banks | ||
| Direct Sales | ||
| Other Channels | ||


Key Questions Answered in the Report
How big is the Canada insurance market in 2026?
The market generated USD 173.07 billion in gross written premiums in 2026.
What is the projected growth rate for Canadian insurers to 2031?
Aggregate premiums are forecast to increase at a 5.07% CAGR by 2031.
Which line of business has the largest share of premiums?
Non-life products, led by mandatory auto and expanding property cover, hold 57.88% of 2025 premiums.
Why are corporate insurance premiums growing faster than retail?
Businesses face rising cyber, supply-chain, and climate exposures, pushing the corporate segment’s 5.45% CAGR to 2031.
How is technology changing distribution?
Direct online platforms deliver instant quote-and-bind experiences, supporting a 6.05% CAGR for digital sales while agents remain vital for complex advice.
What drives demand for supplemental health coverage?
An aging population and higher chronic disease prevalence create gaps in provincial plans, boosting uptake of private health top-ups.
Page last updated on:


