
Lice Treatment Market Size and Share
Market Overview
| Study Period | 2020 - 2031 |
|---|---|
| Market Size (2026) | USD 1.21 Billion |
| Market Size (2031) | USD 1.65 Billion |
| Growth Rate (2026 - 2031) | 6.34 % |
| Fastest Growing Market | Asia Pacific |
| Largest Market | North America |
| Market Concentration | Low |
Major Players *Disclaimer: Major Players sorted in no particular order Image © Mordor Intelligence. Reuse requires attribution under CC BY 4.0. | |
Lice Treatment Market Analysis by Mordor Intelligence
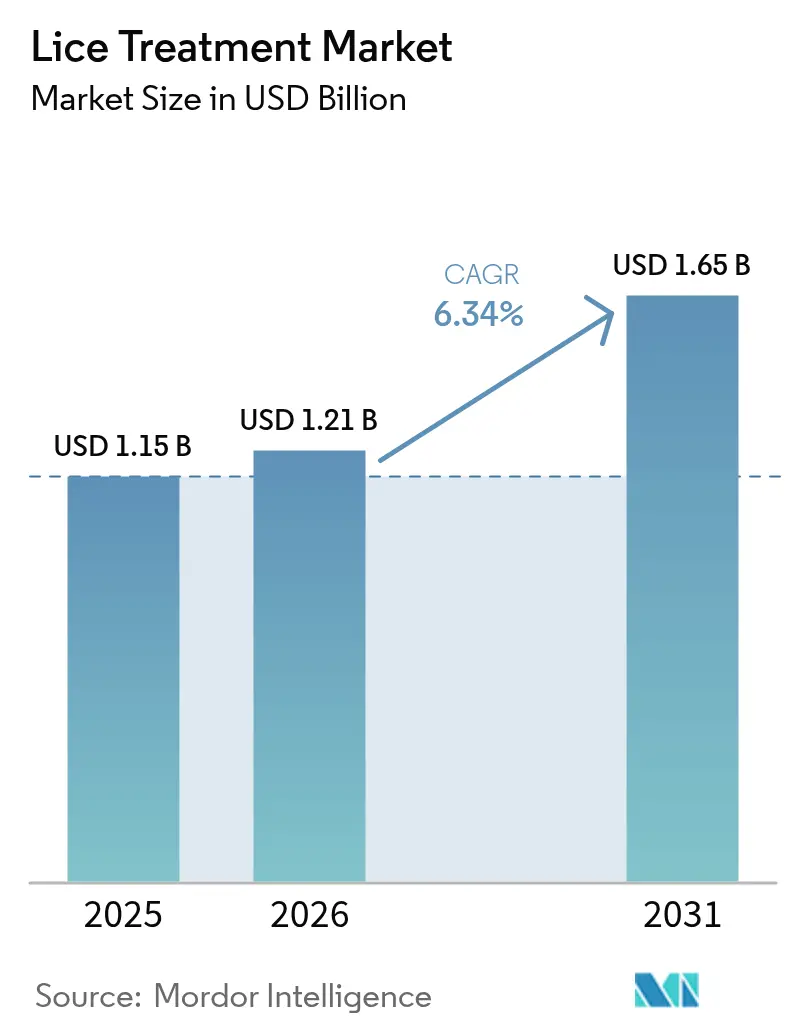
The Lice Treatment Market size is expected to increase from USD 1.15 billion in 2025 to USD 1.21 billion in 2026 and reach USD 1.65 billion by 2031, growing at a CAGR of 6.34% over 2026-2031.
Demand is propelled by the collapse of pyrethroid efficacy, tightening neurotoxic-active regulations, and an accelerated consumer pivot toward botanical or device-based alternatives. North America anchors spending because of branded over-the-counter (OTC) franchises and a dense network of professional removal clinics, yet Asia-Pacific contributes most incremental volume as e-commerce bypasses pharmacy gatekeepers. The lice treatment market is also shaped by subscription models that shift costs from families to schools and by heated-air or AI-enabled comb devices that promise chemical-free eradication. Competitive intensity remains moderate because low barriers invite private-label and generic entrants, while no vendor holds more than a 15% stake in the lice treatment market.[1]
Key Report Takeaways
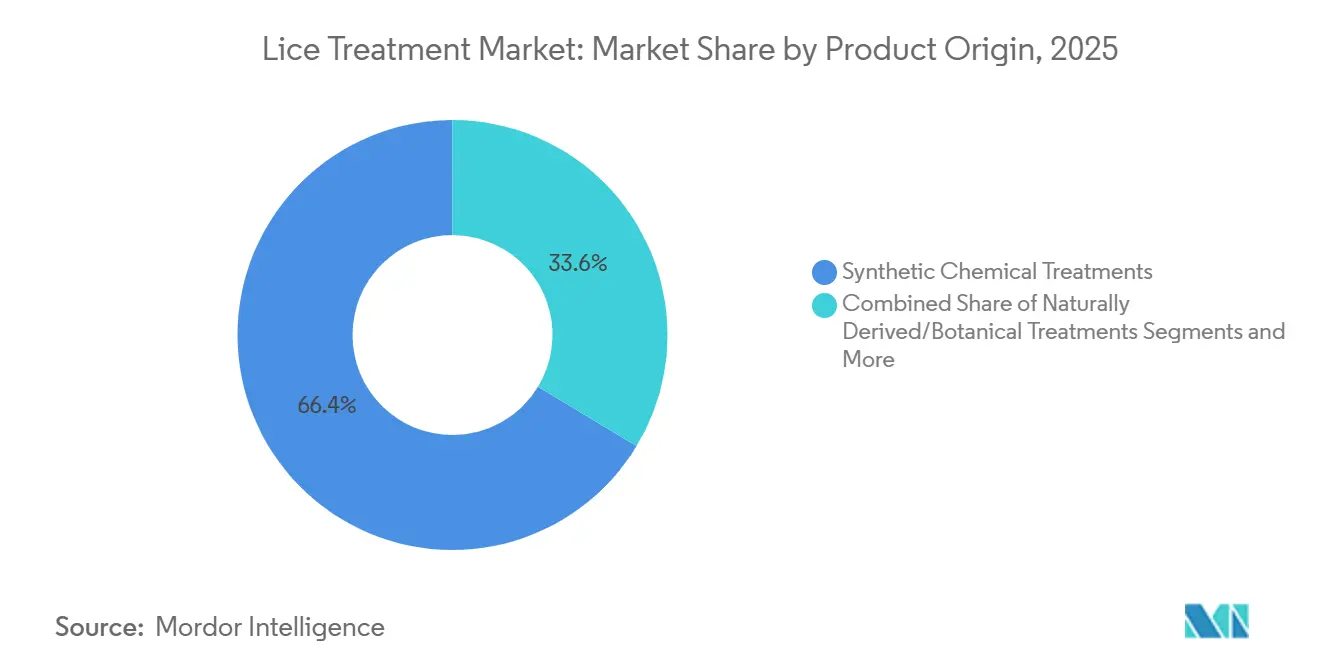
- By product origin, synthetic treatments held 66.36% of lice treatment market share in 2025, while botanical formulations are advancing at a 10.37% CAGR through 2031.
- By age group, the pediatric segment accounted for 53.62% of the lice treatment market size in 2025, and adolescents are projected to expand at an 8.63% CAGR to 2031.
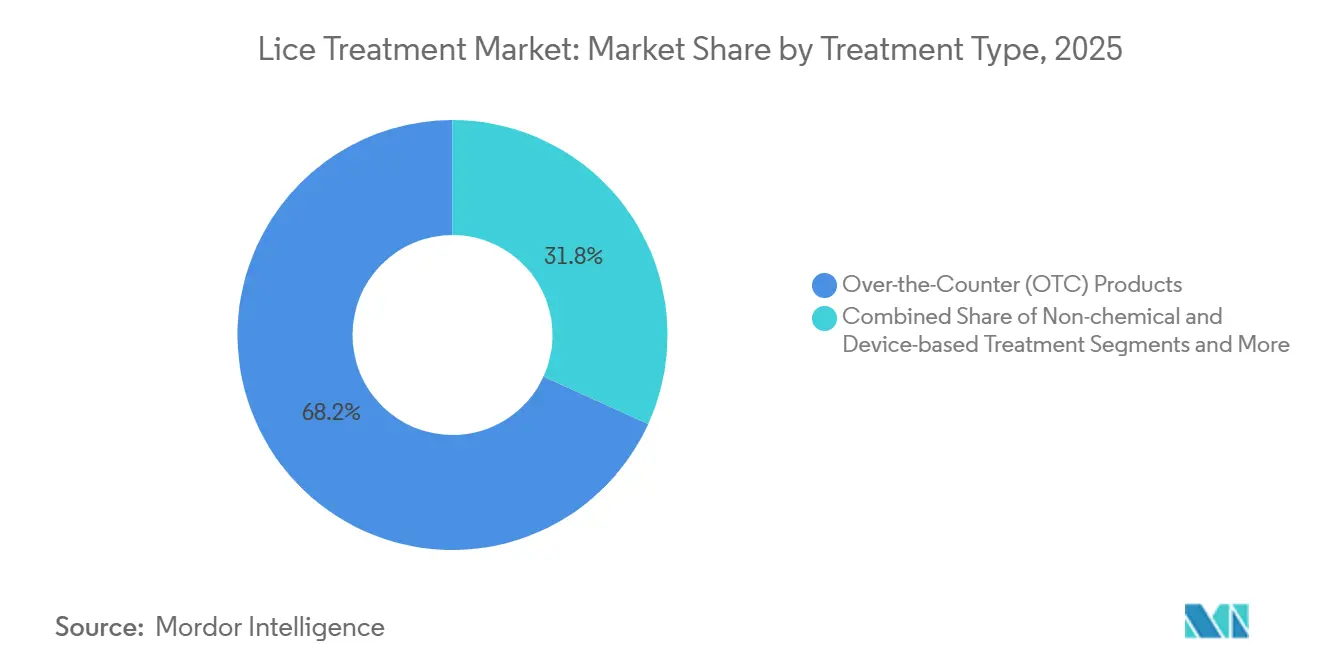
- By treatment type, OTC products led with 68.21% lice treatment market share in 2025, whereas non-chemical platforms are forecast to grow at a 9.52% CAGR between 2026-2031.
- By product type, shampoos controlled 44.14% of lice treatment market revenue in 2025, yet devices are rising at a 10.24% CAGR through 2031.
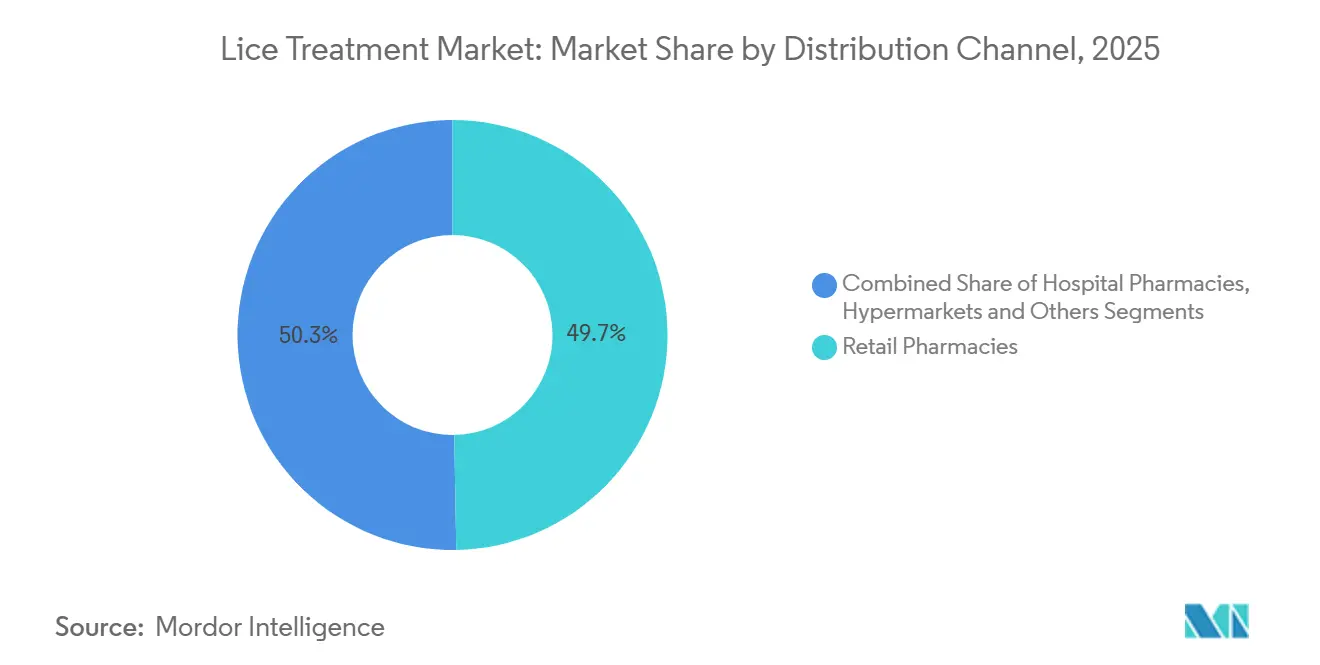
- By distribution channel, retail pharmacies distributed 49.72% of sales in 2025, and online pharmacies plus e-commerce are expanding at a 10.63% CAGR during 2026-2031.
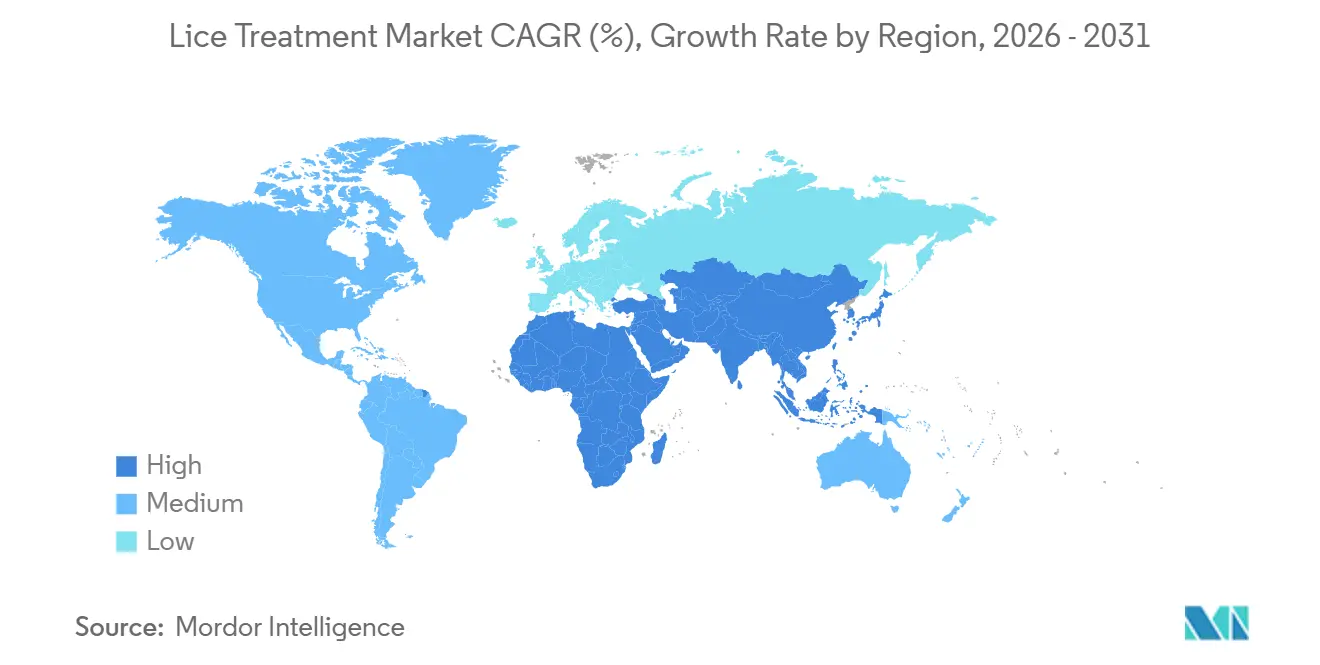
- By geography, North America captured 33.25% of 2025 revenue, while Asia-Pacific is the quickest‐growing region at an 8.22% CAGR to 2031.
Note: Market size and forecast figures in this report are generated using Mordor Intelligence’s proprietary estimation framework, updated with the latest available data and insights as of 2026.
Market Trends and Insights
Drivers Impact Analysis of Lice Treatment Market*
| Driver | (~) % Impact on CAGR Forecast | Geographic Relevance | Impact Timeline |
|---|---|---|---|
| Rising prevalence of treatment-resistant “super lice” | +1.2% | North America, Europe | Medium term (2-4 years) |
| Wider availability of generic ivermectin 0.5% lotion | +0.9% | North America, Europe, select Asia-Pacific | Short term (≤ 2 years) |
| Heightened parental awareness via school e-health portals | +0.7% | North America, Western Europe, urban Asia-Pacific | Medium term (2-4 years) |
| Expansion of OTC permethrin bans in Europe | +0.6% | European Union member states | Long term (≥ 4 years) |
| Retail launch of AI-enabled lice detection combs | +0.5% | North America, Western Europe, Japan | Short term (≤ 2 years) |
| Growth of “lice-free school” subscription contracts | +0.4% | United States, Canada, Australia | Medium term (2-4 years) |
| Source: Mordor Intelligence | |||
Rising Prevalence of Treatment-Resistant “Super Lice”
Pyrethroid-resistant lice now dominate infestations across most U.S. states, and kdr mutations appear in European samples as well. Clinical literature published in 2025 reported that 98% of North American specimens carried at least one resistance allele, driving caregivers toward ivermectin, spinosad, or device solutions.[2] Multiple treatment cycles inflate per-episode spending and erode loyalty to legacy OTC shampoos. Manufacturers still dependent on pyrethroid chemistry face margin pressure unless they diversify into next-generation actives or non-chemical devices.
Growing Availability of Prescription Sklice (Ivermectin 0.5%) Generics
After the FDA moved ivermectin 0.5% lotion from prescription to OTC status in 2020, generic launches by Amneal, Teva, and Perrigo cut average retail prices by about 45%. Medicaid formularies favor these lower-cost options, expanding access for lower-income families.[3] Although adoption remains uneven in Asia-Pacific and Latin America, the price drop reshapes pharmacy shelf economics in the United States and Europe.
Heightened Parental Awareness Through School E-Health Portals
Digital class portals alert parents within hours of an outbreak, link to evidence-based treatment guides, and schedule automated reminders for follow-up checks. A 2025 Ontario pilot showed a 30% cut in repeat infestations once the system was live. These platforms drive product selection toward clinically validated brands and reinforce early purchasing behavior.
Expansion of OTC Permethrin Bans in Europe
Denmark, Sweden, and other EU members have shifted permethrin to prescription-only channels under the Biocidal Products Regulation. Brands must either invest in expensive dossiers to stay on shelves or pivot into botanical lines regarded as cosmetics. That regulatory tension steers families into dimeticone or device alternatives, reshaping the lice treatment market long term.
Restraints Impact Analysis of Lice Treatment Market*
| Restraint | (~) % Impact on CAGR Forecast | Geographic Relevance | Impact Timeline |
|---|---|---|---|
| Rising safety concerns about neuro-toxic pediculicides | -0.8% | North America, Europe | Medium term (2-4 years) |
| Growing use of “no-poison” home remedies | -0.6% | North America, Western Europe, urban Asia-Pacific | Short term (≤ 2 years) |
| Strict EU biocide rules delaying novel actives | -0.5% | European Union member states | Long term (≥ 4 years) |
| Grey-market generics in price-sensitive economies | -0.4% | South Asia, Sub-Saharan Africa, Latin America | Medium term (2-4 years) |
| Source: Mordor Intelligence | |||
Increasing Safety Concerns Around Neuro-Toxic Pediculicides
Pediatric societies now advise parents to avoid neuro-toxic shampoos when alternatives exist, citing developmental-toxicity signals from animal studies. Label warnings in Europe intensify risk perception, pushing families toward botanical or device platforms and shrinking demand for permethrin lotions.
Rising Preference for “No-Poison” Home Remedies Impacting Product Uptake
DIY methods such as wet-combing or olive-oil suffocation circulate widely on social media. Although a 2025 Cochrane analysis placed wet-combing success at only 38%, wellness-centric parents still embrace non-commercial tactics. This behavioral shift siphons volume away from formal retail channels.
*Our forecasts treat driver/restraint impacts as directional, not additive. The impact forecasts reflect baseline growth, mix effects, and variable interactions.
Lice Treatment Market Segment Analysis
By Product Origin:
Botanical Alternatives Challenge Synthetic DominanceSynthetic formulas captured 66.36% of 2025 revenue, a share built on long-standing pharmacist trust and clinical validation. Yet botanical solutions are scaling at 10.37% as parents seek “clean-label” reassurance. The lice treatment market size for botanicals is projected to expand steadily because essential-oil brands navigate lighter regulatory paths. Synthetic players now hedge with combination kits that bundle a nit comb to boost perceived value. Underlying fragility persists: rampant resistance forces a pivot toward costlier ivermectin and spinosad, while European rules squeeze pyrethroids. Tea-tree and neem products win shelf space despite lower eradication rates, thanks to rapid cosmetic registration. Device vendors, exempt from drug dossiers, present a longer-run disruptive threat.
Second-order effects shape future margins. Tea-tree suppliers skirt pharmacovigilance, but inconsistent kill rates spark repeat infestations that may erode consumer trust. Dimeticone gels, acting via suffocation not neuro-toxicity, bridge the performance gap and qualify as Class I devices in several markets, accelerating approvals. Electronic-vacuum comb makers aim to halve unit prices, positioning reusable hardware as the logical escape from resistance loops in the lice treatment market.

By Age Group:
Adolescent Growth Outpaces Pediatric CoreChildren aged 0-11 generated 53.62% of 2025 sales, reflecting playground transmission intensity. Adolescents aged 12-17 now expand at 8.63% because middle- and high-school screenings catch silent carriers, and teens value discreet, rapid fixes. The lice treatment market size for the adolescent cohort is forecast to widen as social stigma fuels willingness to pay for single-session devices. Adults represent secondary household cases and often secure insurance-covered prescriptions, while geriatric demand stays negligible.
Digital commerce reorders purchase journeys. Teens, browsing via smartphones, buy ivermectin lotions or smart combs without parental mediation, forcing brands to optimize TikTok and Instagram storefronts. Pediatric purchases still favor multi-dose shampoo packs, though rising clinical failures nudge families toward professional franchises. Adult cases gravitate to dermatology offices, where oral ivermectin fills the refractory niche. For marketers, distinct channels and messaging are mandatory across age bands inside the lice treatment market.
By Treatment Type:
Non-Chemical Platforms AccelerateOTC products led with 68.21% lice treatment market share in 2025, courtesy of easy pharmacy access. Still, non-chemical options climb at 9.52% as resistance spreads and EU rules pinch neuro-toxic actives. Prescription ivermectin and spinosad cover severe cases but face access hurdles.
Dimeticone products, labeled as medical devices, bypass drug requirements and retain efficacy against resistant strains. Heated-air systems dehydrate lice in one visit, luring parents averse to chemicals. Hybrid offerings emerge: OTC kits including a chemical shampoo plus an AI comb for verification. Pharmacy closures during the COVID-19 era pushed households to e-commerce, shrinking the pharmacist’s gatekeeper role in the lice treatment market.
By Product Type:
Devices Rise as Shampoos PlateauShampoos maintained 44.14% share in 2025 because of habit and convenience. Devices now advance at 10.24% CAGR; families justify a USD 40-80 smart comb versus multiple USD 20 shampoo cycles. Lotions and creams appeal to dense or curly hair where shampoo foams poorly, while sprays target hard-to-reach nape zones. Ivermectin tablets remain a niche but indispensable option for chronic infestations.
The lice treatment market share held by devices stands to climb once unit prices drop and retailers bundle financing. FDA Class II clearance focuses on safety, enabling annual model improvements without multi-year trials. As shampoo efficacy wanes, devices or dimeticone gels become first-line in affluent segments, pushing chemical shampoos toward commodity status.
By Distribution Channel:
E-Commerce Chips Away at Pharmacy DominanceRetail pharmacies accounted for 49.72% of sales in 2025, benefiting from pharmacist recommendations and instant availability. Yet online pharmacies and general e-commerce are surging at 10.63% CAGR as same-day delivery spreads. Parents value discretion and review aggregation, and telemedicine links let physicians e-prescribe ivermectin directly to mail-order pharmacies.
Brick-and-mortar outlets still capture panic purchases discovered after school pickup, but planned replenishment migrates online. Amazon Pharmacy and CVS.com streamline insurance adjudication, undercutting local pharmacy margins. Hospital pharmacies serve prescription niches, while hypermarkets appeal to bulk shoppers. Omnichannel consistency—pricing, pack sizes, brand voice—is now a gating factor for growth inside the lice treatment market.
Geography Analysis
North America Lice Treatment Market
North America generated 33.25% of 2025 revenue, buoyed by high insurance penetration and professional franchise density. Pyrethroid resistance makes treatment episodes costlier, lifting average selling prices. Mandatory screenings in 40+ U.S. states sustain repeat demand despite flat incidence. Canadian provinces increasingly reimburse prescription ivermectin for low-income families, softening price sensitivity. Mexican urban centers mirror U.S. brand preferences, but rural areas still rely on under-regulated sachets, limiting formal-channel opportunity.
APAC Lice Treatment Market
Asia-Pacific expands at 8.22% CAGR through 2031, with India and China driving absolute volume. Grey-market generics hijack 30-40% of unit sales, though rising urban incomes and smartphone adoption push parents toward branded devices. Japan and South Korea favor botanical lotions and AI combs that align with tech and clean-beauty trends. Australia, while small in population, exhibits North American dynamics: franchise clinics, insurance coverage, and e-commerce uptake. Localized strategies are imperative—low-price sachets in South Asia, premium unboxing experiences in East Asia, and pharmacy focus in Oceania.
EMEA and South America Lice Treatment Market
Europe sits mid-pack, its growth dampened by biocide stringency. Germany, France, and the United Kingdom anchor demand and reimburse prescription pediculicides for children. Southern Europe leans on OTC shampoos, whereas Eastern Europe still trusts generic permethrin despite falling cure rates. Nordic countries push botanical transitions, having curtailed OTC permethrin. Beyond Europe, Middle East & Africa and South America remain formative. Brazil’s health-tech startups pilot tele-consult + delivery bundles, and South African chains test heated-air service booths, yet weak logistics and limited insurance curb mass uptake. Growing but fragmented, these regions require tailored channel blends to unlock the lice treatment market.
Regulatory Landscape
In the United States, OTC pediculicide drug products are governed under the FDA OTC monograph framework, including 21 CFR Part 358 Subpart G for labeling and conditions of use, which standardizes how head, pubic, and body lice indications and retreatment directions are presented. For combination offerings (for example, a pediculicide packaged with a comb or verification tool), the FDA assigns oversight using the principal mode of action under 21 CFR Part 3, which determines whether the product follows a drug-led or device-led path and the evidence and quality requirements that apply.
In Europe, classification and access depend on whether the primary therapeutic effect is delivered by a medicinal product or a medical device. Under the EU Medical Device Regulation (MDR) 2017/745, integral drug-device combinations require coordination between the medicinal product assessment and a Notified Body opinion on device conformity (commonly referenced via MDR Article 117 and MDCG guidance), while separately supplied devices must be CE marked. This split can support faster iteration cycles for physical-mode products such as dimeticone-based suffocation gels or mechanical/heat-based devices, relative to novel neurotoxic actives that face longer biocide or medicinal-product dossiers in several EU member states.
Value Chain Analysis
The lice treatment value chain starts with active-ingredient and excipient sourcing (pyrethroids, ivermectin, spinosad, dimeticone/silicones, and botanical oils), followed by formulation development, stability testing, and regulated manufacturing (batching, filling, and packaging) for shampoos, lotions, sprays, and serums. In parallel, device pathways rely on component suppliers (heating elements, plastics, sensors, and comb heads), device assembly, and device quality systems, after which products move through wholesalers and retailers including pharmacies, hypermarkets, and online pharmacies and general e-commerce.
Prescription products add prescriber access and payer or formulary management, while OTC products depend heavily on shelf positioning, consumer education, and clear directions for retreatment and nit removal. Downstream, professional removal clinics and franchise operators add a service layer by monetizing single-session heated-air or manual removal, increasingly tied to institutional procurement through school programs. Regulatory classification shapes chain economics, as drug-led products carry higher compliance, pharmacovigilance, and claims substantiation burden, while device- or mechanically acting products can use device conformity routes in many markets, supporting quicker refresh cycles and product bundling (for example, kits combining chemical treatment with verification combs). Channel dynamics also influence outcomes, with e-commerce reducing reliance on pharmacist gatekeeping and supporting discreet replenishment, while schools and clinic networks can shift brand choice during outbreaks.
Competitive Landscape
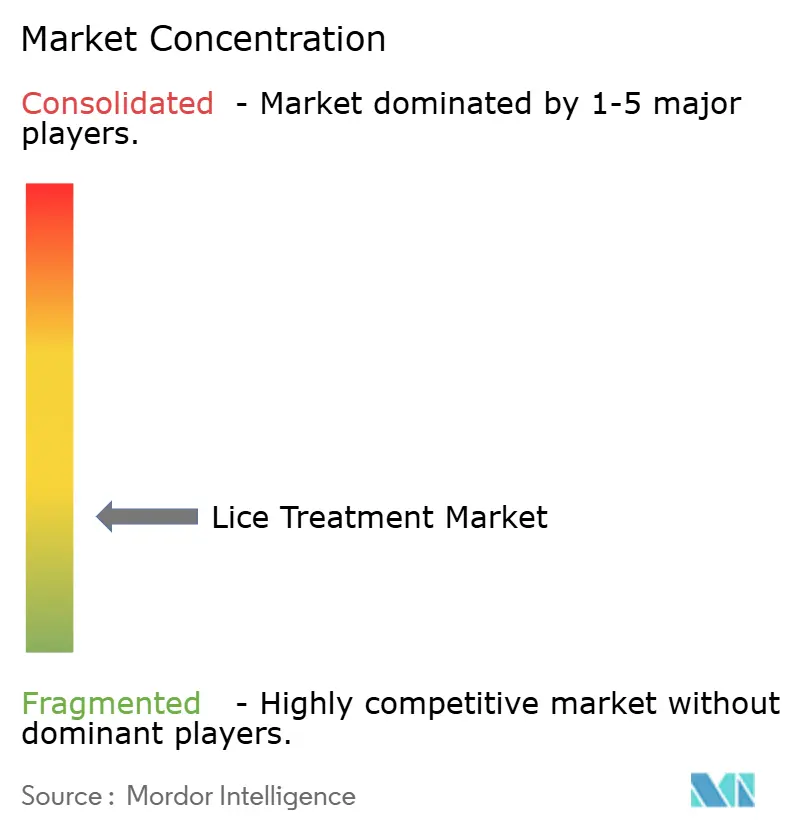
The lice treatment market has a moderate fragmentation. Kenvue, Reckitt, and Perrigo defend legacy permethrin lines using retailer incentives and brand familiarity, though efficacy erosion dilutes loyalty. Amneal, Teva, and Dr. Reddy’s win on price after launching generic ivermectin lotions post-2024. Device-centric firms such as Larada Sciences and Hair Fairies monetize high-margin heated-air treatments through franchise models and institutional contracts.
Innovation migrates to engineering and digital platforms rather than chemistry. The FDA’s 510(k) route lets AI comb makers iterate annually. Patent data shows progress in plasma-ionization tips, machine-vision nit counters, and slow-release botanical microcapsules. E-commerce-native brands exploit Instagram for story-driven marketing, bypassing shelf fees. Subscription-based school contracts give service vendors predictable cash flows, a structural advantage over one-off product sales. Future competitive edges will hinge on omnichannel reach, bundled service propositions, and region-specific regulatory mastery.
Lice Treatment Industry Leaders
-
Prestige Consumer Healthcare Inc
-
Reckitt Benckiser Group plc
-
Bayer AG
-
Sanofi S.A
-
Kenvue
- *Disclaimer: Major Players sorted in no particular order
Lice Treatment Market Companies Covered in this Report
- Amneal Pharmaceuticals
- Arnest Laboratories
- Bayer
- Dr. Reddy’s Laboratories Ltd.
- Hair Fairies Inc.
- Kenvue
- Larada Sciences (Lice Clinics of America)
- Logic Product Group LLC
- Lupin
- ParaPRO Pharmaceuticals
- Perrigo Company
- Prestige Consumer Healthcare
- Reckitt Benckiser Group
- Sanofi
- Shionogi & Co., Ltd.
- TecLabs Inc.
- Teva Pharmaceutical Industries
Market Opportunities and Future Outlook
White space is concentrated in non-neurotoxic and physical-mode solutions that address widespread resistance to legacy pyrethroids and rising caregiver aversion to pesticide-linked safety concerns. A visible signal is FreezeNit's April 2025 announcement of an exclusive license for a novel, non-toxic OTC lice treatment gel based on mechanical action (using abrasive particulates to target lice and eggs), reflecting ongoing product development aimed at chemical-avoidant consumers. Device and mechanically acting products also fit guidance favoring mechanical removal for very young children, supporting opportunities for premium kits that combine treatment with verification, such as comb-based detection and follow-up confirmation.
Geographic and channel opportunity is tied to e-commerce expansion and access pathways that reduce out-of-pocket barriers. The US move of ivermectin 0.5% lotion to OTC status and subsequent generic competition has already altered shelf economics, and it can be paired with online-pharmacy fulfillment and telehealth prescribing for refractory cases. In Asia-Pacific, where the report notes substantial grey-market activity in price-sensitive settings, manufacturers can differentiate through trusted quality, localized pack sizes, and regulated online distribution, while premium segments in Japan and South Korea show preferences for clean-label botanicals and tech-enabled combs. Service-model expansion also offers differentiation, as school contracts and clinic networks convert efficacy and convenience into recurring utilization beyond one-off retail purchases.
Recent Industry Developments in Lice Treatment Market
- June 2026: Prestige Consumer Healthcare Inc. completed the acquisition of Breathe Right, expanding its OTC portfolio that includes the Nix lice treatment franchise. The combination strengthens retailer relationships and marketing scale that can support shelf visibility and promotional intensity across adjacent OTC categories.
- January 2026: Pelthos Therapeutics acquired Xeglyze (abametapir) from Hatchtech Pty Ltd for USD 1.8 million, adding a single-application pediculicide asset to its dermatology portfolio. The deal highlights portfolio-building around differentiated prescription options as pyrethroid resistance pressures legacy OTC therapies.
- April 2025: FreezeNit's exclusive license for a novel non-toxic OTC lice treatment gel based on mechanical action was announced, highlighting continued product development aimed at chemical-avoidant consumers. The license signals expansion of non-chemical treatment options into mainstream channels.
Lice Treatment Market Report Scope and Research Methodology
Market Definition and Coverage
This market covers products and devices used to kill, immobilize, or physically remove lice and nits for head, body, and pubic lice, sold through retail, hospital, and online channels. Market values are estimated at buyer prices, which reflect typical channel markups.
Scope exclusions: Home remedies and general hair care products that are not marketed or indicated for lice removal are excluded.
Segments Covered in This Report
- By Product Origin
- Synthetic Chemical Treatments
- Naturally Derived / Botanical Treatments
- Device-based / Mechanical Treatments
- Combination Kits (chemical + device / comb)
- By Age Group
- Pediatric (0-11 years)
- Adolescents (12-17 years)
- Adults (18-64 years)
- Geriatric (65 years & above)
- By Treatment Type
- Over-the-Counter (OTC) Products
- Prescription Treatments
- Non-chemical and Device-based Treatments
- By Product Type
- Shampoos
- Lotions & Creams
- Sprays
- Serums & Gels
- Oral Tablets
- Devices
- Others
- By Distribution Channel
- Retail Pharmacies
- Hospital Pharmacies
- Online Pharmacies & E-commerce
- Hypermarkets & Others
- By Geography
- North America
- United States
- Canada
- Mexico
- Europe
- Germany
- France
- United Kingdom
- Italy
- Spain
- Rest of Europe
- Asia-Pacific
- China
- Japan
- India
- South Korea
- Australia
- Rest of Asia-Pacific
- Middle East & Africa
- GCC
- South Africa
- Rest of Middle East & Africa
- South America
- Brazil
- Argentina
- Rest of South America
- North America
Data Sources, Market Sizing, and Validation
Desk Research
Desk research began by mapping how infestations are identified and treated, which helped us define a consistent demand pool before pricing was applied. Public health references were used to understand where outbreaks are more common, how school seasonality affects demand, and how resistance patterns can shift treatment choices over time.
We reviewed reputable public sources such as the US CDC, national ministries of health and national health services, and peer-reviewed dermatology and pediatrics journals that discuss pediculosis and treatment outcomes. Customs and trade statistics were used selectively to sanity-check product movement in larger importing markets, and regulatory labeling summaries helped confirm product positioning. Company filings, investor presentations, reputed press, and patent databases were also consulted, and a paid subscription for company financials and intelligence was used selectively to cross-check revenue exposure and product focus. These desk sources are illustrative and not exhaustive, and many other public references were used for data collection, validation, and clarification.
Primary Interviews and Surveys
Primary work focused on validating what sells, where it sells, and how pricing and repeat purchase behave after an infestation is detected. We spoke with manufacturers, distributors, pharmacists, clinic operators, and healthcare professionals, and we included channel stakeholders to validate markups and promotion mechanics. Since the scope is global, inputs were checked across major regions so regional differences in treatment habits and product access could be represented in the final model.
Distribution of primary research fieldwork respondents
| Company type | Respondent position | Region |
|---|---|---|
| Top tier: 36% | CXOs: 14% | APAC: 38% |
| Mid tier: 50% | Functional/Unit leaders: 31% | EMEA: 37% |
| Smaller Players: 14% | Managers: 55% | Americas: 25% |
Market-Sizing & Forecasting
Sizing starts with a top-down build where prevalence signals and treated-case assumptions are translated into an addressable demand pool, and this pool is then converted into product demand using typical treatment cycles. For each major geography, unit demand is combined with an average selling price range by product format, followed by channel mix adjustments so retail, hospital, and online pricing differences are reflected.
Inputs that materially shape the model include the incidence concentration in school-age groups, repeat-treatment rates linked to reinfestation, resistance trends that can shift mix between chemical and non-chemical options, average pack sizes and recommended usage per episode, and the share of demand routed through clinics versus self-care retail. Forecasting is run using scenario analysis, with variable-level direction checked with expert views on awareness, access to OTC options, and pricing changes from inflation and promotions. Results are corroborated with selective bottom-up approximations such as sampled shelf prices, distributor channel checks, and supplier roll-ups when public disclosures make that feasible. Where data gaps exist, we use proxy markets with similar infestation and channel patterns and then adjust using local validation.
Data Validation & Update Cycle
Model outputs are checked against independent signals such as OTC category growth cues, clinic activity direction, and country-level consumer healthcare spending trends, which helps catch values that drift away from observable behavior. When a variance is found, assumptions are re-tested and respondents are re-contacted if the change looks material, especially around pricing, resistance-driven switching, and channel rebalancing.
Before sign-off, the dataset goes through multi-step analyst review with consistency checks across geographies, segments, and time series so outliers are explained rather than carried forward. The report is refreshed annually, and interim updates are made when major events occur, such as regulatory actions, product recalls, or notable changes in treatment guidance. Right before delivery, a final review pass is completed so the latest public signals and field feedback are reflected.
Mordor Intelligence's Lice Treatment Market Size Versus Other Published Estimates
Published market sizes for lice treatment can look different even when they address the same condition, because publishers draw the market line in different places and they do not always apply the same pricing layer. The year used as the starting point, the way currency timing is handled, and how fast product mix is assumed to change can also move the number.
Clinic-delivered lice removal services are sometimes counted alongside product sales, but those services sit outside Mordor Intelligence's scope here, where the sizing tracks lice treatment products and devices sold through standard distribution channels. Differences also arise when one model anchors on 2024 and another on 2025, and when repeat-treatment rates and resistance-driven switching are not validated with field inputs.
Benchmark comparison
| Source | Market Size | Gaps in Research Methodology |
|---|---|---|
| Mordor Intelligence | USD 1.15 B (2025) | |
| Global Consultancy A | USD 1.08 B (2024) | Uses a 2024 base year and appears to include a broader set of clinic-linked activity in parts of the sizing, which changes the total before forecasting assumptions are applied. |
| Regional Consultancy B | USD 1.14 B (2025) | Places more weight on topical drug sales and may undercount device-led treatments and some non-chemical options, which narrows the addressable demand pool and the channel mix. |
Across the three figures, the spread is mainly explained by what gets counted as a market item, the chosen base year, and how channel pricing is represented. When the demand pool and the included product basket are stated clearly, and then cross-checked with practical field inputs, the resulting market size is easier to reproduce and to stress-test for planning.
Key Questions Answered in the Report
How big will the lice treatment market be in 2031?
It is forecast to reach USD 1.65 billion by 2031, reflecting a 6.34% CAGR from 2026.
Which product origin grows fastest?
Botanical formulations are set to rise at a 10.37% CAGR, the quickest among all origins.
Why are devices gaining traction over shampoos?
Parents value reusable, chemical-free eradication; smart combs and heated-air kits grow at 10.24% CAGR, outpacing plateauing shampoos.
Which region offers the highest growth momentum?
Asia-Pacific leads with an 8.22% CAGR thanks to e-commerce access, urban school enrollment, and rising disposable incomes.
What drives the switch from permethrin to ivermectin?
Near-universal pyrethroid resistance and lower-cost generics have shifted demand toward ivermectin 0.5% lotions.