Laser Cutting Machine Market Size and Share
Market Overview
| Study Period | 2020 - 2031 |
|---|---|
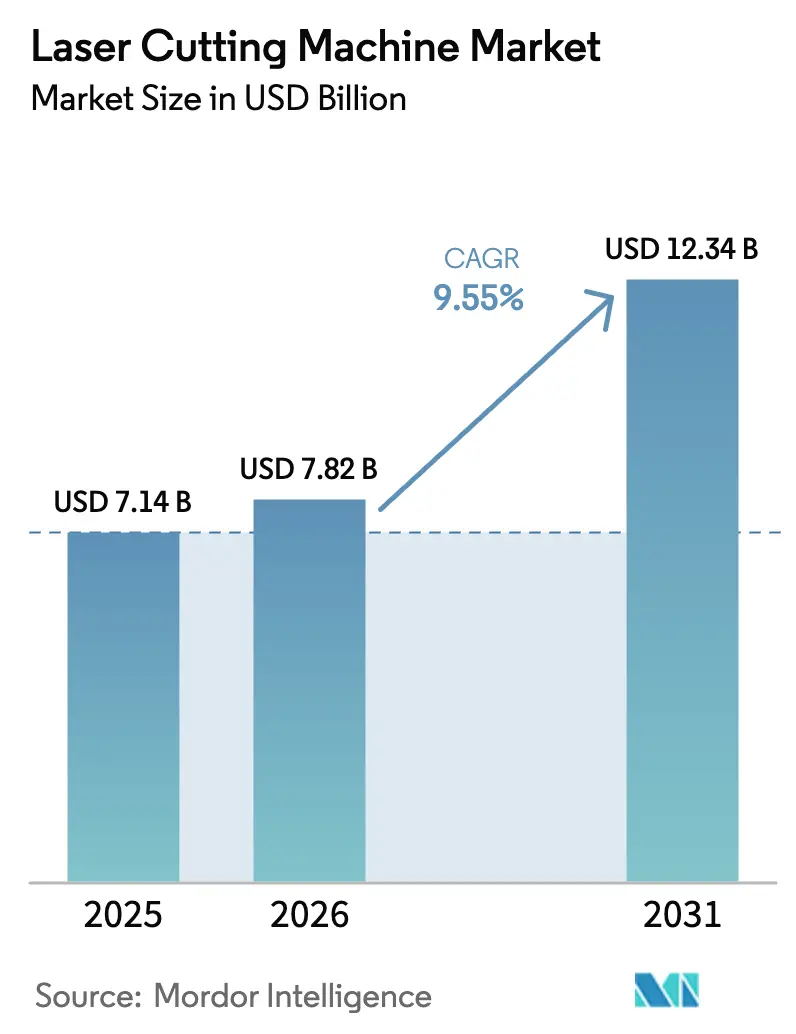
| Market Size (2026) | USD 7.82 Billion |
| Market Size (2031) | USD 12.34 Billion |
| Growth Rate (2026 - 2031) | 9.55% CAGR |
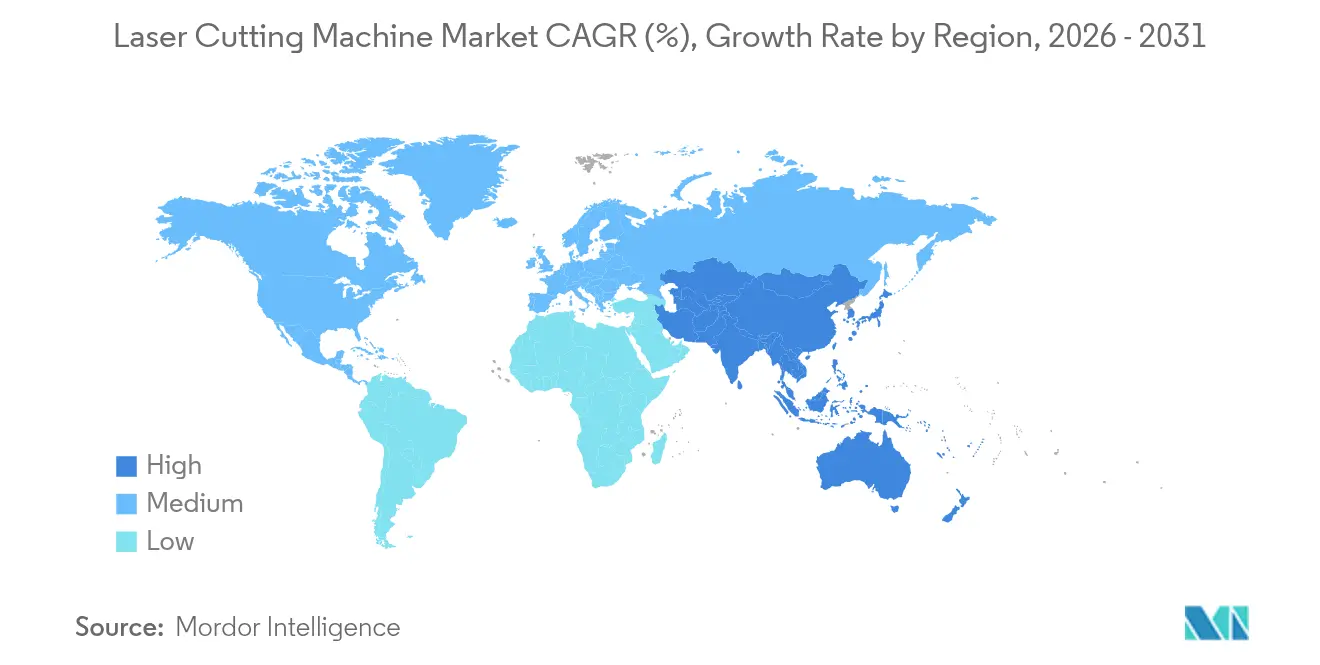
| Fastest Growing Market | Asia Pacific |
| Largest Market | Asia Pacific |
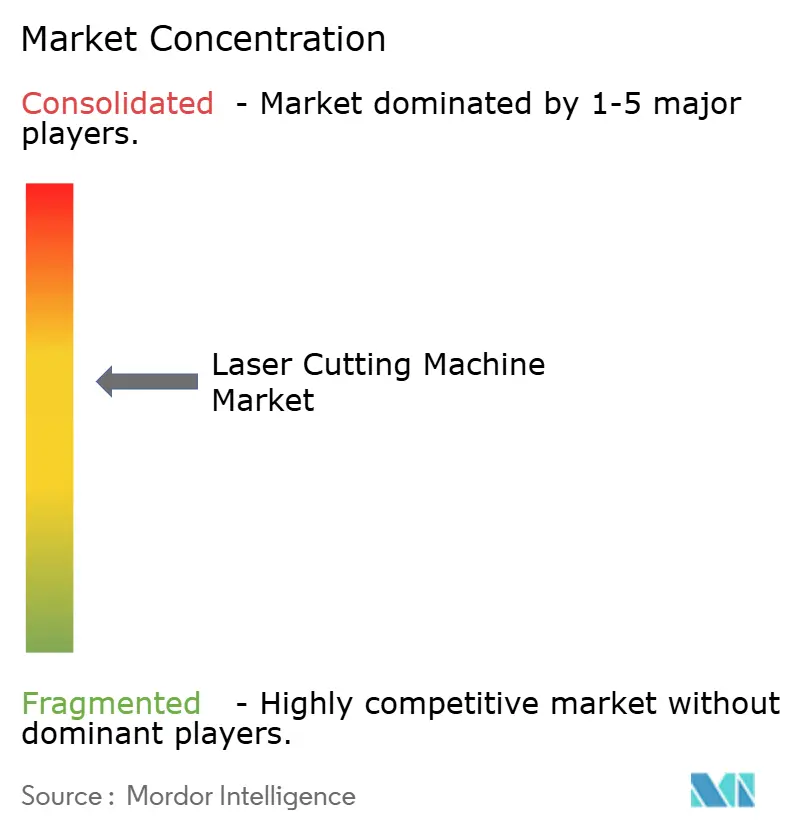
| Market Concentration | Medium |
Major Players *Disclaimer: Major Players sorted in no particular order Image © Mordor Intelligence. Reuse requires attribution under CC BY 4.0. | |
Laser Cutting Machine Market Analysis by Mordor Intelligence
The laser cutting machine market size is expected to grow from USD 7.14 billion in 2025 to USD 7.82 billion in 2026 and is forecast to reach USD 12.34 billion by 2031 at 9.55% CAGR over 2026-2031. This trajectory echoed manufacturers’ pivot toward precision fabrication for electric-vehicle platforms, complex consumer-electronics assemblies, and heavy-gauge infrastructure projects. Rapid adoption of >12 kW fiber sources shortened cycle times for 30 mm-plus plate, while Industry 4.0 programs pushed users to embed laser cells inside data-rich production networks. In parallel, semiconductor packaging’s sub-3 µm features created fresh demand for ultrafast micro-cutting, and predictive-maintenance software began trimming unplanned stoppages and gas consumption. Competitive intensity rose as Chinese builders scaled globally, pressuring European incumbents to differentiate through software and service.
Key Report Takeaways
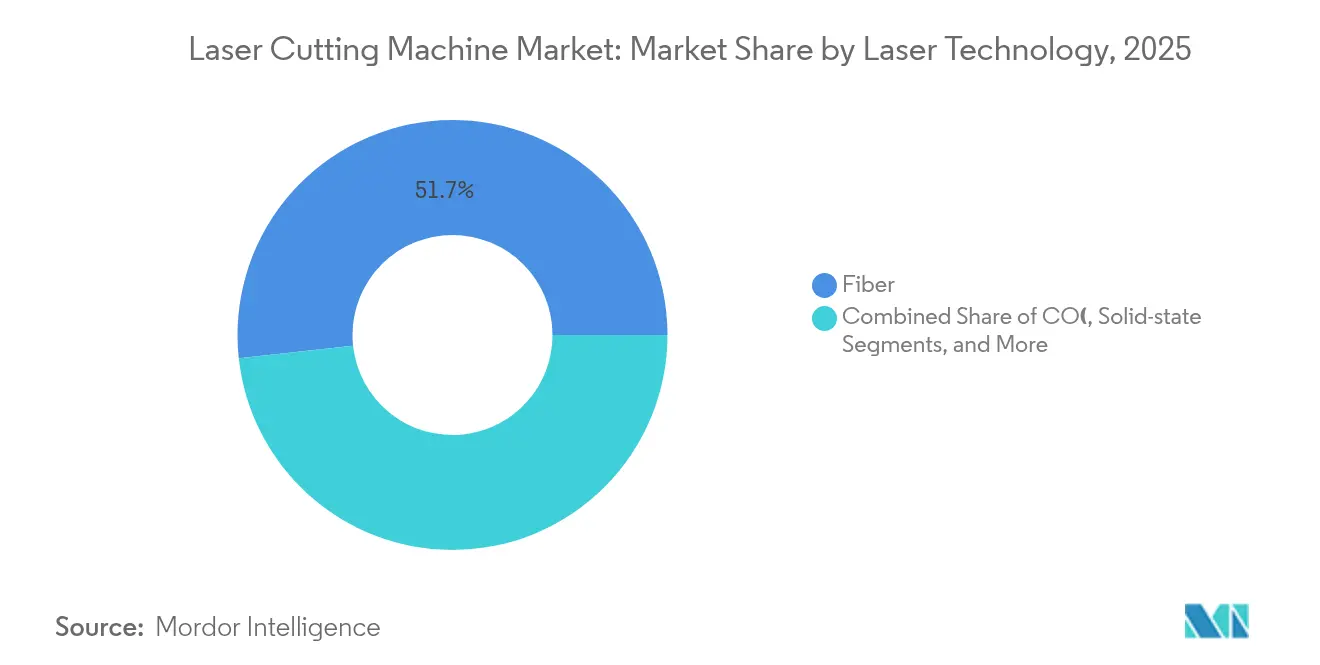
- By product type, fiber lasers led with 51.72% revenue share in 2025; disk and other solid-state variants are projected to expand at a 9.75% CAGR to 2031.
- By machine type, 2-D flat-bed units held 42.65% of the laser cutting machine market share in 2025, whereas 3-D/5-axis systems are set to grow at 12.6% through 2031.
- By power range, 2.1-6 kW models captured 37.85% share of the laser cutting machine market size in 2025; >12 kW platforms are expected to post a 14.3% CAGR by 2031.
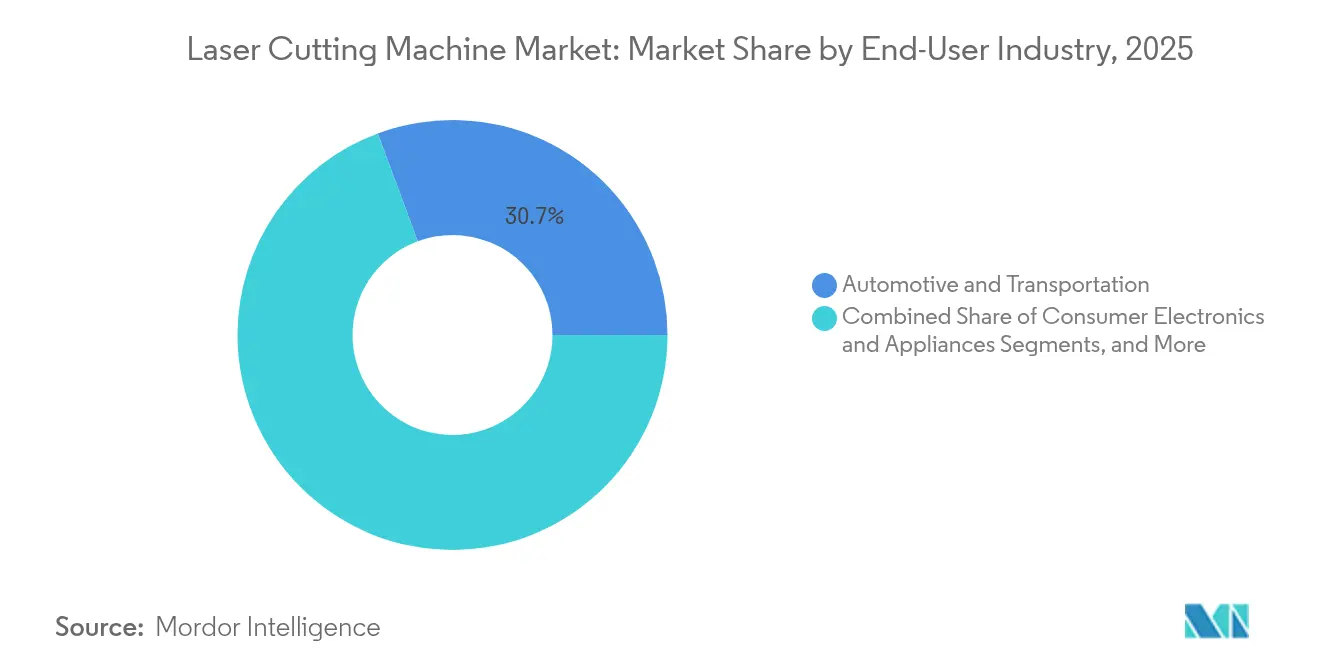
- By end user, automotive and transportation commanded 30.65% of the laser cutting machine market size in 2025, while medical devices will advance at 9.45% CAGR between 2026-2031.
- By material thickness, the 5.1-20 mm band accounted for 44.72% of laser cutting machine market share in 2025, and thick-plate (>20 mm) processing is forecast to rise 12.1% CAGR.
- By region, Asia-Pacific led with 45.90% revenue share in 2025; the same region is projected to register an 10.9% CAGR to 2031.
Note: Market size and forecast figures in this report are generated using Mordor Intelligence’s proprietary estimation framework, updated with the latest available data and insights as of 2026.
Global Laser Cutting Machine Market Trends and Insights
Drivers Impact Analysis*
| Driver | (~) % Impact on CAGR Forecast | Geographic Relevance | Impact Timeline |
|---|---|---|---|
| Rising demand from EVs and consumer electronics | +2.8% | China, Germany, North America | Medium term (2-4 years) |
| Industry 4.0-enabled smart factories | +2.1% | North America, EU, expanding to Asia-Pacific | Long term (≥4 years) |
| Ultra-high-power fiber lasers > 30 mm plate | +1.9% | Shipbuilding and construction hubs worldwide | Short term (≤2 years) |
| Precision micro-cutting for semiconductors | +1.4% | Asia-Pacific core, spill-over to North America | Medium term (2-4 years) |
| AI-based predictive maintenance | +1.1% | Developed markets first, global later | Long term (≥4 years) |
| Source: Mordor Intelligence | |||
Rising demand from EV and consumer-electronics manufacturing
Electric-vehicle platforms required fast, low-heat processing of aluminum battery enclosures, copper busbars, and high-strength chassis parts. Multi-kilowatt fiber lasers cut 6-8 mm aluminum at >20 m/min, enabling Tesla’s and BYD’s capacity expansions.[1]SLTL Group, “What AI and IoT Features Are Becoming Common in Laser Cutting Machinery?” sltl.com Smartphone lines likewise shifted to laser de-panelling of flexible OLED displays and FPC boards; roughly 70% of mobile-phone fabrication steps now employ laser tools. The overlapping needs of automotive thick-plate speed and electronics micro-precision pushed buyers toward configurable cells that handle both extremes inside a common software environment.
Acceleration of Industry 4.0-enabled smart factories
Laser cutters evolved into data nodes inside cloud ecosystems. Trumpf linked machines to AWS platforms for real-time KPI dashboards and AI-driven parameter adjustment. Bystronic’s Smart Factory suite synchronized cutting, material handling, and scheduling, trimming the total cost of ownership by up to 25% for early adopters. Users valued predictive analytics that flagged nozzle wear, lens contamination, and assist-gas spikes days before failures, letting planners avoid weekend stoppages and overtime costs.
Shift toward ultra-high-power fiber lasers for >30 mm steel plate
Commercial releases above 150 kW redefined heavy-plate economics. MAX Laser’s 160 kW source sliced 400 mm carbon steel, collapsing multi-stage flame and plasma routes into single passes. BWT’s 150 kW system cut 200 mm stainless at 2.5× the speed of 60 kW units while saving 77% nitrogen by switching to air assist. Shipyards and bridge yards, therefore, booked high-power capacity to hit delivery schedules without outsourcing flame cutting.
Growing need for precision micro-cutting in semiconductor packaging
5 G and AI chip architectures demanded glass vias and wafer dicing below 3 µm. Synova’s water-jet-guided beams held ±3 µm tolerances at up to 200 mm/s, preventing micro-cracks that plagued mechanical saws. Invisible-cut methods from Han’s Laser formed internal layers, then cleaved wafers externally, eliminating debris and lowering cleaning cycles. Such precision enlarged the application field for ultrafast picosecond lasers in fan-out packaging lines.
Restraints Impact Analysis*
| Restraint | (~) % Impact on CAGR Forecast | Geographic Relevance | Impact Timeline |
|---|---|---|---|
| High capital expenditure | -1.8% | Global, sharpest for SMEs | Short term (≤2 years) |
| Laser-skilled labor shortage | -1.2% | Developed markets with an aging workforce | Medium term (2-4 years) |
| Rare-earth optical component bottlenecks | -0.9% | Europe and North America | Short term (≤2 years) |
| Source: Mordor Intelligence | |||
High capital expenditure and pay-back uncertainty
Mid-range fiber cells cost USD 500,000, and ultra-high-power lines approach USD 3 million, challenging SME budgets when demand forecasts remain fluid. Bystronic’s 2024 orders slid 21%, and the firm posted an operating loss after customers deferred purchases, prompting a 600-position restructuring. Buyers now demand lifecycle models covering energy, consumables, retrofit paths, and resale values before authorizing spending.
Shortage of laser-skilled operators and programmers
Programming 3-D paths and optimizing pierce parameters called for multiyear experience; few training centers supplied. Shops faced months-long hiring lags and rising wages, so builders embedded AI wizards and smartphone-style HMIs. MC Machinery’s GX-F series lets novice users set recipes via guided screens, cutting ramp-up time in half. Automation and nesting software partly offset the human gap, yet the labor constraint still trimmed global uptake.
*Our forecasts treat driver/restraint impacts as directional, not additive. The impact forecasts reflect baseline growth, mix effects, and variable interactions.
Segment Analysis
By Laser Technology: Fiber Dominance Accelerates
Fiber lasers captured 51.72% share of the laser cutting machine market in 2025 and posted a 9.75% CAGR outlook through 2031 as buyers migrated from CO₂ platforms for energy savings and minimal maintenance. Their 30% electrical-to-optical efficiency versus 10-15% for legacy sources cuts utility bills while eliminating mirror alignments.
Ultra-high-power fiber models exceeding 12 kW have begun expanding the laser cutting machine market size for heavy fabrication by replacing plasma on a 230 mm stainless plate. Retrofit programs from Trumpf convert installed CO₂ bases in three days, shortening payback and reducing energy use instantly. Disk, diode-pumped, and hybrid architectures remain in niche roles, yet the trajectory favors fiber as costs decline and beam quality rises.


By Machine Type: 3-D Systems Gain Momentum
2-D flat-bed tools maintained 42.65% laser cutting machine market share in 2025 by servicing mainstream sheet-metal volumes. However, 3-D/5-axis units are forecast to grow 12.6% CAGR to 2031 as OEMs cut formed exhaust manifolds and hydroformed body panels without fixtures.
The sub-segment is on track for doubling its 2022 base as die-less processes slash tooling costs. BLM’s LT-FREE delivered one-cycle trimming of bent and extruded tubes, while GBOS added infinite-rotation heads for burr-free edges. These gains extend to aerospace brackets and lighting fixtures, where geometry complexity once required manual finishing.
By Power Range: Ultra-High Power Drives Growth
Systems rated 2.1-6 kW held a 37.85% share in 2025, balancing speed and operating cost for 6-20 mm plate. Yet platforms above 12 kW will outpace the segment at a 14.3% CAGR, swelling the laser cutting machine market size as factories chase throughput on thick steels.
nLIGHT’s 20 kW trials cut 25 mm carbon steel 40% faster than 12 kW references, proving the business case for fewer shifts per order. Active air-cooling on new 12 kW sources trimmed electrical loads by 30% while maintaining beam stability. Sub-2 kW lines remain indispensable for micro-electronics and medical tubing.
By End-User Industry: Medical Devices Emerge
Automotive and transportation requirements delivered 30.65% of the 2025 revenue pool by cutting multi-material EV chassis. Medical devices, though smaller today, are poised for 9.45% CAGR expansion as catheter, stent, and implant makers demand 0.003-inch kerfs and debris-free edges.
IPG’s move into dedicated medical systems underscored the opportunity, pairing femtosecond sources with vision alignment for disposable instruments. Regulatory shifts toward contamination-free manufacturing favor laser over mechanical slitting, boosting acceptance across cardiovascular, orthopaedic, and neurovascular products.
By Material Thickness: Thick Processing Expands
Sheets between 5.1-20 mm held 44.72% of the laser cutting machine market share in 2025 due to general fabrication demand. Yet >20 mm plate processing will accelerate 12.1% CAGR as bridge decks, ship hulls, and wind-tower flanges migrate from plasma to fiber.
Air-assist techniques on 120 kW heads quadrupled speed and removed nitrogen costs for 25 mm stainless, lifting productivity metrics that once favored oxy-fuel. Light-gauge lines below 5 mm keep gaining in appliances and electronics, where speed trumps thickness capacity.
Geography Analysis
Asia-Pacific led with 45.90% revenue in 2025 and is projected to compound at 10.9% annually to 2031. Chinese builders invested heavily; HSG’s USD 68.3 million Jinan plant targeted 10,000 units a year and unveiled a 120 kW cutter. Government programs treated lasers as strategic, helping the domestic laser cutting machine market scale more than 20% yearly and export globally.
North America and Europe remained technology benchmarks, yet grew more slowly as installed bases matured. Trumpf achieved EUR 5.4 billion (USD 6.23 billion) revenue in fiscal 2023 by bundling automation and software, but Bystronic’s 2024 sales dropped 30% amid hesitant capital budgets. US automotive, aerospace, and space-launch industries still specified premium systems for tolerance-critical parts, even while sourcing cost-sensitive jobs from Asian OEMs.
The Middle East and Africa, and South America presented emerging opportunities tied to infrastructure rollouts and energy diversification. Gulf shipyards adopted 20 kW lines for offshore platforms, while Brazilian automakers upgraded to tube lasers despite currency volatility. Local distributors increasingly partnered with Chinese brands to balance price and after-sales expectations.

Competitive Landscape
Industry structure sat in the mid-fragmented zone. The top three—Trumpf, Bystronic, and IPG Photonics—kept premium positions through vertical integration, AI analytics, and global service. Conversely, Han’s Laser, Bodor, and HSG captured volume tiers with aggressive pricing, annual capacity hikes, and localized spares warehouses.
Strategic moves centered on ultra-high-power breakthroughs, cloud analytics, and turnkey factory cells. MAX Laser and BWT raced past 150 kW thresholds, carving an early-mover moat in thick-plate sectors. Software vendors, meanwhile, fed optimization algorithms into open APIs, giving smaller hardware firms parity on cut quality.
M&A activity focused on niche capabilities: IPG bought Innovative Laser Technologies for medical applications, and Prima Power embedded Siemens controls for smarter feedback loops. Anticipated battlegrounds include AI-first condition monitoring and recycler-friendly rare-earth alternatives that ease supply risk.
Laser Cutting Machine Industry Leaders
Trumpf SE + Co. KG
Han’s Laser Technology Industry Group Co., Ltd.
Bystronic AG
Amada Co., Ltd.
IPG Photonics Corporation
- *Disclaimer: Major Players sorted in no particular order

Recent Industry Developments
- May 2025: Han’s Laser won the dual 2025 Ringier Technology Innovation Awards.
- May 2025: XT Laser introduced “million-watt” fiber laser solutions.
- February 2025: Bystronic reported a 2024 sales decline to CHF 648 million and announced a 600-position restructuring.
- December 2024: HSG Laser opened a USD 68.3 million Jinan facility targeting 10,000 units annually and launched a 120 kW cutter.


Research Methodology Framework and Report Scope
Market Definitions and Key Coverage
Our study defines the laser cutting machine market as revenue generated from new, factory-built fiber, CO₂, and other solid-state laser systems that cut or micro-machine metallic and non-metallic sheets, tubes, and precision parts across industrial plants worldwide. According to Mordor Intelligence, stand-alone power sources, retrofit kits, software licenses, and after-sales services lie outside this scope.
Scope exclusion: Refurbished machines and purely marking or engraving units are not measured.
Segmentation Overview
- By Laser Technology
- CO₂
- Fiber
- Solid-state (Disk, Diode-pumped, etc.)
- Hybrid / Others
- By Machine Type
- 2-D Flat-bed
- 3-D / 5-Axis
- Tube and Pipe
- Micro-cutting / PCB depaneling
- By Power Range
- ≤2 kW
- 2.1–6 kW
- 6.1–12 kW
- >12 kW (ultra-high-power)
- By End-user Industry
- Automotive and Transportation
- Consumer Electronics and Appliances
- Industrial Machinery and Equipment
- Metal Fabrication and Job Shops
- Aerospace and Defense
- Medical Devices
- By Material Thickness
- Thin-sheet ≤5 mm
- Medium 5.1–20 mm
- Thick >20 mm
- By Geography
- North America
- United States
- Canada
- Mexico
- South America
- Brazil
- Argentina
- Rest of South America
- Europe
- Germany
- United Kingdom
- France
- Italy
- Spain
- Russia
- Rest of Europe
- Asia-Pacific
- China
- Japan
- India
- South Korea
- South-East Asia
- Rest of Asia-Pacific
- Middle East and Africa
- Middle East
- Saudi Arabia
- United Arab Emirates
- Turkey
- Rest of Middle East
- Africa
- South Africa
- Nigeria
- Rest of Africa
- Middle East
- North America
Detailed Research Methodology and Data Validation
Primary Research
We hold structured calls with machine builders, laser source manufacturers, integrators, and large fabrication shops spread across Asia-Pacific, North America, and Europe. These conversations validate price bands, utilization rates, and emerging demand pockets such as ultra-high-power (>12 kW) flatbed lines, filling gaps left by published statistics and guiding final triangulation.
Desk Research
Mordor analysts first review freely available tier-1 datasets such as UN Comtrade trade codes for laser machinery, Eurostat PRODCOM output series, United States Census Bureau manufacturing shipments, and industry association briefs from entities such as the Laser Institute of America and CECIMO. Company 10-Ks, investor decks, and press releases clarify recent unit launches and price shifts. Paid repositories, including D & B Hoovers for supplier revenues and Dow Jones Factiva for deal news, enrich our competitive mapping. This list is illustrative; many other public and proprietary references informed the evidence base.
Second, we mine technical literature, patent counts (Questel), and customs records to benchmark adoption of high-power fiber systems across Asia and Europe, providing early signals that desk research alone rarely captures.
Market-Sizing & Forecasting
The top-down model begins with production and trade data to reconstruct the global installed base, which is then adjusted by average selling prices confirmed through channel checks. Select bottom-up lenses, sampled supplier shipments and regional capacity roll-ups, stress-test totals. Key variables include global sheet-metal consumption, automotive and EV build rates, electronics output indices, laser power migration trends, and capital-goods price inflation. A multivariate regression with ARIMA overlays projects these drivers to 2030, while scenario analysis captures currency swings and investment cycles. Any data voids in supplier roll-ups are bridged using midpoint estimates derived from peer pricing spreads observed in interviews.
Data Validation & Update Cycle
Model outputs pass two analyst reviews, anomaly checks against independent indicators such as machine-tool orders, and variance flags beyond ±5%. Reports refresh each year, with interim updates triggered by material events; a fresh validation pass precedes client delivery to keep insights current.
Why Mordor's Laser Cutting Machine Baseline Commands Reliability
Published numbers often differ because firms vary machine classes, power brackets, and refresh cadence.
Mordor's disciplined scope choice, yearly updates, and mixed-method model reduce those biases.
Benchmark comparison
| Market Size | Anonymized source | Primary gap driver |
|---|---|---|
| USD 7.14 B | Mordor Intelligence | - |
| USD 6.85 B | Global Consultancy A | Excludes micro-cutting systems and uses 2024 ASPs without currency realignment |
| USD 7.17 B | Industry Association B | Relies mainly on shipment surveys, omitting channel mark-ups above 10 kW |
| USD 7.00 B | Regional Consultancy C | Forecast built on constant 6% CAGR, lacks driver-level regression and mid-year refresh |
Differences reveal that, while peers offer useful snapshots, Mordor's variables, dual-track validation, and annual refresh provide a balanced baseline clients can trace, question, and repeat with confidence.


Key Questions Answered in the Report
What is the current size of the laser cutting machine market?
It reached USD 7.82 billion in 2026 and is projected to hit USD 12.34 billion by 2031.
Which region leads the laser cutting machine market?
Asia-Pacific held 45.90% of global revenue in 2025 and is expected to grow fastest at 10.9% CAGR through 2031.
Why are fiber lasers overtaking CO₂ systems?
Fiber units deliver three times higher energy efficiency, lower maintenance, and now exceed 12 kW, enabling thick-plate cutting once reserved for plasma.
How fast is the medical-device segment growing?
It is forecast to expand at 9.45% CAGR from 2026 to 2031 as demand for minimally invasive instruments rises.
What is the main barrier for small manufacturers adopting laser cutting?
Up-front investment can exceed USD 500,000 per cell, and payback hinges on throughput forecasts and operator skill availability.
Are ultra-high-power lasers commercially viable?
Yes, 150-160 kW systems have entered shipbuilding and construction lines, processing 200-400 mm plate at competitive costs versus traditional methods.
Page last updated on:


