
Market Overview
| Study Period | 2021 - 2031 |
|---|---|
| Market Size (2026) | USD 3.91 Billion |
| Market Size (2031) | USD 5.69 Billion |
| Growth Rate (2026 - 2031) | 7.78 % |
| Fastest Growing Market | Asia-Pacific |
| Largest Market | Asia Pacific |
| Market Concentration | Medium |
Major Players *Disclaimer: Major Players sorted in no particular order Image © Mordor Intelligence. Reuse requires attribution under CC BY 4.0. | |
Lactic Acid Market Analysis by Mordor Intelligence
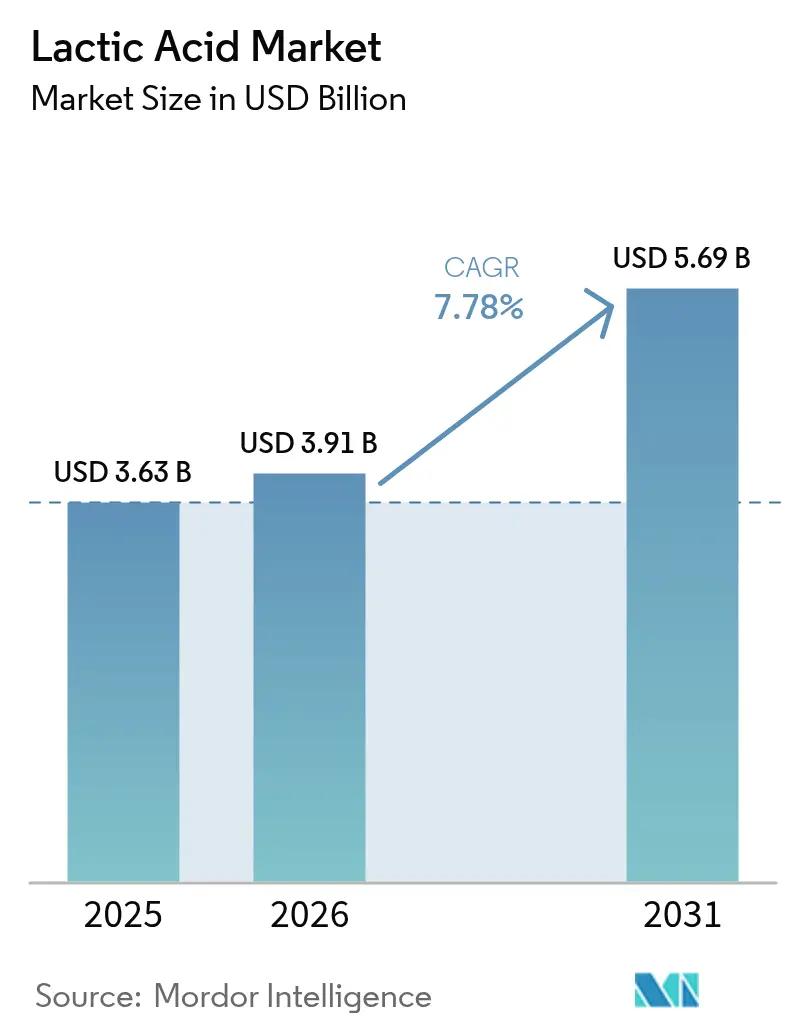
The lactic acid market size was valued at USD 3.63 billion in 2025 and estimated to grow from USD 3.91 billion in 2026 to reach USD 5.69 billion by 2031, at a CAGR of 7.78% during the forecast period (2026-2031). The market expansion is primarily driven by increasing applications in biodegradable plastics, pharmaceutical excipients, and industrial cleaning products. The biodegradable plastics segment is growing due to environmental concerns and strict regulations on conventional plastics. In pharmaceuticals, lactic acid is essential for drug formulations and controlled-release systems. The industrial cleaning sector uses lactic acid for its antimicrobial properties and environmental compatibility. Growth enablers include integrated manufacturing facilities in Asia-Pacific, European regulations limiting single-use plastics, and the US FDA's GRAS (Generally Recognized as Safe) status.[1]Source: U.S. Food and Drug Administration, “Food Additives Status List,” fda.govThe 3D printing segment benefits from lactic acid-based materials that provide enhanced mechanical properties and biocompatibility. The industry maintains competitiveness through vertical integration, diverse feedstock sources, and process optimization, enabling manufacturers to manage raw material price fluctuations effectively. This includes implementing advanced fermentation technologies, efficient purification processes, and developing strategic partnerships throughout the value chain.
Key Report Takeaways
- By source, natural fermentation captured 87.62% of the lactic acid market share in 2025 and is forecast to grow at 8.21% CAGR through 2031.
- By form, the liquid segment accounted for 64.10% share of the lactic acid market size in 2025; the solid form exhibits an 8.53% CAGR through 2031.
- By grade, food grade led with 42.20% revenue share in 2025; industrial grade is projected to expand at an 11.08% CAGR to 2031.
- By application, food and beverages held 32.65% of the lactic acid market share in 2025, whereas the PLA and bioplastics segment is advancing at an 11.49% CAGR through 2031.
- By geography, Asia-Pacific commanded 30.72% of the lactic acid market share in 2025 and is forecast to grow at 8.95% CAGR through 2031.
Note: Market size and forecast figures in this report are generated using Mordor Intelligence’s proprietary estimation framework, updated with the latest available data and insights as of 2026.
Market Trends and Insights
Drivers Impact Analysis of Lactic Acid Market*
| Driver | (~) % Impact on CAGR Forecast | Geographic Relevance | Impact Timeline |
|---|---|---|---|
| PLA-driven demand for biodegradable plastics | +2.1% | Global with APAC and Europe leadership | Long term (≥ 4 years) |
| Food and beverage preservative and flavor uses | +1.8% | North America and Europe | Medium term (2-4 years) |
| Pharmaceutical formulations and excipients | +1.3% | North America and Europe | Long term (≥ 4 years) |
| Personal care and cosmetics expansion | +0.9% | Premium markets worldwide | Medium term (2-4 years) |
| Industrial cleaning formulations | +0.7% | Global industrial hubs | Short term (≤ 2 years) |
| Animal feed additives | +0.5% | APAC and Europe | Medium term (2-4 years) |
| Source: Mordor Intelligence | |||
PLA-driven Demand for Biodegradable Plastics
The evolution of lactic acid from a food additive to a polymer precursor is driving significant market growth, with Polylactic Acid (PLA) applications contributing to the overall market CAGR. NatureWorks' USD 600 million facility in Thailand, scheduled for commercial operation by 2025, demonstrates this transition by combining lactic acid production, lactide synthesis, and PLA polymerization in a single facility. The facility's integrated approach aims to optimize production efficiency and reduce operational costs. The European Union's Single-Use Plastics Directive supports market growth by requiring biodegradable alternatives for specific packaging applications, creating a regulatory framework that favors PLA adoption[2]Source: USDA Agricultural Research Service, “Poultry Pathogen Reduction With Lactic Acid Rinses,” usda.gov. The planned Emirates Biotech facility in the UAE, set to become the world's largest PLA plant, indicates increasing Middle Eastern investment in this market and highlights the region's commitment to sustainable materials production. The expansion of PLA technology into 3D printing filaments and medical devices has broadened its market potential, offering innovative solutions for manufacturing and healthcare applications. FDA approval of poly-L-lactic acid for facial fat loss treatment demonstrates its versatility and safety profile in high-value medical segments. The combination of supportive regulatory frameworks, continuous technological progress, and increased manufacturing capacity establishes PLA as the main driver of lactic acid market growth through 2030, reshaping the industry landscape and creating new opportunities for sustainable material solutions.
Food and Beverage Preservative and Flavor Uses
The food and beverage sector remains the largest end-market for lactic acid, with growth supported by increasing demand for clean-label products and natural preservation methods. The FDA's designation of lactic acid as Generally Recognized as Safe (GRAS), with restrictions limited to good manufacturing practices, provides food manufacturers with comprehensive regulatory guidance for product formulation, safety compliance, and quality control measures. USDA research confirms lactic acid's effectiveness in reducing Salmonella in poultry applications, demonstrating pathogen reduction rates in controlled studies and expanding its use beyond traditional dairy fermentation processes.[3]Source: European Commission, “Directive on Single-Use Plastics,” ec.europa.euThe antimicrobial properties of lactic acid have been extensively documented across various food matrices, showing particular efficacy in meat and poultry processing environments. The European Food Safety Authority encourages lactic acid concentrations of 2-5% for beef carcass decontamination, strengthening its role in food safety protocols, microbial control strategies, and overall meat processing hygiene standards. In the plant-based dairy segment, manufacturers utilize specific lactic acid bacteria strains to reduce off-flavors, enhance nutrient absorption, and improve texture profiles, creating product differentiation opportunities through improved organoleptic properties, functional benefits, and extended shelf life. The application of lactic acid in plant-based dairy alternatives has also shown promising results in protein stabilization and flavor development, particularly in fermented products like yogurt alternatives and cheese substitutes.
Pharmaceutical Formulations and Excipients
The pharmaceutical industry's adoption of lactic acid derivatives is driven by their biocompatibility, proven safety record, and regulatory acceptance in parenteral formulations. Corbion maintains a unique market position as the only supplier of calcium lactate with a Certificate of Suitability from the European Directorate for the Quality of Medicines, reflecting strict quality requirements and comprehensive documentation standards in pharmaceutical-grade applications. The FDA's acceptance of ASTM F2579-18 as a standard specification for amorphous poly(lactide) resins in surgical implants has expanded the use of lactic acid derivatives in medical devices, particularly in biodegradable implants and drug delivery systems. Recent research focuses on L-lactide synthesis from lactic acid for PLA pellet production, establishing comprehensive laboratory-scale technology for medical applications, including controlled release formulations and tissue engineering scaffolds. L-lactic acid's function extends beyond its role as an excipient, serving as an agonist of hydroxycarboxylic acid receptor 1 (HCA1), which opens possibilities for targeted therapeutic interventions. The combination of therapeutic potential, proven safety profiles, established manufacturing processes, and stringent regulatory compliance makes pharmaceutical applications a high-value market segment with substantial entry barriers, including extensive documentation requirements and specialized production capabilities.
Personal Care and Cosmetics Expansion
Personal care and cosmetics applications growth is driven by lactic acid's effectiveness as an alpha-hydroxy acid and supportive regulations. The Australian Government permits lactic acid use in cosmetic products at concentrations up to 30%, with requirements for appropriate labeling due to potential skin sensitization. This regulation ensures consumer safety while enabling manufacturers to develop effective skincare formulations across various product categories, including serums, moisturizers, and chemical peels. The European Commission's Scientific Committee on Consumer Products sets safety parameters, recommending lactic acid use at 2.5% maximum concentration with pH 5.0, which balances product efficacy with user safety. These guidelines have facilitated the development of innovative formulations in both mass-market and luxury skincare segments. The European Chemicals Agency's REACH registration, covering 100-1,000 tonnes annually in 2023, indicates established supply chains for cosmetic applications and demonstrates the ingredient's widespread adoption across the European personal care industry. Consumer demand for natural active ingredients, combined with lactic acid's exfoliating and moisturizing benefits, supports growth in premium personal care formulations that offer higher margins compared to commodity uses. These properties make lactic acid particularly valuable in anti-aging products, facial cleansers, and professional skincare treatments, where its ability to improve skin texture, reduce fine lines, and enhance cellular turnover drives product efficacy and consumer satisfaction.
Restraints Impact Analysis of Lactic Acid Market*
| Restraint | (~) % Impact on CAGR Forecast | Geographic Relevance | Impact Timeline |
|---|---|---|---|
| High production costs compared to conventional alternatives | -1.4% | Global, particularly affecting price-sensitive applications | Medium term (2-4 years) |
| Fluctuating raw material prices, particularly corn and sugarcane | -0.8% | Americas and APAC agricultural regions | Short term (≤ 2 years) |
| Competition from synthetic alternatives | -0.6% | Global industrial applications | Long term (≥ 4 years) |
| Storage and transportation challenges due to chemical properties | -0.3% | Global supply chain operations | Medium term (2-4 years) |
| Source: Mordor Intelligence | |||
Industrial Cleaning Formulations
Production costs significantly constrain market growth, particularly affecting lactic acid's competitiveness in price-sensitive industrial applications. The fermentation-based production process requires substantial capital investment in specialized bioreactors, advanced separation equipment, and complex purification systems compared to synthetic chemical routes, despite its environmental advantages. Corbion's 2024 capital market presentation emphasizes comprehensive operational efficiency improvements and strategic restructuring initiatives to address persistent cost competitiveness challenges. The current cost structure substantially impacts commodity applications where lactic acid directly competes with synthetic preservatives and acidulants, limiting market penetration in price-sensitive segments despite its superior environmental benefits and sustainable characteristics. The high production costs affect the entire value chain, from raw material procurement to final product distribution, creating additional challenges for manufacturers seeking to maintain competitive pricing while ensuring product quality and sustainability standards.
Raw-material Price Volatility
The natural lactic acid market relies heavily on agricultural commodities, with corn and sugarcane serving as the primary feedstocks for production. The integrated sugar mill approach implemented in India provides significant cost benefits through the efficient utilization of sugarcane bagasse, transforming agricultural waste into valuable products. However, this method faces considerable limitations due to seasonal availability patterns and unpredictable agricultural market fluctuations. NatureWorks' strategic facility placement in Thailand enables local sugarcane sourcing, which effectively reduces transportation costs and minimizes supply chain vulnerabilities. Nevertheless, the facility's operations remain subject to regional agricultural conditions that directly influence raw material availability and quality. Current research initiatives exploring corn stover for lactic acid production demonstrate promising potential for reducing dependence on food-grade feedstocks, though the commercial implementation of these processes requires further development and validation. The market faces additional complexity due to intense competition from ethanol and biofuel producers targeting the same agricultural feedstocks. This competition generates significant upward pressure on raw material costs, particularly during periods characterized by elevated energy prices or when governments expand biofuel mandates.
*Our forecasts treat driver/restraint impacts as directional, not additive. The impact forecasts reflect baseline growth, mix effects, and variable interactions.
Lactic Acid Market Segment Analysis
By Source:
Natural Fermentation Dominates Amid Bio-Based PreferencesNatural fermentation accounts for 87.62% of the lactic acid market share in 2025 and is expected to grow at an 8.21% CAGR through 2031. Consumer preference for bio-based products stems from increasing awareness of sustainable production methods and environmental concerns. Food safety regulations supporting naturally derived acids, particularly in food and beverage applications, further reinforce the dominance of this production method. Synthetic production, primarily from petroleum intermediates, serves specific industrial segments where cost is the primary consideration, such as in chemical manufacturing and industrial applications.
Technological advancements in natural fermentation include multi-substrate processing, which allows for simultaneous fermentation of different raw materials, gene-edited Lactobacillus strains that improve conversion efficiency, and in situ product removal techniques that increase production yields. The successful implementation of demonstration projects using fruit waste and lignocellulosic residues indicates the potential for scaled production without competing with food crops. These alternative feedstock sources include agricultural residues, food processing waste, and forestry byproducts. This feedstock diversification helps protect the lactic acid market against fluctuations in grain prices while promoting circular economy principles.




By Form:
Liquid Applications Drive Market Despite Solid Growth PotentialLiquid lactic acid held a 64.10% revenue share in 2025, due to its compatibility with direct pumping systems in food, pharmaceutical, and clean-in-place (CIP) applications. This form maintains its market dominance because most industrial bioreactors and downstream filling equipment are specifically designed and optimized for liquid handling operations. The extensive infrastructure investment in liquid handling systems across industries further reinforces this dominance. The solid form segment is growing at an 8.53% CAGR, driven by increased adoption in animal feed premixes and dry-blend personal care products, particularly in regions with challenging storage and transportation conditions. The growth is also supported by the rising demand for extended shelf-life products and easier handling in bulk manufacturing processes.
Recent technological advancements in spray drying and crystallization processes enable manufacturers to maintain high product purity levels while significantly reducing shipping weights. These improvements include optimized particle size distribution and enhanced moisture control systems. New hybrid systems combining membrane technology and evaporation processes reduce energy consumption by more than 10%, according to pilot studies conducted across multiple production facilities. These efficiency improvements are gradually reducing the historical price difference between liquid and solid forms, making solid lactic acid increasingly competitive in various applications. The development of specialized packaging solutions and improved storage stability has further enhanced the appeal of solid lactic acid in emerging markets.
By Grade:
Industrial Applications Accelerate Beyond Food DominanceFood-grade lactic acid held 42.20% of the market share in 2025. The segment's dominance stems from widespread use in food preservation, flavor enhancement, and pH regulation across the food and beverage industry. The increasing consumer preference for natural preservatives and clean-label products further strengthens its market position. Industrial grade is experiencing significant growth with an 11.08% CAGR, driven by increased demand in PLA polymerization and environmental cleaning applications. The expanding bioplastics sector, stringent regulations on conventional plastics, and growing preference for eco-friendly cleaning solutions contribute to this growth trajectory. The pharmaceutical grade segment maintains high profit margins due to GMP certification requirements and limited supplier availability, as demonstrated by Corbion's exclusive European rights for calcium lactate production.
Industrial applications prioritize optical purity over food safety requirements. This allows manufacturers to reduce decolorization processing steps, increasing production capacity and reducing operational costs. The streamlined manufacturing process enables producers to maintain consistent quality while optimizing resource utilization. The resulting production flexibility enables competitive pricing for bioplastics contracts, contributing to market expansion. This cost advantage has particularly strengthened the position of industrial-grade lactic acid in emerging applications and new market segments, including biodegradable packaging materials, sustainable textiles, and green solvents for industrial cleaning.

By Application:
PLA Transformation Reshapes Traditional Food FocusFood and beverages maintain a 32.65% share of 2025 revenue, while PLA demonstrates strong growth at 11.49% annually. Traditional applications include dairy fermentation, meat processing, and beverage acidification. Packaging regulations, increased adoption of 3D printing, and expanding medical applications support this growth trajectory. The market's diversification across personal care, pharmaceuticals, and industrial cleaners helps mitigate cyclical risks.
While food applications provide a stable baseline demand, manufacturers are directing new investments toward polymer production capabilities in response to supportive regulations and increased commitment to bio-based plastics from brand owners. Personal care and cosmetics applications benefit from established regulatory frameworks and consumer acceptance of alpha-hydroxy acids in skincare formulations. Pharmaceutical and healthcare applications command premium pricing due to stringent quality requirements and specialized manufacturing processes. Industrial and chemical processing represents an emerging growth area, particularly in cleaning formulations where lactic acid's antimicrobial properties and biodegradability offer advantages over synthetic alternatives. The application diversification reflects lactic acid's evolution from a single-use food additive to a platform chemical with multiple high-value end markets.
Geography Analysis
APAC Lactic Acid Market
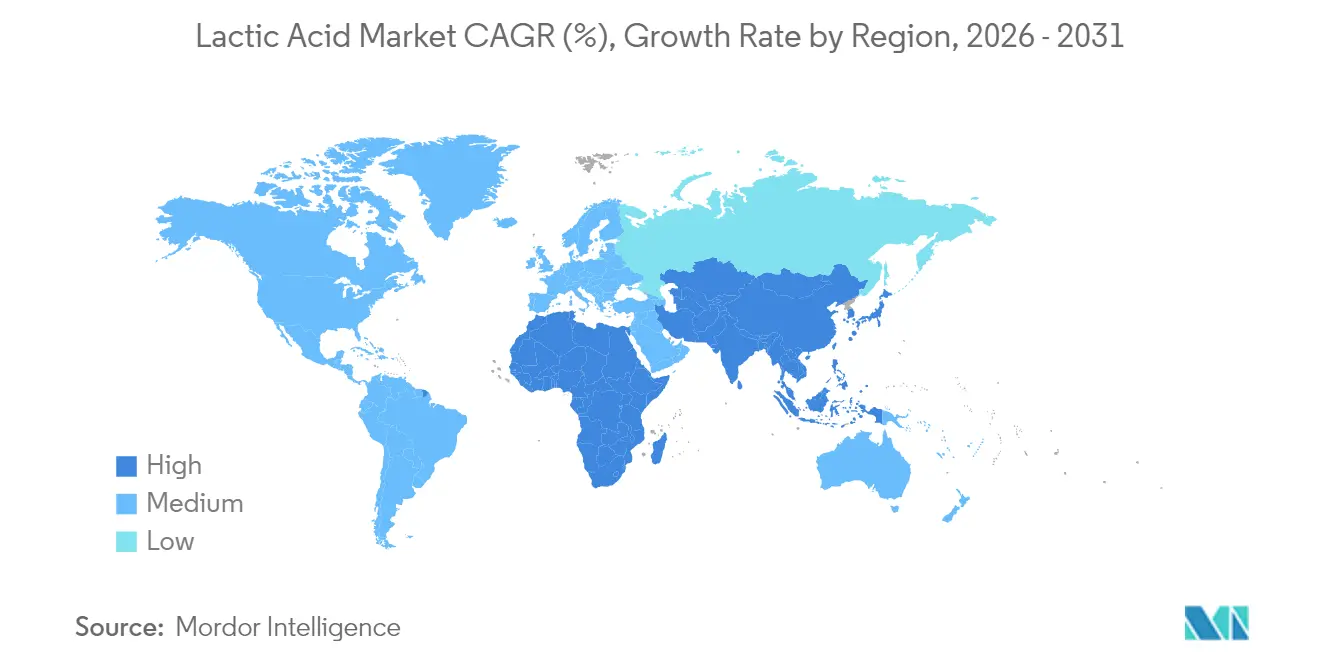
Asia-Pacific held a 30.72% market share in 2025 and is expected to grow at a 8.95% CAGR through 2031. The region maintains a competitive advantage through integrated manufacturing facilities in Thailand, China, and India, which benefit from readily available sugarcane and corn feedstock, along with lower capital expenditure requirements per installed ton. NatureWorks' Thailand facility exemplifies this regional strategy by combining local feedstock availability, economies of scale, and strategic proximity to export ports. The market growth is further supported by increasing domestic demand for disposable food service items and regulatory requirements for compostable shopping bags.
North America Lactic Acid Market
North America maintains its market position through established corn-wet-milling infrastructure, sophisticated bioprocessing capabilities, and well-defined regulatory frameworks. The region focuses on high-value applications in medical, personal care, and food safety sectors. Despite increased PLA packaging imports from Asia, the North American market remains stable due to corporate preferences for local sourcing to reduce scope 3 emissions.
Europe Lactic Acid Market
Europe's market growth is primarily driven by the Single-Use Plastics Directive, which encourages manufacturers to adopt compostable alternatives. Companies like Galactic and Jungbunzlauer have adapted to regulatory requirements, establishing strong positions in pharmaceutical and cosmetic applications. While agricultural price fluctuations affect adoption rates, Green Deal initiatives continue to support investments in regional fermentation facilities.

Regulatory Landscape
In the United States, lactic acid is affirmed as Generally Recognized as Safe (GRAS) for use in food under 21 CFR 184.1061, with use subject to current good manufacturing practice (CGMP) and excluding infant foods. This GRAS status, alongside FDA food additive listings, supports broad use in food and beverage formulations where lactic acid functions as an acidulant, flavoring agent, and processing aid, depending on the application.
In the European Union, lactic acid is authorized as a food additive (E 270) under Regulation (EC) No 1333/2008, with specifications set under Commission Regulation (EU) No 231/2012. In February 2025, the European Commission adopted Regulation (EU) 2025/2058 amending Annexes II and III of Regulation (EC) No 1333/2008. In March 2025, EFSA opened a call for analytical and use-level data for lactic acid (E 270), which increases the need for updated compliance documentation and usage monitoring across European food and beverage value chains.
Competitive Landscape
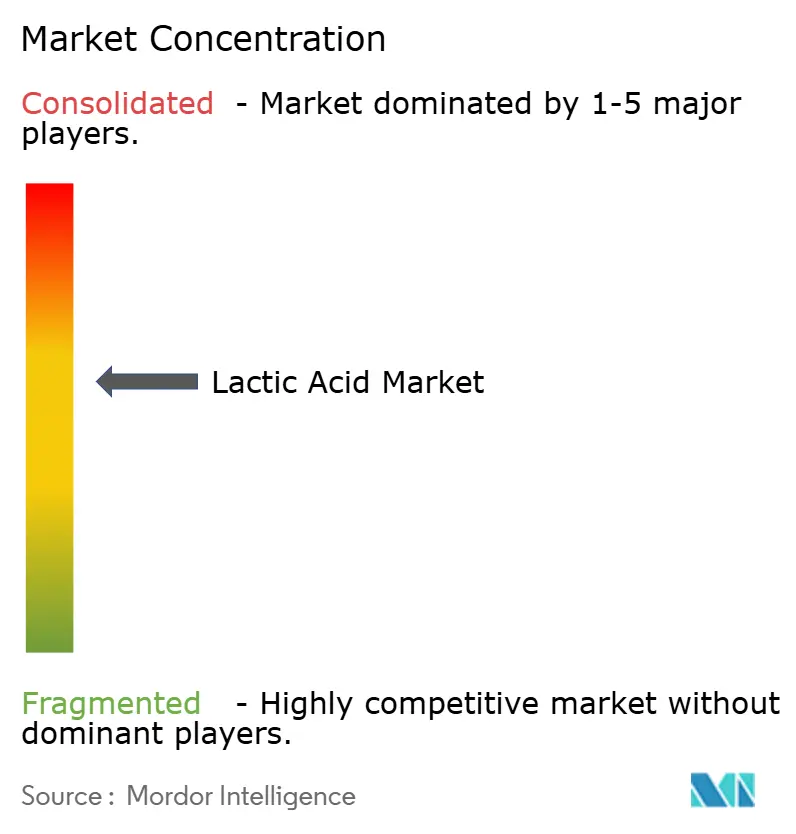
The market demonstrates moderate competition, with the top five companies accounting for a major share of total revenue. Corbion, Cargill, and Galactic maintain their market positions through established fermentation expertise, proprietary bacterial cultures, and integrated polymer production facilities. NatureWorks, a joint venture between Cargill and PTT Global Chemical, benefits from secured internal polylactic acid (PLA) production capabilities.
Companies are forming strategic partnerships to access new raw materials and strengthen customer relationships. Corbion's expansion of production capacity in Thailand complements its PLA joint venture operations, highlighting the significance of regional manufacturing centers. Emirates Biotech's collaboration with Sulzer for its UAE-based PLA facility signals the Gulf region's entry into the market, supported by strong financial resources and economic diversification initiatives.
While technology barriers remain moderate, established companies maintain competitive advantages through regulatory approvals in pharmaceutical and food applications. Start-up companies are developing alternative production methods, including lignocellulosic feedstock processing, electro-fermentation, and enzyme recycling technologies. These innovations could reduce production costs by 20-30% at commercial scale. Patents covering modified Lactobacillus strains and solvent-free separation processes are becoming crucial for competitive advantage in the industry.
Lactic Acid Industry Leaders
Corbion NV
Henan Jindan Lactic Acid Technology Co., Ltd
Galactic S.A.
Cargill Incorporated
Jungbunzlauer Suisse AG
- *Disclaimer: Major Players sorted in no particular order
Lactic Acid Market Companies Covered in this Report
- Corbion N.V.
- Cargill Incorporated
- Galactic S.A.
- Henan Jindan Lactic Acid Technology Co. Ltd.
- Jungbunzlauer Suisse AG
- Musashino Chemical Laboratory, Ltd.
- Futerro S.A.
- BBCA Biochemical
- Shandong Baisheng Biotech
- Cellulac Ltd.
- NatureWorks LLC
- Zhengzhou Tianrun
- Anhui COFCO Biochemical
- Qingdao Abel Technology
- TotalEnergies Corbion
- Zhejiang Huakang Pharmaceutical Co.
- Synbra Technology
- Henan Shenzhou Biochem
- Sulzer Chemtech
- Wei Mon Industry Co. (Unitika PLA JV)

Market Opportunities and Future Outlook
Investment programs that combine lactic acid, lactide, and PLA in a single footprint are creating room for suppliers that can deliver optical purity, consistent fermentation performance, and downstream purification at scale. In May 2025, Futerro and Galactic announced an approximately EUR 500 million circular biorefinery project in Normandy, France, aimed at producing lactic acid, lactide, and PLA (including a dedicated unit for agri-food lactic acid derivatives). This multi-product configuration supports both commodity PLA demand and higher-margin food and derivative streams, while also improving European sourcing options where packaging sustainability requirements are tightening.
Processing-capability additions in fermentation-linked regions also open opportunities tied to local feedstocks and shorter supply chains. In July 2025, GIG Karasek secured a contract to supply a large-scale dehydration and distillation plant for Balrampur Chini Mills Ltd. in Uttar Pradesh, India, for lactic acid processing, with operations scheduled to begin in Q2 2026. On the demand side, clearer pathways for agricultural and food-adjacent uses expand addressable applications: in August 2024, the US EPA issued a final rule exempting lactic acid and L-lactic acid from tolerance requirements when used as a plant growth regulator or as a fruit and vegetable wash on raw agricultural commodities, supporting formulators that position lactic acid as a bio-based antimicrobial and processing input across food and crop-handling use cases.
Recent Industry Developments in Lactic Acid Market
- April 2026: Cargill completed a modernization project at its Baupte, France site that cut total site CO2 emissions by 45% using Mechanical Vapor Recompression (MVR) technology, supported by an investment of about EUR 25 million. The upgrade improves both cost and sustainability credentials for fermentation-linked ingredient production in Europe, where customers increasingly assess scope 1 and 2 emissions in bio-based supply chains.
- April 2026: Corbion reported in its Q1 2026 interim management statement that lactic acid sales into PLA markets increased substantially in volume and mix versus Q1 2025, while overall pricing moved down with lower input costs under pass-through mechanisms. The update points to how PLA-linked demand can lift volumes even when realized pricing follows feedstock movements, shaping contract structures and capacity planning for suppliers serving bioplastics customers.
- August 2024: Jungbunzlauer introduced L(+)-lactic acid as an environmentally sustainable disinfectant within its biocidal product range, positioned for efficacy at low concentrations while remaining biodegradable. The launch expands lactic acid demand beyond food and PLA into industrial and institutional cleaning formulations, supporting diversification toward applications that value antimicrobial performance and environmental compatibility.


Lactic Acid Market Report Scope and Research Methodology
Market Definition and Coverage
This market covers revenues generated from lactic acid sold into end uses such as food and beverage, industrial uses, pharmaceuticals, personal care, and polymer related applications, measured across major producing and consuming regions.
Scope exclusions: It does not count finished downstream products where lactic acid is only an ingredient (for example, packaged foods or final bioplastic articles).
Segments Covered in This Report
- By Source
- Natural
- Synthetic
- By Form
- Liquid
- Solid
- By Grade
- Food Grade
- Industrial Grade
- Pharmaceutical Grade
- Cosmetic Grade
- By Application
- Food and Beverages
- Meat, Poultry and Seafood
- Dairy Products
- Bakery
- Confectionery
- Beverages
- Others Food and Beverage Applications
- Polylactic Acid (PLA) and Bioplastics
- Personal Care and Cosmetics
- Pharmaceutical and Healthcare
- Industrial and Chemical Processing
- Food and Beverages
- By Geography
- North America
- United States
- Canada
- Mexico
- Rest of North America
- Europe
- United Kingdom
- Germany
- France
- Italy
- Spain
- Russia
- Rest of Europe
- Asia-Pacific
- China
- India
- Japan
- Australia
- Rest of Asia-Pacific
- South America
- Brazil
- Argentina
- Rest of South America
- Middle East and Africa
- Saudi Arabia
- South Africa
- Rest of Middle East and Africa
- North America
Data Sources, Market Sizing, and Validation
Desk Research
Desk work starts by mapping the supply chain and checking where volumes and pricing can be observed in public sources. We rely on items such as customs and trade statistics, national industrial output series, environmental and plastics policy publications, and public standards and safety references (for example, FDA GRAS listings and EU circular economy documentation) to ground the demand context.
After that, the model gets filled with company disclosures and market signals that can be cross-checked, such as annual reports, investor presentations, plant expansion notes, and trusted press coverage on capacity additions. Select paid subscriptions were used for company financials and intelligence, plus patent databases and shipment-level import and export data where it helped validate trade-linked flows. The sources mentioned above are illustrative and not exhaustive, and many other references were also used for collection, validation, and clarification.
Primary Interviews and Surveys
Primary work was used to pressure-test the desk assumptions around grade mix, pricing spreads, and how much demand is actually tied to PLA and other polymer pathways. We spoke with a balanced set of producers, distributors, and large buyers across APAC, EMEA, and the Americas, and then used follow-up calls when inputs like utilization or contract pricing moved the totals too far from observed signals.
Distribution of primary research fieldwork respondents
| Company type | Respondent position | Region |
|---|---|---|
| Top tier: 25% | CXOs: 18% | APAC: 48% |
| Mid tier: 56% | Functional/Unit leaders: 28% | EMEA: 34% |
| Smaller Players: 19% | Managers: 54% | Americas: 18% |
Market-Sizing & Forecasting
For sizing, we start with a top-down build where production, trade movements, and visible consumption cues are used to reconstruct the addressable demand pool for lactic acid by region. Once the regional totals are shaped, the results are corroborated with selective bottom-up approximations, such as sampled supplier revenue checks, channel feedback on average selling prices, and volume math tied to major end-use pockets, which are then adjusted when the two views drift.
Key inputs used in the model include fermentation capacity additions and utilization ranges, regional trade balance direction (net import or export), price movement by grade, PLA-linked demand indicators, and application-side activity in food and beverage and industrial cleaning. Forecasts were built using scenario analysis, since capacity ramps and policy-driven biodegradable material adoption can shift faster than a straight line trend. Where bottom-up data is missing for smaller end users, gaps are handled through conservative penetration and mix assumptions that were validated during interviews.
Data Validation & Update Cycle
Outputs are checked against independent signals such as capacity announcements, import and export patterns, and observed price ranges before they are finalized. If a region shows an unusual jump, we revisit the drivers, re-check unit assumptions, and re-contact selected participants to confirm what changed.
Every model pass goes through multi-step analyst reviews, followed by a final variance scan to make sure totals reconcile across regions and applications. The report is refreshed annually, and interim updates are made when material events occur such as large capacity start-ups, shutdowns, or policy shifts. Before delivery, a fresh review is completed so clients receive an updated view aligned with the most recent information.
Mordor Intelligence's Lactic Acid Market Estimate Compared With Other Published Estimates
Published market sizes for lactic acid often vary even when the topic sounds the same, because teams do not always use the same unit of measurement, year basis, or application coverage. Differences also show up when one estimate is built from capacity and trade signals, while another leans more on broad demand narratives and aggressive growth expectations.
Finished PLA packaging and other converted bioplastic products sit outside Mordor Intelligence's scope, which can pull the total away from sources that blend resin building blocks with finished goods revenues. The gap can widen further when analysts use different price points for food grade versus industrial grade, apply different currency conversion timing, or update assumptions at different intervals during the year.
Benchmark comparison
| Source | Market Size | Gaps in Research Methodology |
|---|---|---|
| Mordor Intelligence | USD 3.91 B (2026) | |
| Industry Publisher A | USD 3.30 B (2024) | Uses an earlier base year and applies a faster growth path to 2032, and the estimate may not reconcile volumes against trade balance and capacity utilization checks consistently across regions. |
| Industry Publisher B | USD 2.70 B (2024) | Uses a lower starting value that can come from narrower realized pricing assumptions and different treatment of application splits, which can understate polymer-linked demand signals in high growth regions. |
Across the three figures, the spread is mainly explained by what is counted as the market and how pricing and application mix are carried into the base year. By anchoring the size to observable supply-demand signals and then stress-testing it with interview-based checks, the final value stays traceable to clear inputs and can be repeated when new capacity, trade, or pricing data becomes available.


Key Questions Answered in the Report
What is the current size of the lactic acid market?
The lactic acid market is valued at USD 3.91 billion in 2026 and is projected to reach USD 5.69 billion by 2031
Which region holds the largest share of the lactic acid market?
Asia-Pacific commands the largest regional share at 30.72% in 2025 and is also the fastest-growing region with a 8.95% CAGR through 2031
What application is expanding most rapidly for lactic acid?
Polylactic acid (PLA) and other bioplastics use is the fastest-growing application, advancing at an 11.49% CAGR thanks to demand for compostable packaging and 3D-printing materials
Who are the leading players in the lactic acid market?
Corbion, Cargill/NatureWorks, and Galactic lead global supply with integrated fermentation and PLA operations, together holding roughly two-thirds of worldwide revenue.
Page last updated on:


 Your data is secure and never sold or shared.


