Laboratory Proficiency Testing Market Size and Share
Market Overview
| Study Period | 2020 - 2031 |
|---|---|
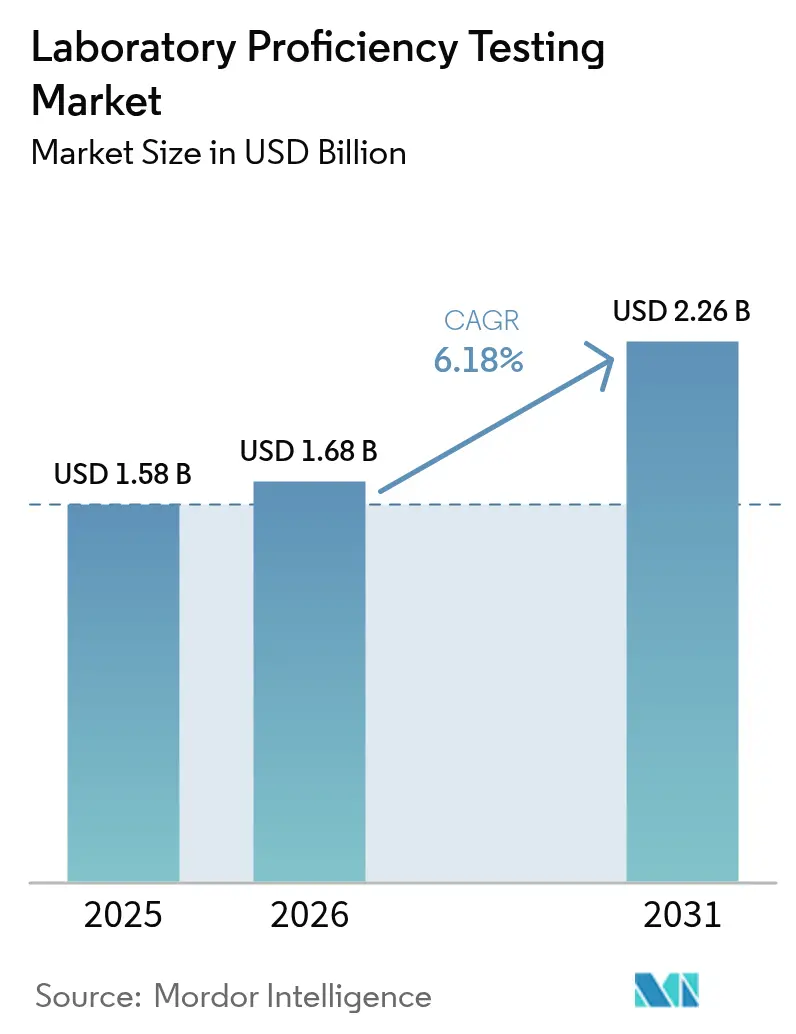
| Market Size (2026) | USD 1.68 Billion |
| Market Size (2031) | USD 2.26 Billion |
| Growth Rate (2026 - 2031) | 6.18% CAGR |
| Fastest Growing Market | Asia Pacific |
| Largest Market | North America |
| Market Concentration | Medium |
Major Players *Disclaimer: Major Players sorted in no particular order Image © Mordor Intelligence. Reuse requires attribution under CC BY 4.0. | |
Laboratory Proficiency Testing Market Analysis by Mordor Intelligence
The laboratory proficiency testing market size is expected to grow from USD 1.58 billion in 2025 to USD 1.68 billion in 2026 and is forecast to reach USD 2.26 billion by 2031 at 6.18% CAGR over 2026-2031. This trajectory reflects a shift from compliance-only participation toward strategic quality differentiation as regulators tighten analytical performance criteria and as laboratories deploy more advanced molecular and cell-based assays. Revised CLIA grading for blood alcohol and blood lead testing that took effect in January 2025 has already raised precision expectations across North American clinical laboratories [1]Source: Centers for Medicare & Medicaid Services, “QSO-25-10-CLIA,” cms.gov . Food-, water- and environmental-testing laboratories face parallel pressures under the FDA’s LAAF program and the EPA’s new PFAS methods, accelerating demand for validated external quality assessment[2]Source: U.S. Environmental Protection Agency, “Clean Water Act Methods Update Rule for the Analysis of Effluent,” epa.gov Provider preferences continue to tilt toward vendor-neutral schemes, while digital platforms begin to streamline result analytics—signals that the laboratory proficiency testing market is becoming an operational performance lever rather than a regulatory obligation.
Key Report Takeaways
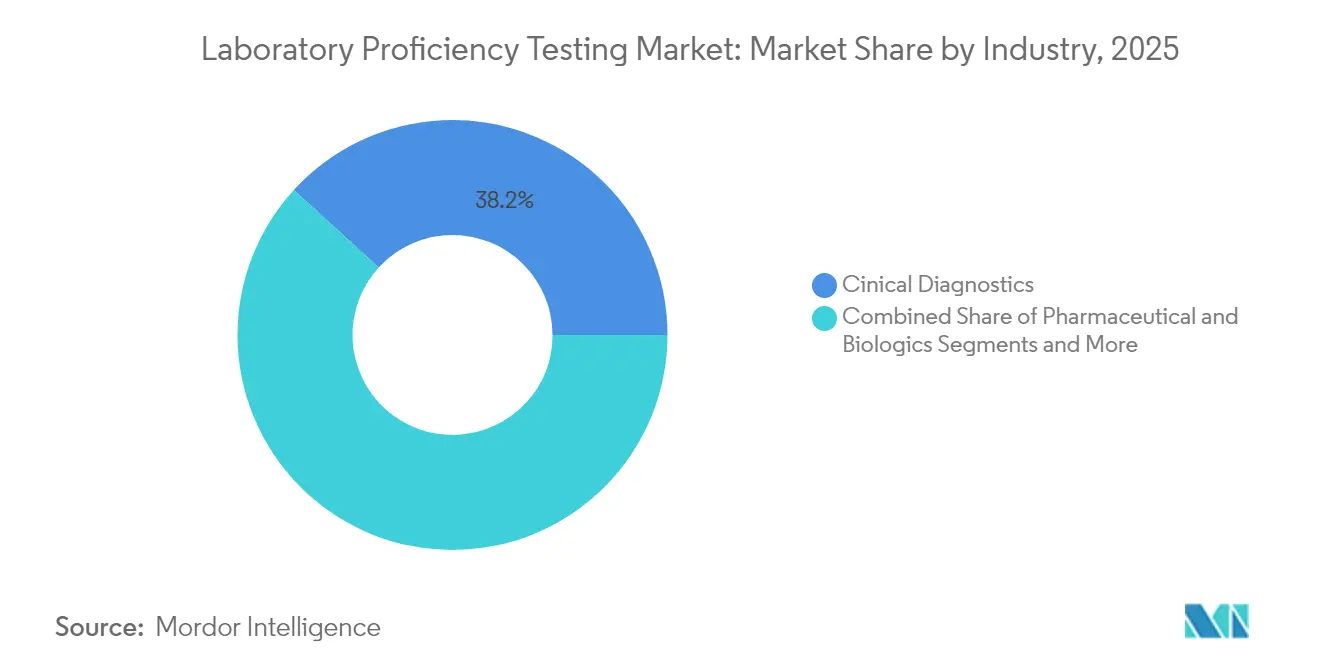
- By industry, Clinical Diagnostics led with 38.21% of laboratory proficiency testing market share in 2025; Pharmaceutical & Biologics is forecast to grow at 7.32% CAGR to 2031.
- By technology, Cell Culture-based Assays accounted for 27.10% share of the laboratory proficiency testing market size in 2025, while PCR & Molecular Methods are advancing at a 6.94% CAGR through 2031.
- By provider type, Independent/Third-party Providers held 54.02% of laboratory proficiency testing market share in 2025 and are expanding at an 7.78% CAGR through 2031.
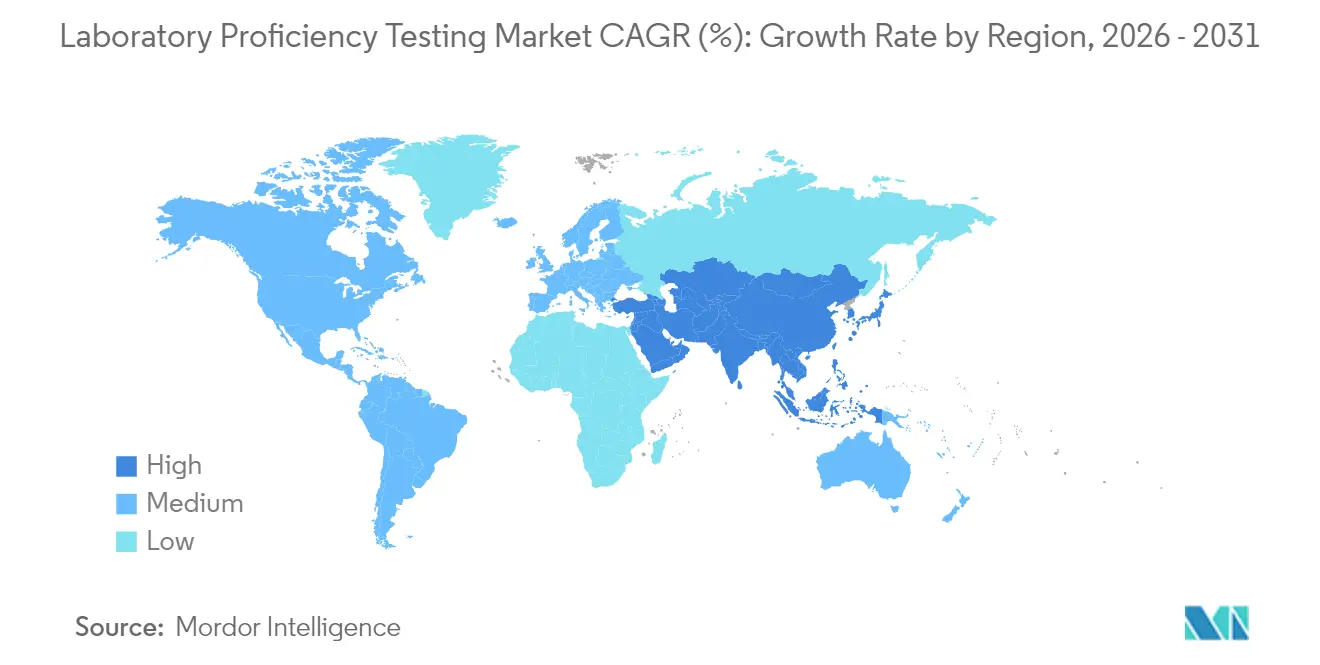
- By geography, North America commanded 41.98% revenue share in 2025, whereas Asia-Pacific is projected to record the fastest 7.96% CAGR to 2031.
Note: Market size and forecast figures in this report are generated using Mordor Intelligence’s proprietary estimation framework, updated with the latest available data and insights as of 2026.
Global Laboratory Proficiency Testing Market Trends and Insights
Drivers Impact Analysis*
| Driver | (~) % Impact on CAGR Forecast | Geographic Relevance | Impact Timeline |
|---|---|---|---|
| Stricter ISO/IEC 17025 & 17043 accreditation mandates | +1.8% | Global, with early adoption in North America & EU | Medium term (2-4 years) |
| Growing clinical diagnostics volume amid chronic disease burden | +1.5% | Global, concentrated in developed markets | Long term (≥ 4 years) |
| Tightening food & water-safety regulations worldwide | +1.2% | Global, with regulatory leadership in North America | Short term (≤ 2 years) |
| Biologics manufacturing boom demanding validated analytical methods | +1.0% | North America & EU core, expansion to APAC | Medium term (2-4 years) |
| Legalization of cannabis & psychedelics spurring niche PT schemes | +0.6% | North America, selective EU markets | Short term (≤ 2 years) |
| Rise of remote/at-home testing creating digital PT opportunities | +0.4% | Global, technology-enabled markets | Long term (≥ 4 years) |
| Source: Mordor Intelligence | |||
Stricter ISO/IEC 17025 & 17043 Accreditation Mandates
Global alignment toward ISO/IEC 17025:2017 and the 2023 update of ISO/IEC 17043 pushes laboratories to demonstrate quantitative competence instead of procedural compliance. Hong Kong’s HKAS adopted the new 17043 criteria in November 2024, while Canada’s Standards Council enforced parallel upgrades in May 2024. Accreditation bodies may suspend non-conforming labs, spurring consolidation and increasing demand for statistically robust external quality assessment. As ISO convergence expands to emerging markets, the laboratory proficiency testing market gains momentum through mandatory participation clauses tied to accreditation renewals.
Growing Clinical Diagnostics Volume Amid Chronic Disease Burden
Rising incidence of diabetes, cardiovascular disease and oncology testing has increased the average test menu per U.S. laboratory and extended participation to next-generation sequencing panels. CLIA rules obligate all moderate- and high-complexity labs to enroll in approved programs, and CMS authorized new cytology schemes for 2025. Large networks such as Quest Diagnostics reported USD 9.3 billion revenue in 2023, highlighting how scale multiplies proficiency testing subscriptions across multiple sites. The laboratory proficiency testing market therefore scales directly with diagnostic volume, particularly where advanced molecular assays require tailored external quality assessment.
Tightening Food & Water-Safety Regulations Worldwide
The FDA declared adequate capacity for mycotoxin testing under its LAAF program in June 2024, converting voluntary schemes into mandatory accreditation checkpoints. Parallel EPA PFAS rules issued in April 2024 oblige environmental labs to verify method competency before result acceptance . Under the Safe Drinking Water Act, drinking-water surveillance permits expedited methods for PFAS and chlorine as of January 2025, provided laboratories document ongoing proficiency. These developments transform the laboratory proficiency testing market into a non-discretionary spend across the agri-food and environmental sectors.
Biologics Manufacturing Boom Demanding Validated Analytical Methods
As monoclonal antibodies, cell therapies and gene vectors expand, regulators require proof of assay equivalence across global sites. FDA guidance on analytical procedures stresses potency, purity and identity benchmarks that are frequently demonstrated through external proficiency rounds. Labcorp contributed testing to 90% of FDA approvals in 2023, evidencing demand for harmonized quality data across large networks. The laboratory proficiency testing market is thus integral to biologics lifecycle management, tying analytical validation directly to GMP compliance.
Restraints Impact Analysis*
| Restraint | (~) % Impact on CAGR Forecast | Geographic Relevance | Impact Timeline |
|---|---|---|---|
| High subscription costs for small & mid-size laboratories | -0.8% | Global, acute in emerging markets | Short term (≤ 2 years) |
| Sample logistics & stability hurdles in emerging regions | -0.6% | APAC, Latin America, MEA | Medium term (2-4 years) |
| Consolidation-driven discontinuation of key PT programs | -0.4% | North America & EU | Short term (≤ 2 years) |
| Data-privacy rules limiting inter-lab data sharing analytics | -0.3% | EU, expanding globally | Long term (≥ 4 years) |
| Source: Mordor Intelligence | |||
High Subscription Costs for Small & Mid-Size Laboratories
Independent studies by the Association of Public Health Laboratories indicate that annual proficiency testing outlays can exceed 3% of gross revenue for low-volume labs, constraining participation particularly in developing economies. The termination of the USP scheme in August 2023 raised switching costs, underscoring how market exits can inflate pricing pressure on smaller facilities .
Sample Logistics & Stability Hurdles in Emerging Regions
Cold-chain gaps, customs delays and limited courier networks jeopardize sample integrity in parts of Africa, South-East Asia and Latin America. Programs often need to reship materials, extending turnaround and elevating costs; APHL surveys rank stability failures among the top three user complaints. These challenges temper immediate addressable demand in high-growth geographies despite favorable regulatory trends
*Our forecasts treat driver/restraint impacts as directional, not additive. The impact forecasts reflect baseline growth, mix effects, and variable interactions.
Segment Analysis
By Industry: Clinical Diagnostics Dominates While Pharma Accelerates
Clinical Diagnostics held 38.21% of laboratory proficiency testing market share in 2025 as CLIA mandates coupled with rising chronic disease testing volumes sustained program enrollment. Laboratories routinely parcel the laboratory proficiency testing market size for hematology, chemistry and infectious disease panels across multiple providers, reinforcing predictable renewal revenue. Meanwhile, Pharmaceutical & Biologics posted the quickest 7.32% CAGR, propelled by stringent analytical method validation in monoclonal antibody potency and mRNA vaccine release.
The laboratory proficiency testing industry is also witnessing consistent microbiology uptake driven by dual demand from food safety and clinical bacteriology labs. Cosmetics & Personal Care inquiries grew after the FDA’s MoCRA enforcement date in July 2024, prompting new schemes for heavy metals and microbial challenge. Cannabis and psychedelics testing rounds widened the application base, indicating that differentiated external quality assessment can precede formal regulatory edicts in emerging niches.


By Technology: Cell Culture Keeps Lead but Molecular Surges
Cell Culture-based Assays accounted for 27.10% of the laboratory proficiency testing market size in 2025, reflecting continued biologics potency testing and viral clearance confirmation. Yet PCR & Molecular Methods are set to outpace, expanding at 6.94% CAGR as precision oncology, pathogen genomics and wastewater-based epidemiology demand nucleic-acid accuracy benchmarking.
Chromatography and mass spectrometry rounds maintain core relevance for pharmaceutical impurity profiling and PFAS quantitation, while spectrophotometry serves routine clinical chemistry programs at scale. The laboratory proficiency testing industry increasingly integrates digital data exchange—especially for sequencing files—improving peer-comparison analytics and expanding scheme value beyond simple pass/fail metrics.
By Provider Type: Independent Providers Define Objectivity
Independent/Third-party Providers controlled 54.02% of laboratory proficiency testing market share in 2025, translating the laboratory proficiency testing market into a neutral arbiter of analytical competence across platforms. Their 7.78% growth rate reflects customer preference to decouple quality oversight from instrument vendors.
Manufacturer-affiliated schemes retain significance for highly specialized hardware but face skepticism over objectivity, while government or accreditation-body programs focus on public-health missions such as water quality and newborn screening. Several independents now bundle workflow analytics dashboards, offering laboratories real-time performance trending that enhances internal quality management systems.

Geography Analysis
North America generated 41.98% of 2025 revenues, anchored by CLIA-based compulsory enrollment of more than 260,000 U.S. laboratories and by Canada’s harmonized accreditation system. The region’s laboratory proficiency testing market also benefits from niche demand in cannabis testing as state-level legalization continues. Consolidation among commercial super-networks such as Labcorp and BioReference supports volume robustness even as unit pricing comes under negotiation.
Asia-Pacific records the fastest 7.96% CAGR to 2031, reflecting China’s CNAS accreditation requirements, Japan’s Food Sanitation Act testing obligations and India’s expanding bio-manufacturing corridor. APAC mutual recognition arrangements further enlarge cross-border acceptance, lowering redundant test costs and raising adoption of sophisticated external quality controls. Logistics constraints remain a drag in parts of South-East Asia, yet digital reporting platforms partially offset physical distribution gaps.
Europe sustains mature albeit steady growth under EN ISO/IEC 17025 implementation and evolving monographs such as the European Pharmacopoeia’s cannabis flower inclusion in July 2024. Brexit complexities marginally elevate administrative overhead but have not dampened the laboratory proficiency testing market given maintained mutual recognition agreements. Latin America and the Middle East & Africa represent long-term upside once cold-chain and customs bottlenecks resolve, with regional governments already signaling alignment with ISO norms.

Competitive Landscape
The laboratory proficiency testing market is moderately concentrated; technical barriers, accreditation approvals and logistical infrastructure deter rapid entrant turnover. Independent providers leverage vendor-neutral credibility, while instrumentation companies integrate schemes to reinforce aftermarket services. Eurofins' purchases of ViraCor-IBT (May 2024) and Infinity Laboratories (February 2025) showcase horizontal additions that extend infectious-disease and materials science expertise.
Strategic themes include digitalization—cloud portals now autoload analytic results into QC dashboards—and white-space expansion into psychedelics, at-home sample kits and AI-assisted histopathology. U.S. Department of Defense environmental testing standards updated in December 2023 require proficiency testing participation for contract eligibility, establishing baseline demand. Vendor differentiation increasingly hinges on turnaround speed, statistical depth and multi-matrix portfolio breadth rather than price alone.
Consolidation continues: Labcorp announced three asset deals between September 2024 and May 2025, strengthening oncology and women's-health coverage. Providers without global logistics networks may exit niche schemes, potentially curbing market choice yet improving cross-round comparability where dominant players standardize metrics.
Laboratory Proficiency Testing Industry Leaders
Bio-Rad Laboratories, Inc.,
FAPAS
LGC Limited
Merck KGaA
Trilogy Analytical Laboratory
- *Disclaimer: Major Players sorted in no particular order


Recent Industry Developments
- March 2025: Labcorp announced acquisition of select BioReference Health oncology assets, broadening cancer diagnostics capabilities
- February 2025: Eurofins completed acquisition of Infinity Laboratories, extending analytical reach in materials testing
- January 2025: EPA approved expedited PFAS and chlorine methods under the Safe Drinking Water Act, reinforcing obligatory proficiency testing for alternative procedures


Research Methodology Framework and Report Scope
Market Definitions and Key Coverage
Our study defines the laboratory proficiency testing market as all fee-based schemes in which an external provider distributes well-characterized test items to a network of accredited or applicant laboratories, the results of which are statistically compared to verify analytical competence across clinical, microbiology, pharmaceutical, food, water, beverage, and cosmetics settings. According to Mordor Intelligence, the baseline year is 2025, when global revenues touched USD 1.58 billion.
We exclude intra-company round-robin trials performed solely for R&D or instrument evaluation, because these exercises do not involve an independent provider and therefore fail to reflect commercial market value.
Segmentation Overview
- By Industry
- Clinical Diagnostics
- Microbiology
- Pharmaceutical & Biologics
- Food & Animal Feed
- Water & Environmental
- Commercial Beverages
- Cosmetics & Personal Care
- Others
- By Technology
- Chromatography
- Spectrophotometry
- Immunoassays
- PCR & Molecular Methods
- Cell Culture-based Assays
- Other Emerging Techniques
- By Provider Type
- Independent / Third-party Providers
- Instrument-Manufacturer Programs
- Government & Accreditation-body Schemes
- By Geography
- North America
- United States
- Canada
- Mexico
- Europe
- United Kingdom
- Germany
- France
- Italy
- Spain
- Rest of Europe
- Asia-Pacific
- China
- India
- Japan
- South Korea
- Australia
- Rest of Asia-Pacific
- South America
- Brazil
- Argentina
- Rest of South America
- Middle East and Africa
- GCC
- South Africa
- Rest of Middle East and Africa
- North America
Detailed Research Methodology and Data Validation
Primary Research
Mordor analysts interviewed proficiency scheme managers, laboratory quality officers, and accreditation assessors across North America, Europe, and Asia-Pacific. These conversations validated average participation fees, round frequency, failure rates, and uptake of new matrices (for example, PFAS in water), filling gaps that secondary sources could not quantify.
Desk Research
We began with extensive literature mining from publicly available tier-1 sources such as the World Health Organization, the U.S. CDC's CLIA update files, Eurofins' proficiency catalogs, and ISO/IEC 17043 accreditation registers, which outline scheme volumes and renewal rates. Trade associations, including AOAC, ASTM, and Water Quality Association, offered program counts and fee ranges, while customs databases and Volza shipment data helped us approximate inter-regional kit flows. To size provider revenues, our team tapped D&B Hoovers for financial snapshots and Dow Jones Factiva for press releases on new scheme launches. This desk review framed demand drivers, pricing corridors, and geographic footprints. The sources cited above are illustrative and not exhaustive; many additional documents informed data collection and verification.
Market-Sizing & Forecasting
We employed a top-down and bottom-up hybrid. Accredited-laboratory counts by region were multiplied by average annual spend per lab, reconstructed from fee schedules and interview inputs. Outputs were corroborated with selective bottom-up roll-ups from major scheme providers' reported participant numbers. Key variables like growth in ISO 17025-accredited labs, clinical diagnostics test volumes, biologics batch releases, food-borne outbreak alerts, and water contamination incidents were projected through multivariate regression, producing a 2025-2030 CAGR of 6.5 percent. Where bottom-up totals undershot macro indicators, gap-handling logic adjusted volumes using observed program penetration rates.
Data Validation & Update Cycle
Before sign-off, each model passes two analyst reviews. Anomalies beyond ±5 percent trigger re-contacts with earlier respondents. Reports refresh annually, and an interim update is issued when regulatory mandates (e.g. LAAF roll-out) materially shift demand.
Why Our Laboratory Proficiency Testing Baseline Inspires Confidence
Published estimates often diverge because analysts choose different test menus, fee assumptions, and refresh cadences.
Key gap drivers include variations in technology scope (some firms omit emerging PCR panels), differing currency conversions, and inconsistent treatment of government-subsidized schemes, which Mordor adjusts for via constant-price normalization and provider-level checks.
Benchmark comparison
| Market Size | Anonymized source | Primary gap driver |
|---|---|---|
| USD 1.58 Bn (2025) | Mordor Intelligence | - |
| USD 1.50 Bn (2024) | Global Consultancy A | Narrower technology scope; older base year; fixed FX rates |
| USD 1.40 Bn (2024) | Industry Data Firm B | Counts only ISO 17025 labs; excludes emerging markets |
| USD 1.20 Bn (2023) | Regional Consultancy C | Bundles calibration with proficiency testing; shorter horizon |
Taken together, the comparison shows that Mordor's disciplined variable selection, annual refresh, and transparent adjustments offer decision-makers a balanced, repeatable baseline they can rely on when budgeting or benchmarking quality-control strategies.


Key Questions Answered in the Report
What is driving growth in the laboratory proficiency testing market after 2026?
Stricter ISO accreditation, expanding clinical diagnostics volumes and the rollout of new food- and water-safety regulations are lifting global demand, resulting in a projected 6.18% CAGR over 2026-2031.
Which industry segment is expanding the fastest?
Pharmaceutical & Biologics is forecast to grow at 7.32% CAGR as biologics manufacturing and method validation intensify external quality assessment requirements.
How large is the North American share of the laboratory proficiency testing market?
North America contributed 41.98% of global revenue in 2025, supported by mandatory CLIA participation and FDA, EPA program demands.
Why are independent proficiency testing providers gaining share?
Laboratories prefer vendor-neutral programs to avoid perceived conflicts of interest and to access broader multi-platform benchmarking.
Page last updated on:


