
Technology, Media and Telecom
5th MayPricing Strategy for Semiconductor Components
3 Min Read
The KSA Location-Based Services Market Report Segments the Industry Into by Component (Hardware, Software, and Services), Location (Indoor, and Outdoor), Application (Mapping and Navigation, Business Intelligence and Analytics, Location-Based Advertising, Social Networking and Entertainment, and Other Applications), and End-User (Transportation and Logistics, IT and Telecom, Healthcare, Government, and More).
Market Overview
| Study Period | 2020 - 2031 |
|---|---|
| Base Year For Estimation | 2025 |
| Forecast Data Period | 2026 - 2031 |
| Market Size (2026) | USD 0.43 Billion |
| Market Size (2031) | USD 0.84 Billion |
| Growth Rate (2026 - 2031) | 14.05 % CAGR |
| Market Concentration | Medium |
Major Players *Disclaimer: Major Players sorted in no particular order. Image © Mordor Intelligence. Reuse requires attribution under CC BY 4.0. |
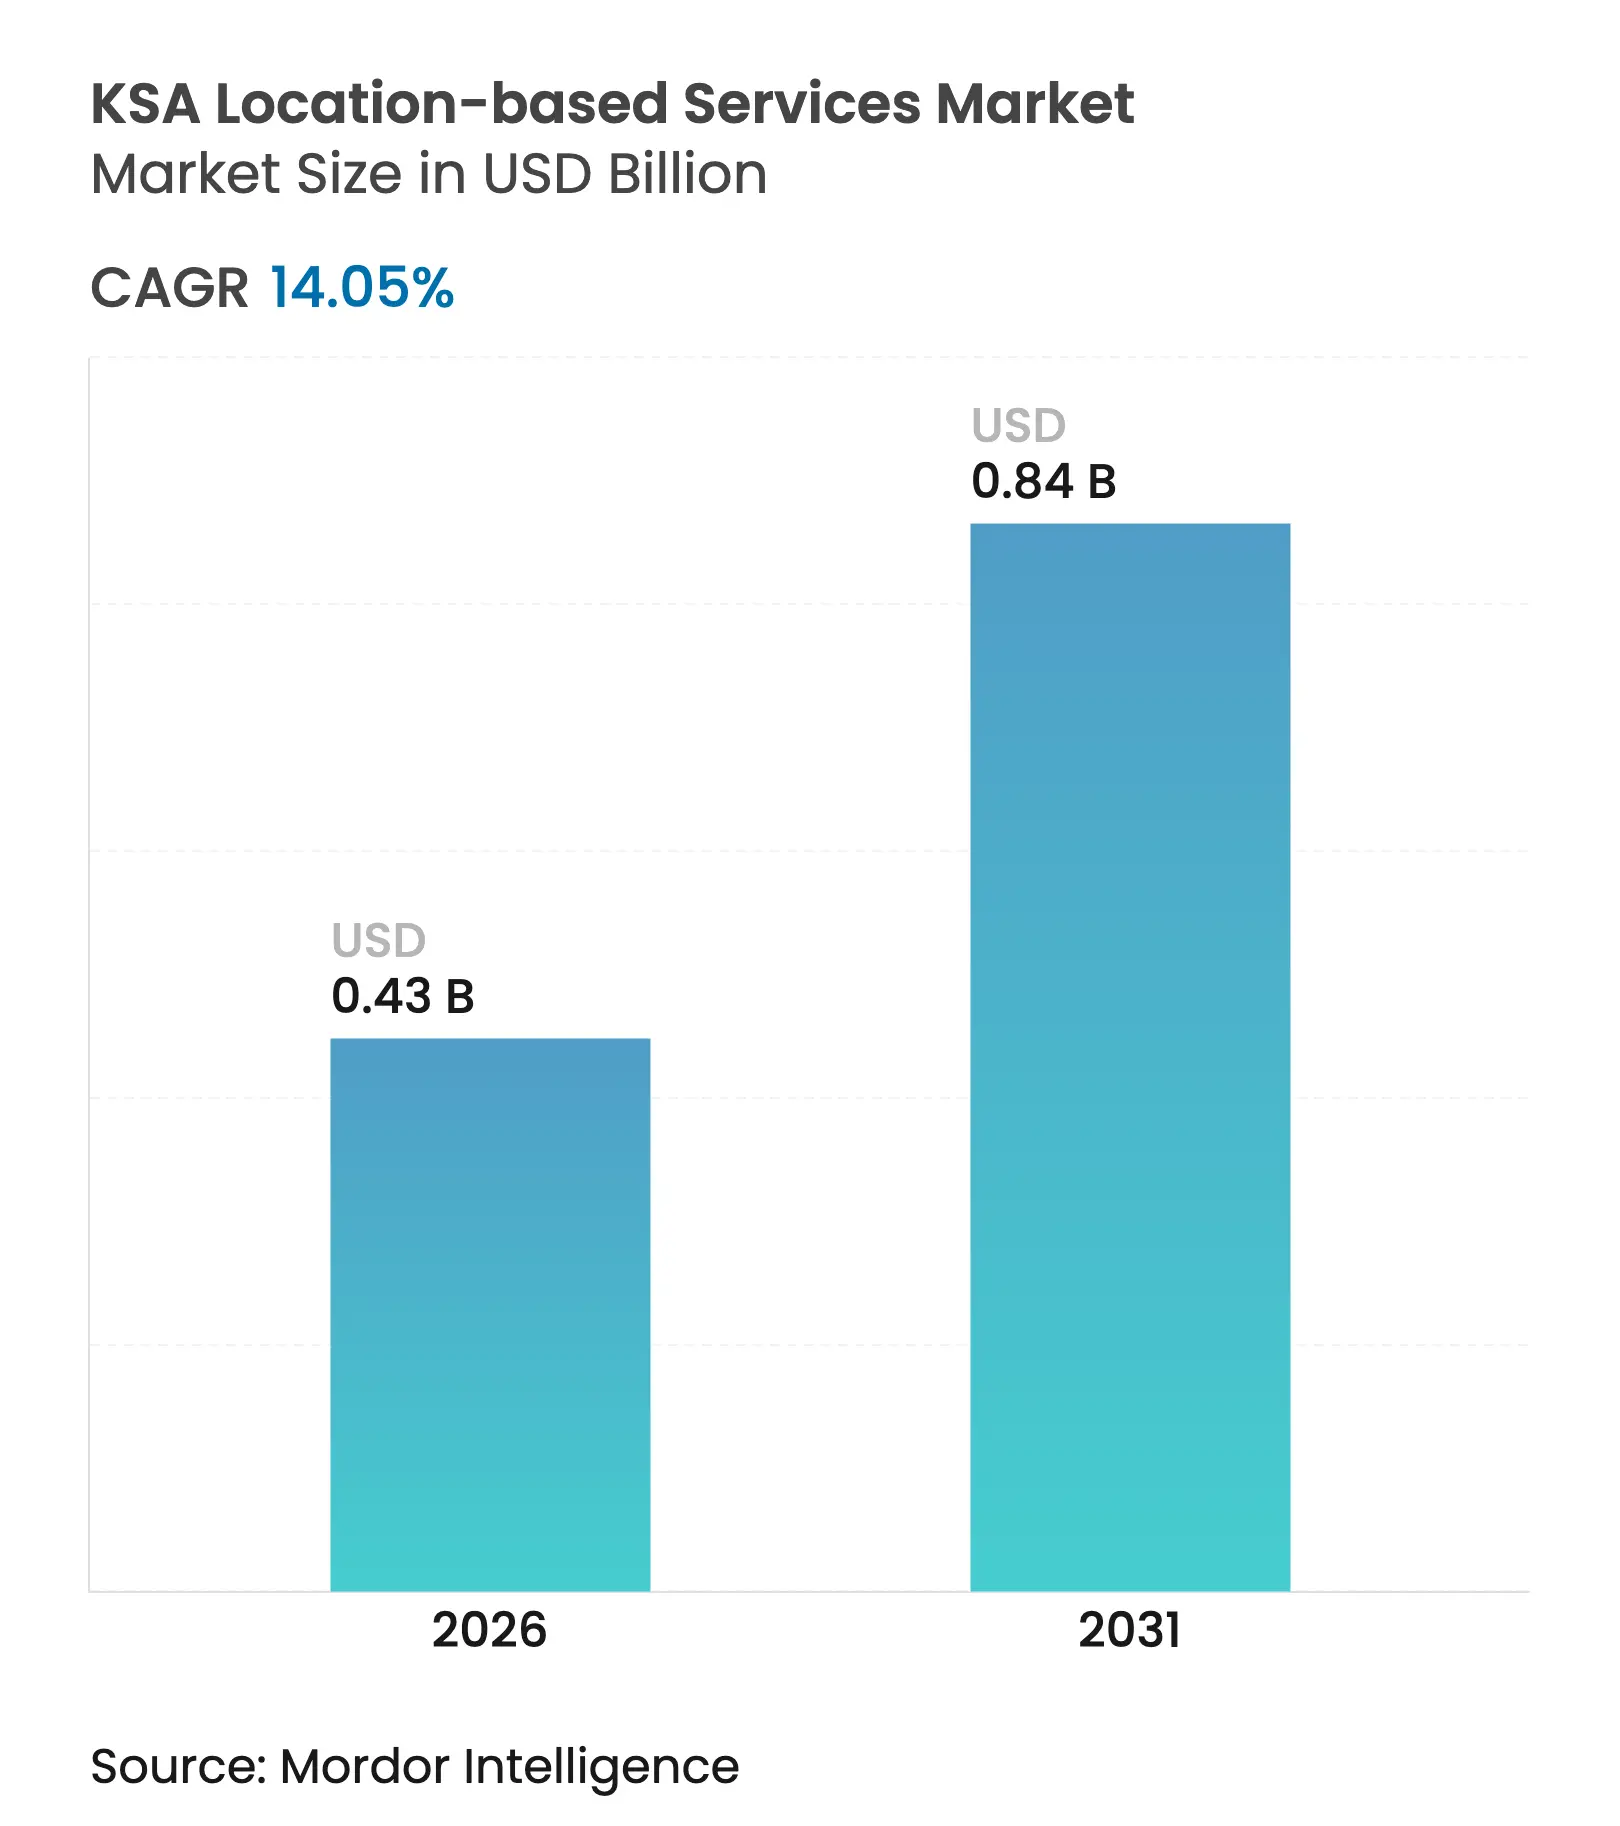
The KSA location-based services market size was valued at USD 380 million in 2025 and estimated to grow from USD 433.39 million in 2026 to reach USD 836.2 million by 2031, at a CAGR of 14.05% during the forecast period (2026-2031). Sustained public spending on smart-city projects, near-universal mobile internet adoption, and a supportive geospatial policy framework are driving solid demand across consumer and enterprise use cases. Hardware remains the largest revenue generator, yet services are growing faster as operators seek integration expertise for ever denser sensor networks. Outdoor navigation still dominates, though indoor positioning is gaining traction inside mega-malls, airports, and NEOM’s vertical districts. Competitive dynamics show telecom incumbents leveraging 5G rollouts while global platforms localize through joint ventures. Data-privacy rules, connectivity gaps outside cities, and limited Arabic geospatial content temper short-term upside but do not alter the long-run growth trajectory.
Key Report Takeaways
Note: Market size and forecast figures in this report are generated using Mordor Intelligence's proprietary estimation framework, updated with the latest available data and insights as of 2026.
Drivers Impact Analysis
| Driver | (~) % Impact on CAGR Forecast | Geographic Relevance | Impact Timeline | |||
|---|---|---|---|---|---|---|
Vision 2030
smart-city megaproject pipeline
Vision 2030
smart-city megaproject pipeline
| +3.2% | NEOM, Riyadh, Jeddah | Long term (≥ 4 years) |
(~) % Impact on
CAGR Forecast
:
+3.2%
|
Geographic
Relevance
:
NEOM, Riyadh, Jeddah
|
Impact Timeline
:
Long term (≥ 4
years)
|
5G rollout and
near-universal mobile internet
5G rollout and
near-universal mobile internet
| +2.8% | Nationwide, urban focus | Medium term (2-4 years) | |||
SDAIA and MOMRA
geospatial-data mandates
SDAIA and MOMRA
geospatial-data mandates
| +2.1% | Government sector | Medium term (2-4 years) | |||
E-commerce last-mile
and fleet tracking boom
E-commerce last-mile
and fleet tracking boom
| +1.9% | Major cities then suburbs | Short term (≤ 2 years) | |||
Indoor navigation
codes for giga-malls
Indoor navigation
codes for giga-malls
| +1.4% | Riyadh, Jeddah, Dammam | Medium term (2-4 years) | |||
AR guidance for Hajj
and Umrah pilgrims
AR guidance for Hajj
and Umrah pilgrims
| +1.1% | Makkah, Madinah | Short term (≤ 2 years) | |||
| Source: Mordor Intelligence | ||||||
Vision 2030 smart-city megaproject pipeline
A USD 500 billion commitment to NEOM, The Line, Qiddiya, and related projects is reshaping spatial demand. These cities embed location intelligence into utilities, transport, and visitor management. Indoor positioning substitutes for unreliable GPS inside skyscrapers and tunnels. Large-scale occupancy targets, such as 5 million residents by 2030 in The Line, accelerate procurement cycles. Entertainment-oriented destinations like Qiddiya need engines that personalize routes for 400 attractions at once. This scale positions Saudi Arabia as a proving ground for exportable location-tech models [1]NEOM, “The Line Urban Plan,” neom.com.
5G rollout and near-universal mobile internet
Population-wide internet penetration hit 99% in 2023 while 5G already covers 78% of residents. Average mobile download speeds above 300 Mbps permit sub-10 millisecond latency, enabling autonomous shuttles and AR guidance. STC booked USD 5.1 billion Q1-2024 revenue that funds further densification, and Zain allocates USD 0.43 billion for rural towers. Fixed Wireless Access adoption, now 20% of broadband lines, reduces dependence on fiber and spreads real-time location services into provincial towns.
Geospatial-data mandates from SDAIA and MOMRA
A unified framework obliges ministries to adopt standardized spatial layers. SDAIA’s Digital Hajj Card handles millions of pilgrim profiles, showing scalability. The Personal Data Protection Law, active since September 2024, favors domestic hosting, benefiting local platform providers and stimulating edge-cloud investment. MOMRA’s urban plans across all 13 regions incorporate geofencing rules, guaranteeing recurring demand for compliant LBS software.
E-commerce last-mile and fleet tracking boom
Saudi online retail passes USD 13 billion in gross merchandise value, sparking demand for route optimization. Aramex cut urban delivery miles through CARTO’s spatial analytics. Local entrant Wahyd scales tech-led trucking across dense fuel-station networks, integrating real-time location data for dispatch and refrigerated cargo monitoring. Venture funding into RTLS startup Averos highlights domestic appetite for precise indoor tracking within warehouses and malls.
Restraint Impact Analysis
| Restraint | (~) % Impact on CAGR Forecast | Geographic Relevance | Impact Timeline | |||
|---|---|---|---|---|---|---|
Stringent
data-privacy and localization rules
Stringent
data-privacy and localization rules
| -1.8% | Nationwide, more pressure on multinationals | Medium term (2-4 years) |
(~) % Impact on
CAGR Forecast
:
-1.8%
|
Geographic
Relevance
:
Nationwide, more
pressure on multinationals
|
Impact Timeline
:
Medium term (2-4
years)
|
Rural and desert
connectivity gaps
Rural and desert
connectivity gaps
| -1.3% | Oilfields, farming zones, sparsely populated areas | Long term (≥ 4 years) | |||
Scarcity of Arabic
geospatial content
Scarcity of Arabic
geospatial content
| -1.1% | National, user-facing apps | Medium term (2-4 years) | |||
High CapEx for
RF-dense indoor positioning
High CapEx for
RF-dense indoor positioning
| -0.9% | Mega-malls, transport hubs | Short term (≤ 2 years) | |||
| Source: Mordor Intelligence | ||||||
Stringent data-privacy and localization rules
The PDPL obliges organizations to process personal location data inside the Kingdom and to complete risk assessments before any cross-border transfer. International LBS vendors must finance local data centres or partners with approved hosts, raising total cost structures by up to one quarter. A 72-hour breach-notification window increases compliance workloads, especially for platforms that process millions of events per day. While citizen trust benefits, the rulebook narrows foreign participation to those ready for capital-intensive localization.
Rural and desert connectivity gaps
The Kingdom’s vast 2.15 million km² landmass still includes oil fields and agricultural zones outside reliable 4G or 5G footprints. Aramco now tests Low Earth Orbit satellites for IoT backhaul at remote rigs. Multi-layer networks that blend terrestrial, aerial, and orbital assets are evolving but remain expensive. Limited coverage constrains nationwide asset-tracking rollouts and reduces the addressable user base for consumer LBS in sparsely populated areas.
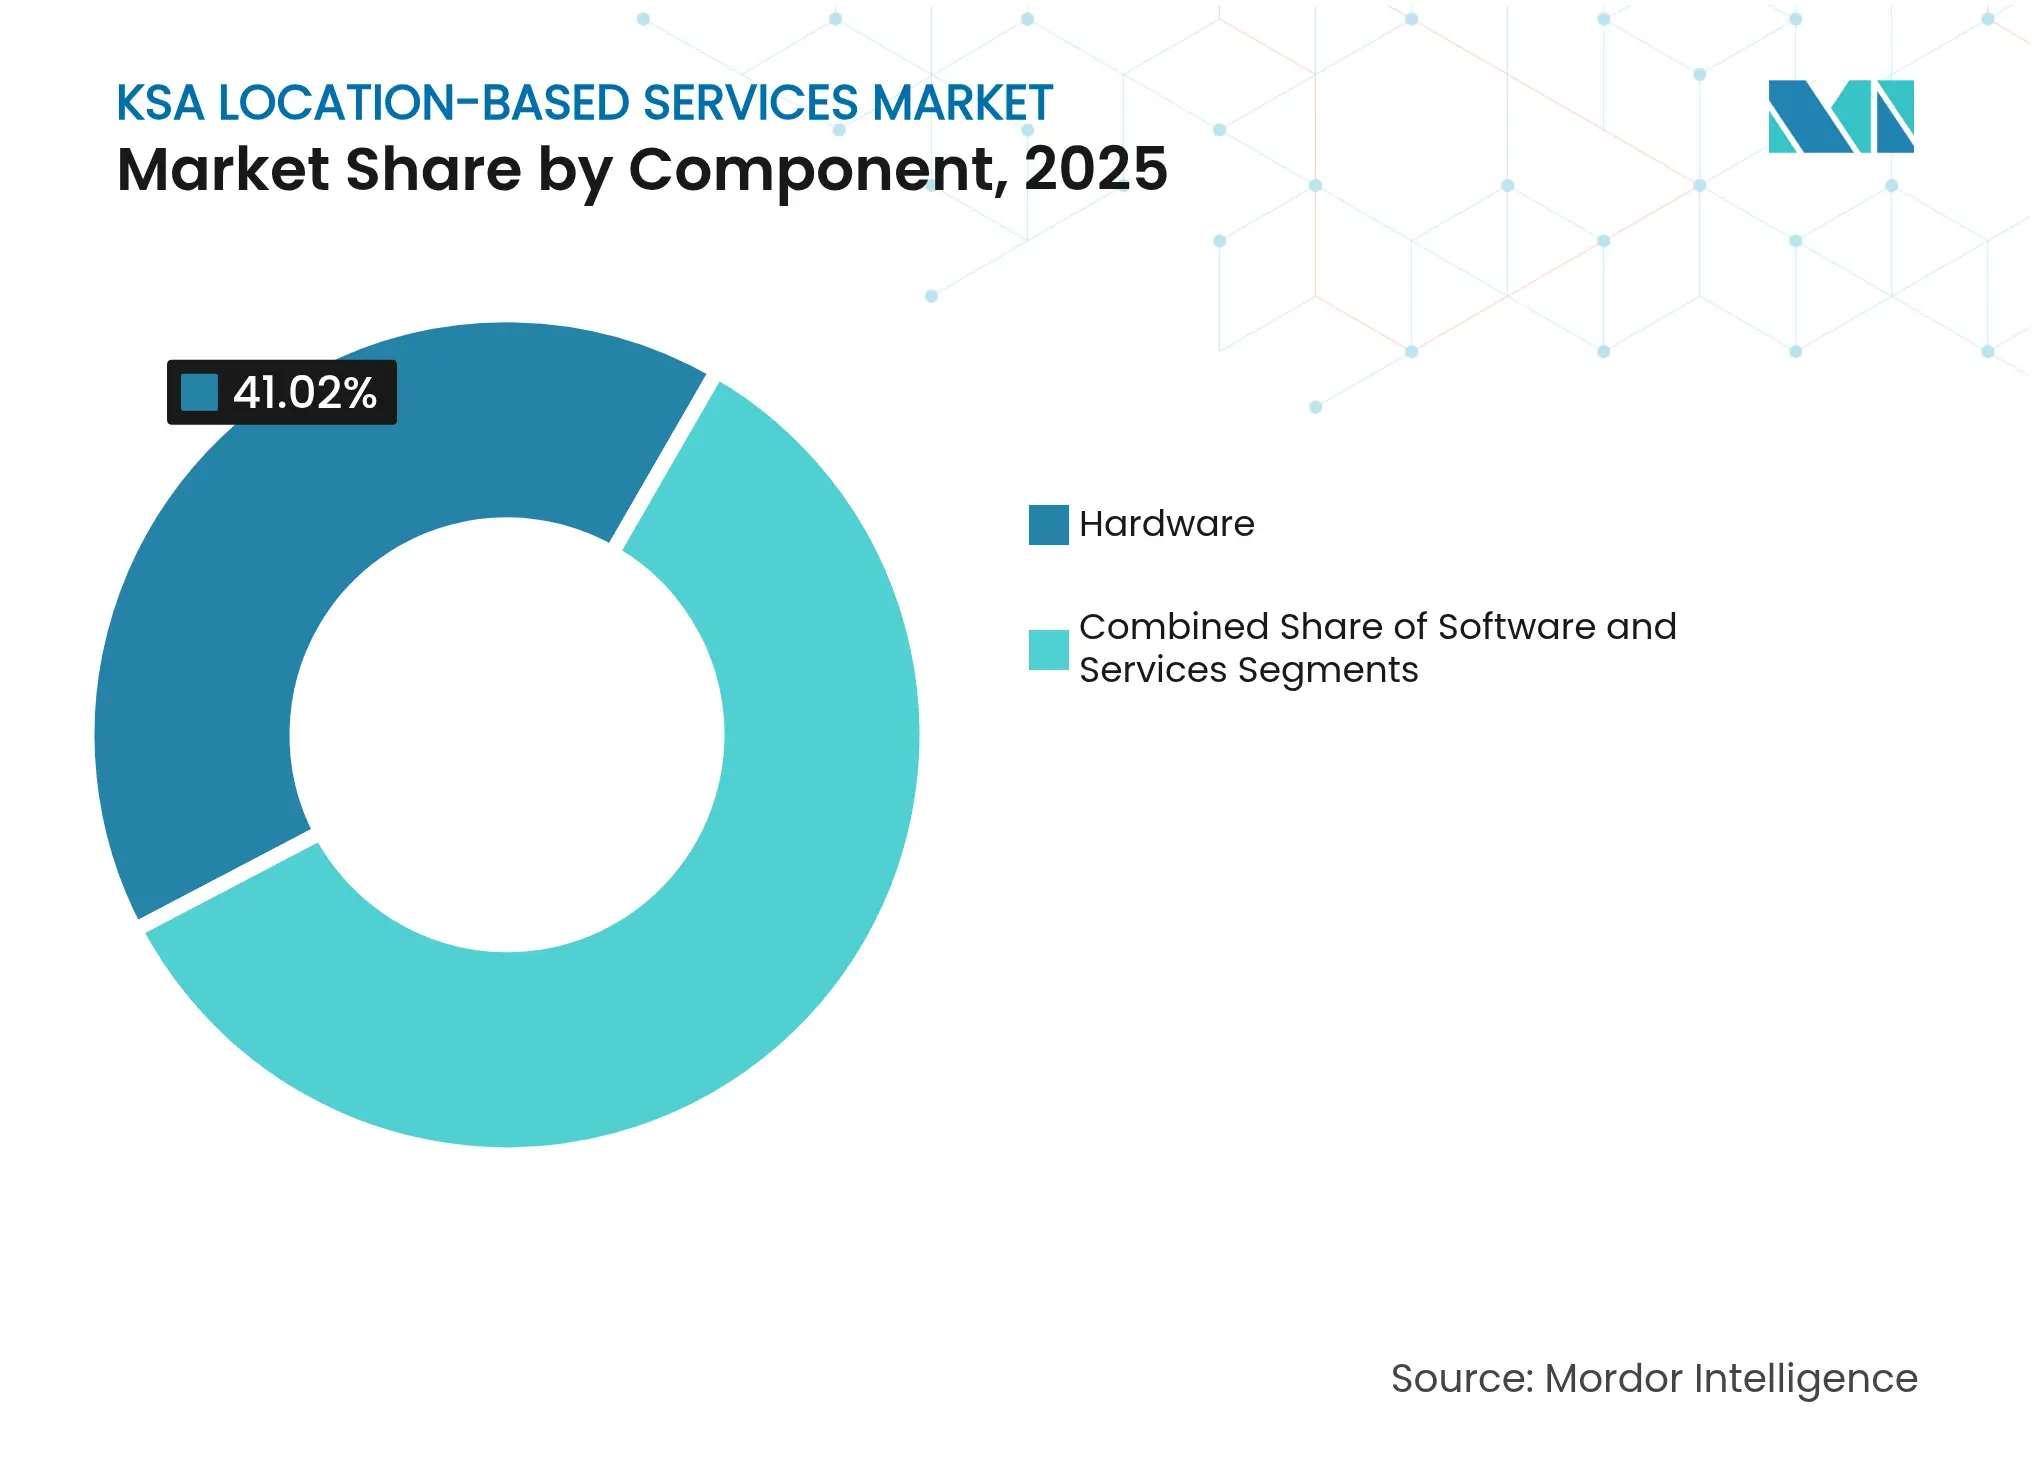
By Component: Hardware leads, services accelerate
Hardware captured 41.02% of 2025 revenue, underpinned by beacon, sensor, and gateway purchases for Vision 2030 cities. NEOM alone specifies thousands of ultra-wide-band anchors for autonomous mobility corridors. Correspondingly, the services segment posts the highest 19.54% CAGR to 2031 as integrators maintain and optimise expansive device fleets. The share shift illustrates a transition from capital build-out toward lifecycle management. IBM’s asset-management suite in King Abdullah Financial District lifts service revenues by linking 100,000 assets to predictive maintenance dashboards.
Saudi universities report prototype UWB deployments that cut bill-of-materials costs by 40-60% through smarter antenna placement, signalling gradual hardware margin compression and service-driven revenue replacement. As operators reconfigure networks for battery-efficient Bluetooth beacons and edge AI analytics, consulting and managed services stand to capture growing wallet share. This pivot supports a resilient location-based services market even when hardware order cycles slow.
Note: Segment shares of all individual segments available upon report purchase
By Location Type: Indoor positioning gains speed
Outdoor solutions held 62.15% of 2025 turnover, thanks to long-haul logistics, ride-hailing, and pilgrim navigation across road grids. Yet indoor systems, running at an 18.52% CAGR, outpace the overall location-based services market. Airport expansions in Jeddah and Riyadh mandate centimetre-grade staff tracking for ground-handling safety. Mall developers embed Bluetooth and Wi-Fi anchors to steer footfall, deliver hyper-local promotions, and gauge dwell time. University research shows sub-meter accuracy is achievable inside concrete buildings when BLE is fused with inertial sensors.
The capital outlay for RF-dense deployments is a barrier, but bundled analytics, rental beacons, and software-defined radios lower upfront risk for property owners. Premium pricing for accuracy-critical use cases such as medical equipment tracking offsets cost pressures. Accordingly, indoor systems expand the location-based services market size through value-added subscriptions rather than one-time equipment sales.
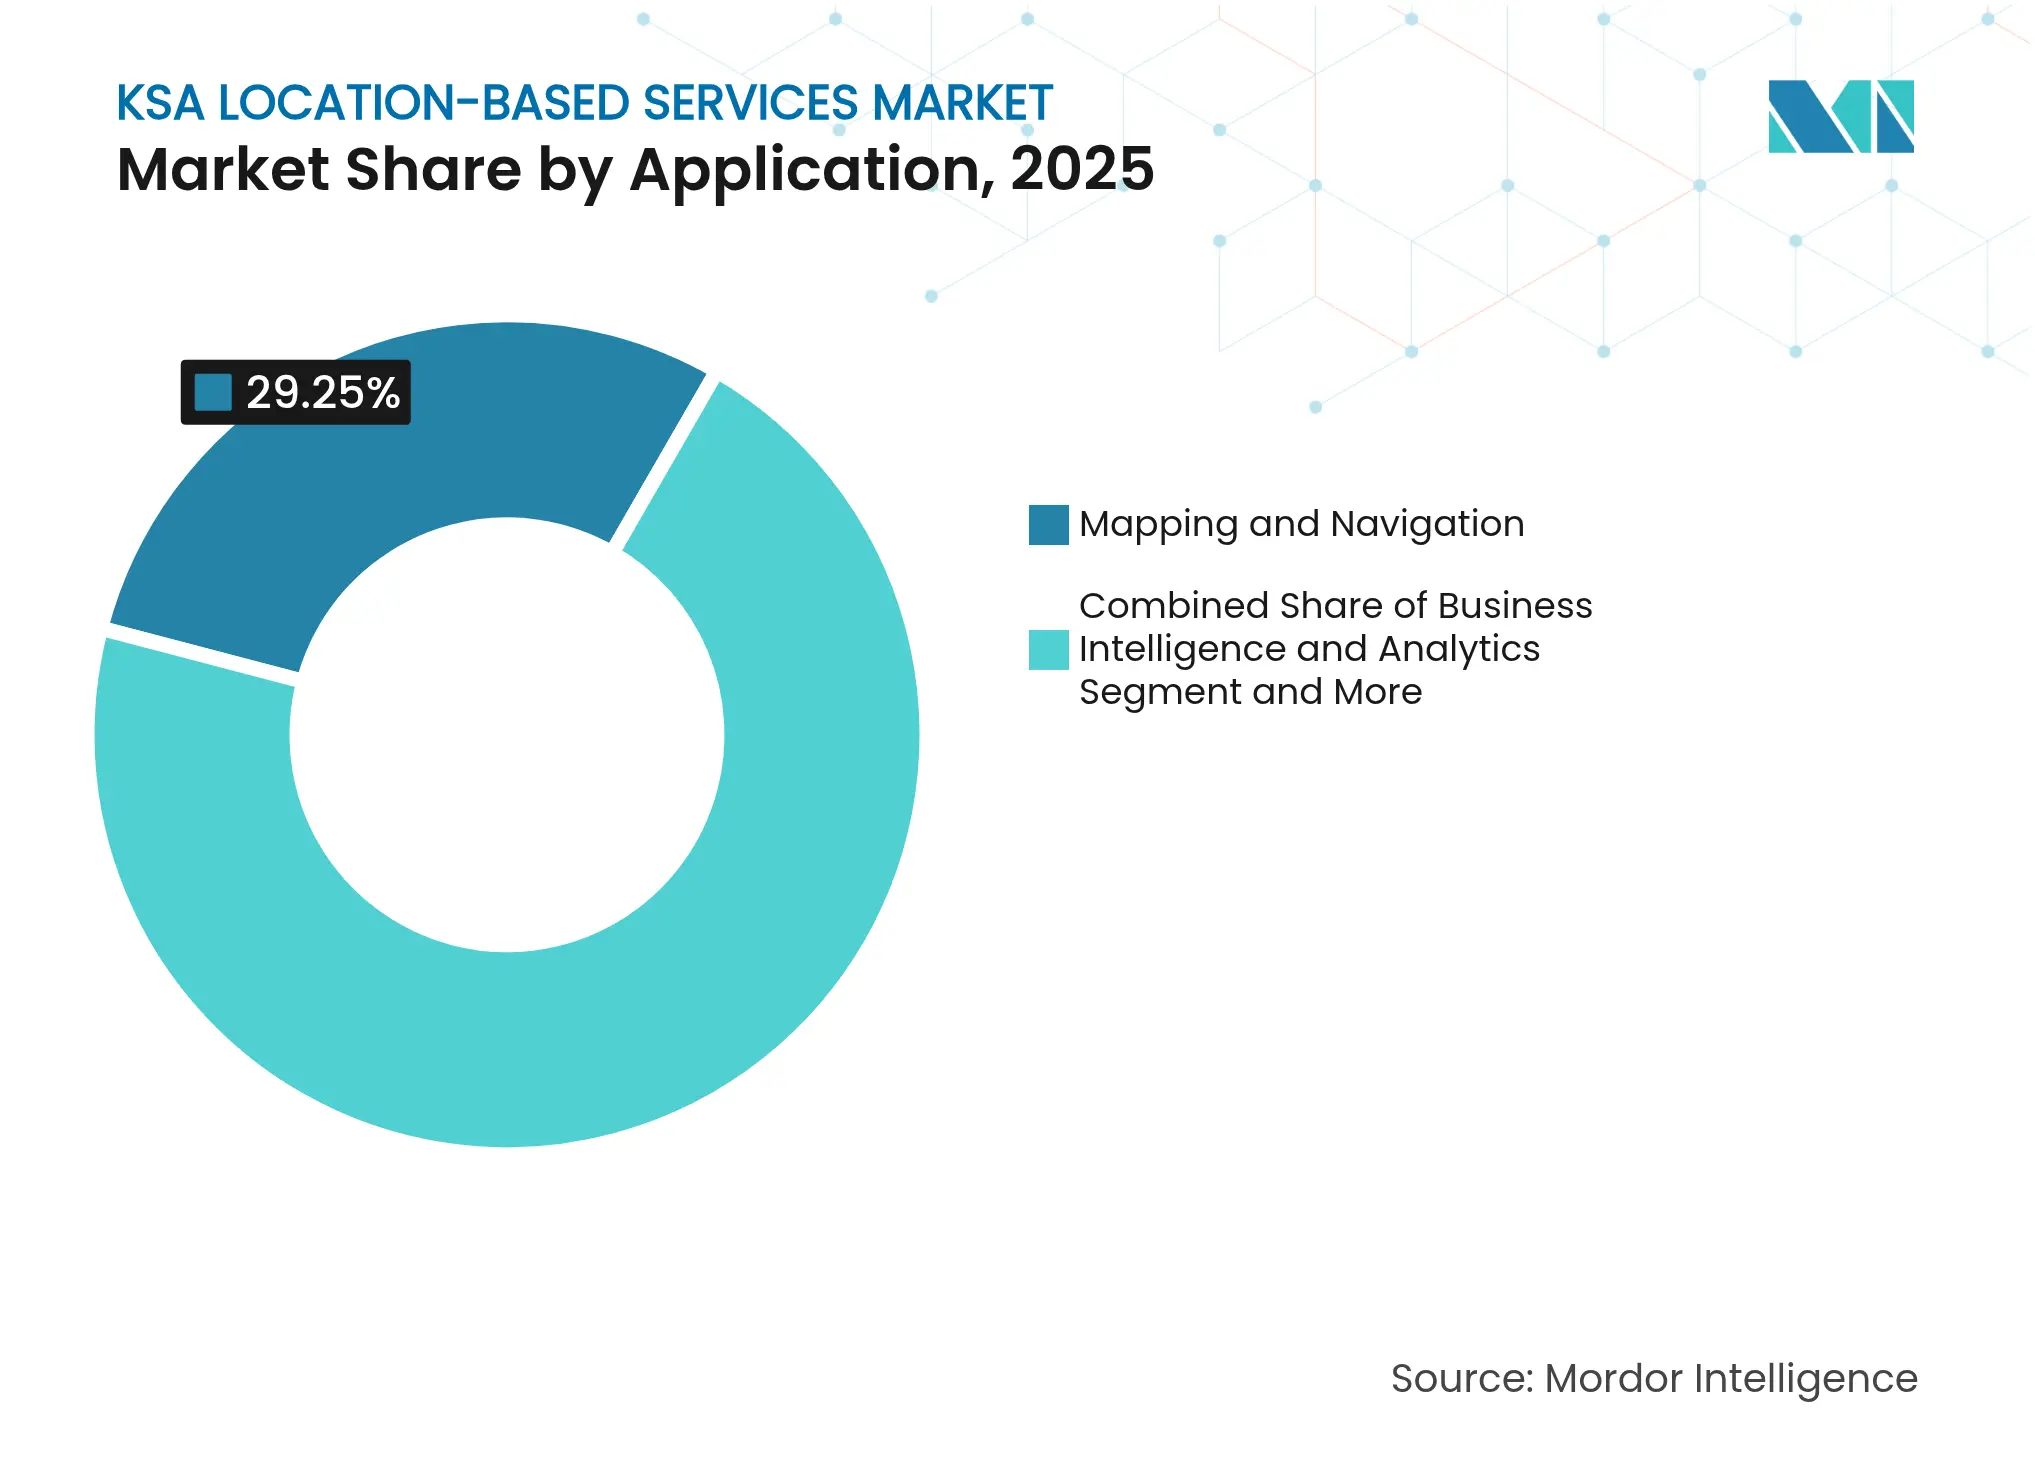
By Application: Navigation dominant, advertising surges
Mapping and navigation held 29.25% share in 2025 as primary use cases across driving, walking, and pilgrim journeys. The Hajj and Umrah Navigator, powered by what3words, demonstrates mission-critical adoption for millions of visitors annually. Location-based advertising rises fastest at a 19.72% CAGR as retailers tap geofenced campaigns matched to footfall analytics. Smartphone penetration above 96% and high disposable incomes create fertile ground for contextual offers delivered at the store entrance.
Business intelligence tools that analyse site selection and movement patterns gain steady traction among banks and government agencies. Social networking and gaming apps integrate AR layers that overlay wayfinding with entertainment. This diversity broadens revenue resilience beyond core navigation, supporting a dynamic location-based services market.
Note: Segment shares of all individual segments available upon report purchase
By End-user Vertical: Logistics leads, healthcare scales fastest
Transportation and logistics commanded 24.12% revenue in 2025, fuelled by oil-driven supply chains and growing e-commerce volumes. Fleet telematics optimise last-mile routes and monitor cold-chain compliance. Healthcare, on the other hand, is scaling at a 19.67% CAGR as the Seha Virtual Hospital expands to 597,500 patients a year through mixed-reality consultations that rely on precise patient-location data. Hospitals deploy autonomous sanitation robots and asset trackers to raise efficiency and reduce infection risk.
Government, BFSI, and manufacturing verticals maintain double-digit growth as each sector digitises operations via PDPL-compliant spatial analytics. Mining pilots, backed by Hexagon and King Saud University, indicate future scale for location-aware safety systems in the industrial south. Collectively, these trends diversify the location-based services industry customer base and mitigate reliance on a single sector.
Riyadh, Jeddah, and Dammam concentrate around 64.35% of spending, reflecting dense population, corporate headquarters, and flagship smart-city budgets. Riyadh hosts ministries that mandate compliance with SDAIA geospatial policies, creating steady contracts for secure map services. Jeddah’s Red Sea port accelerates location-tracking for container logistics, while Makkah and Madinah generate seasonal spikes tied to pilgrim guidance apps.
Eastern Province oil clusters adopt high-precision RTLS for refinery safety. Northern Tabuk region, home to NEOM, shows a 15.74% CAGR as greenfield city districts embed location intelligence from inception.
Southern provinces remain nascent but gain attention as telecoms extend 5G to Abha and Jazan farming zones. Rural deserts rely increasingly on LEO satellite overlays, an investment area championed by Neo Space Group. These patterns indicate an maturing but spatially imbalanced location-based services market.
Market Concentration
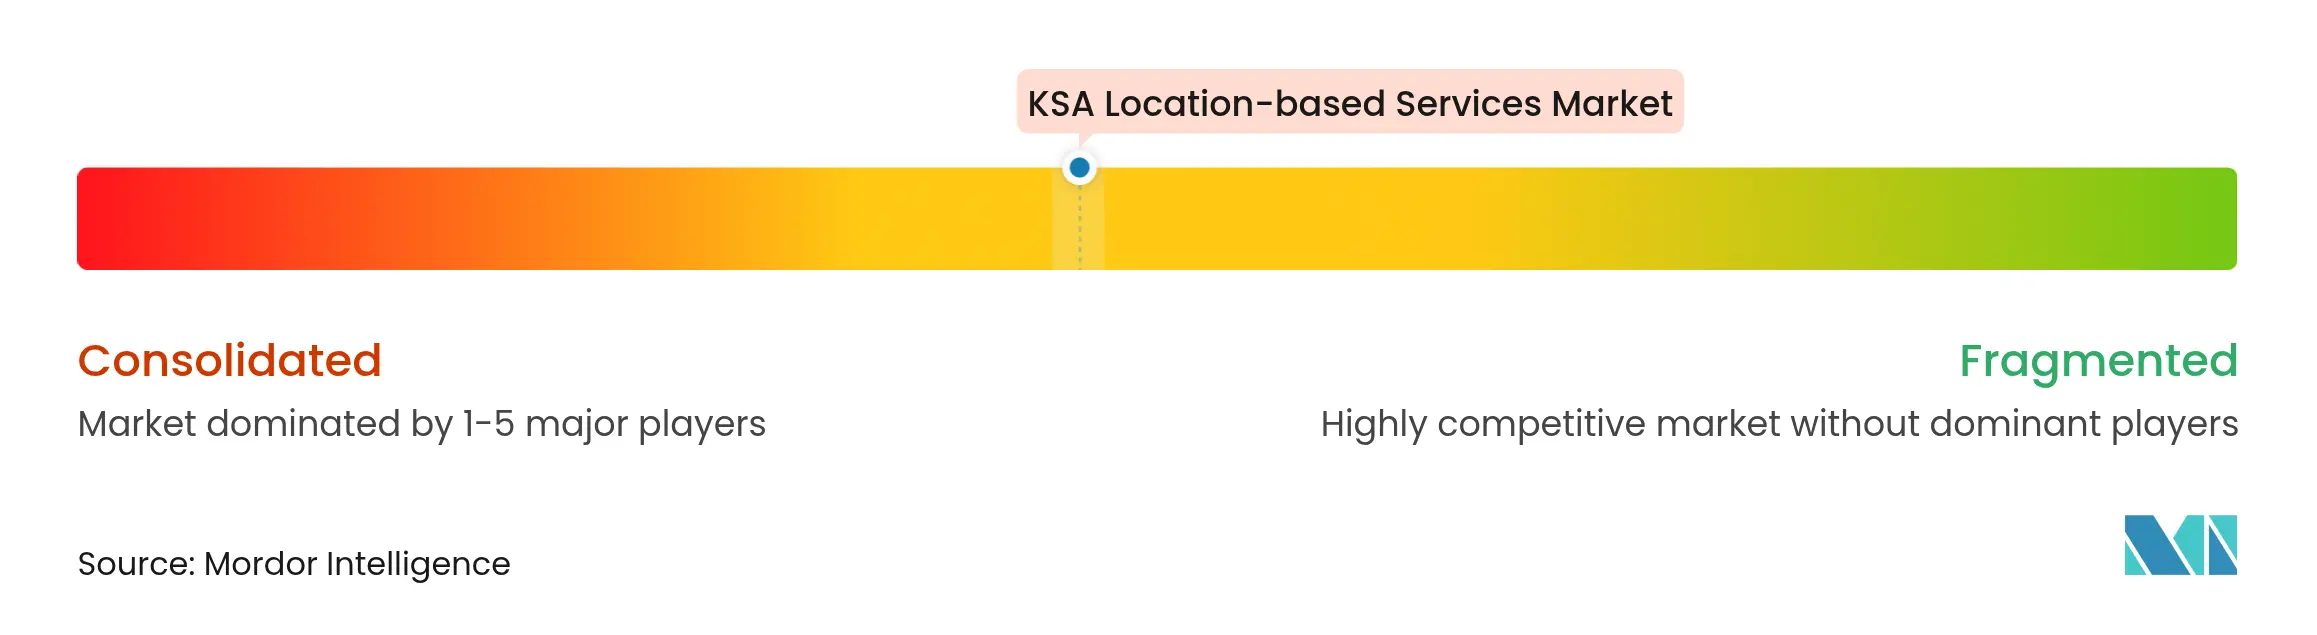
The location-based services market remains moderately fragmented. STC leverages its 55% mobile market share to cross-sell IoT and edge-cloud offerings. Mobily and Zain follow with regional coverage boosts, while Google, Amazon, and IBM localize through PIF-backed data centres and multi-billion partnerships. Domestic innovators such as Averos focus on Arabic user interfaces and indoor analytics, gaining traction in government tenders.
Strategic alliances signal consolidation potential. Amazon commits USD 5 billion to an AI Zone with HUMAIN to attract developers that will consume Amazon Location APIs. Google Cloud aligns with PIF for an AI hub that embeds local geofencing services into national data pipelines. Telecom operators explore white-label mapping platforms to retain data within Saudi borders. International hardware makers partner with universities for joint RandD on low-cost UWB chips, positioning for future volume bids.
Intellectual-property localization and PDPL compliance emerge as decisive factors. Players able to prove on-shore processing and Arabic language support improve tender success. Over time, market leaders may integrate vertically, acquiring niche indoor-positioning specialists to offer end-to-end stacks. This dynamic supports a balanced yet competitive location-based services industry.

*Disclaimer: Major Players sorted in no particular order
1. INTRODUCTION
2. RESEARCH METHODOLOGY
3. EXECUTIVE SUMMARY
4. MARKET LANDSCAPE
5. MARKET SEGMENTATION
6. COMPETITIVE LANDSCAPE
7. MARKET OPPORTUNITIES AND FUTURE OUTLOOK
Location-based services (LBSs) are computer or mobile applications that provide information based on the device's location and the user, primarily through mobile portable devices, such as smartphones and mobile networks. The precision of the location services primarily depends on the hardware and software used in the mobile communication system, along with the positioning server.
The KSA location-based services market is segmented by component (hardware, software, services), location (indoor and outdoor), application (mapping and navigation, business intelligence and analytics, location-based advertising, social networking, entertainment, and other applications), and end-user (transportation and logistics, it and telecom, healthcare, government, BFSI, hospitality, manufacturing, and other end-users).
The market sizes and forecasts are provided in terms of value (USD) for all the above segments.
Pricing Strategy for Semiconductor Components
3 Min Read
Accelerating Additive Manufacturing Adoption in India
3 Min Read
When decisions matter, industry leaders turn to our analysts. Let’s talk.