
Kazakhstan Mining Market Size and Share
Market Overview
| Study Period | 2021 - 2031 |
|---|---|
| Forecast Data Period | 2026 - 2031 |
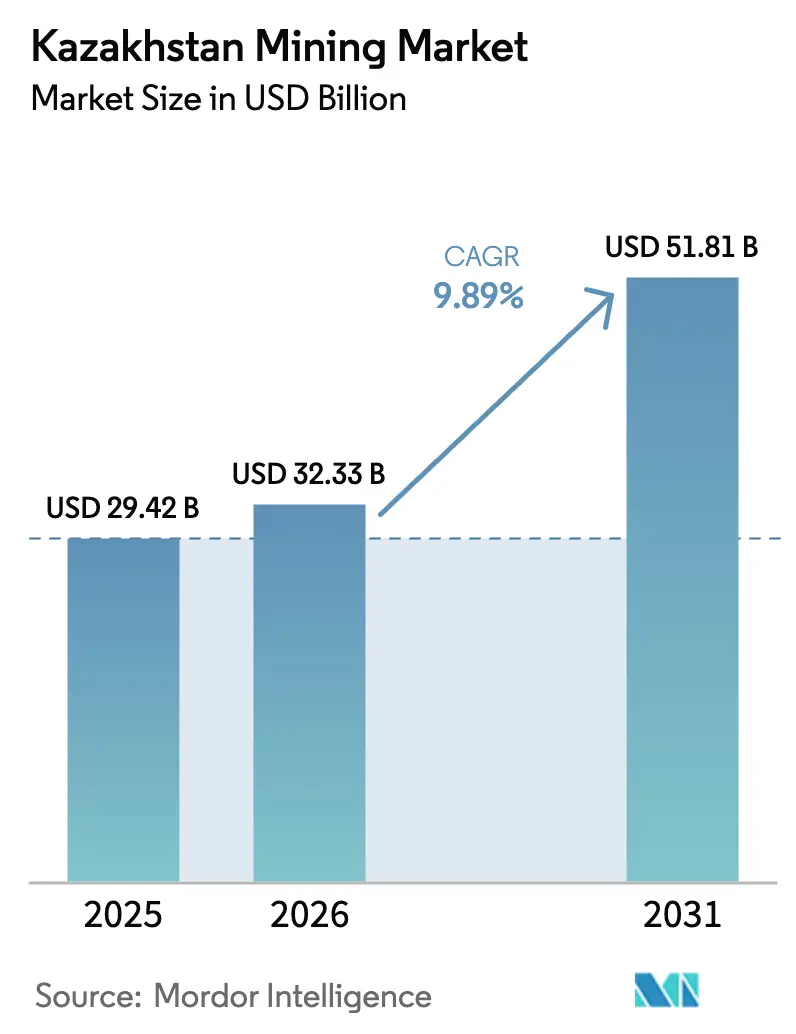
| Base Year Market Size (2025) | USD 29.42 Billion |
| Market Size (2026) | USD 32.33 Billion |
| Market Size (2031) | USD 51.81 Billion |
| Growth Rate (2026 - 2031) | 9.89 % |
| Market Concentration | Medium |
Major Players *Disclaimer: Major Players sorted in no particular order Image © Mordor Intelligence. Reuse requires attribution under CC BY 4.0. | |
Kazakhstan Mining Market Analysis by Mordor Intelligence
The Kazakhstan Mining Market size is projected to expand from USD 29.42 billion in 2025 and USD 32.33 billion in 2026 to USD 51.81 billion by 2031, registering a CAGR of 9.89% between 2026 to 2031. Electric-vehicle‐driven demand for copper and battery metals, government-backed uranium capacity additions, and lower freight costs on the Khorgos-Dostyk rail corridor are widening profit pools and drawing fresh capital. State incentives that blend 10-year tax holidays with 51% local-content requirements are accelerating downstream investments while shielding strategic minerals from spot-price swings. Digital technologies—autonomous haulage, real-time ore sorting, and predictive maintenance—are improving asset utilization, especially at surface coal and copper operations. Meanwhile, exploration spending is shifting toward polymetallic prospects in the Altai and lithium brines under the Caspian seabed, signaling a pivot from bulk commodities to value-added critical materials.
Key Report Takeaways
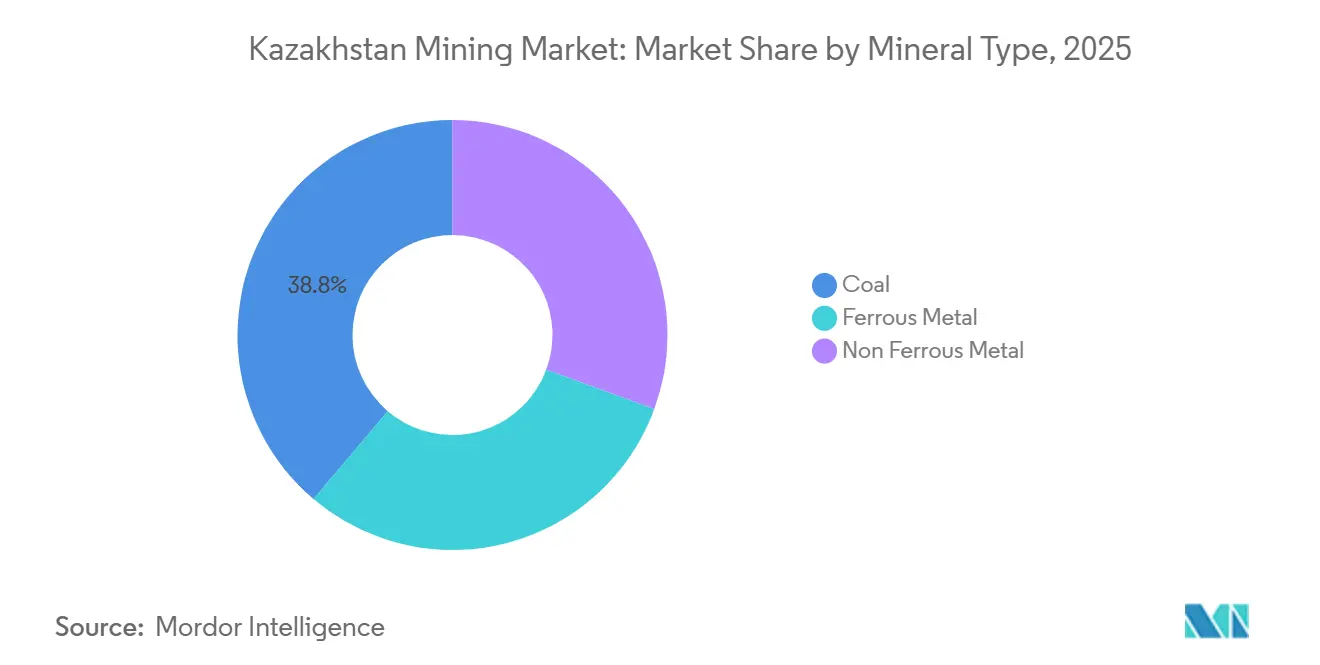
- By mineral type, coal led with 38.80% of Kazakhstan's mining market share in 2025, while the non-ferrous metal segment is expanding at a 10.56% CAGR through 2031.
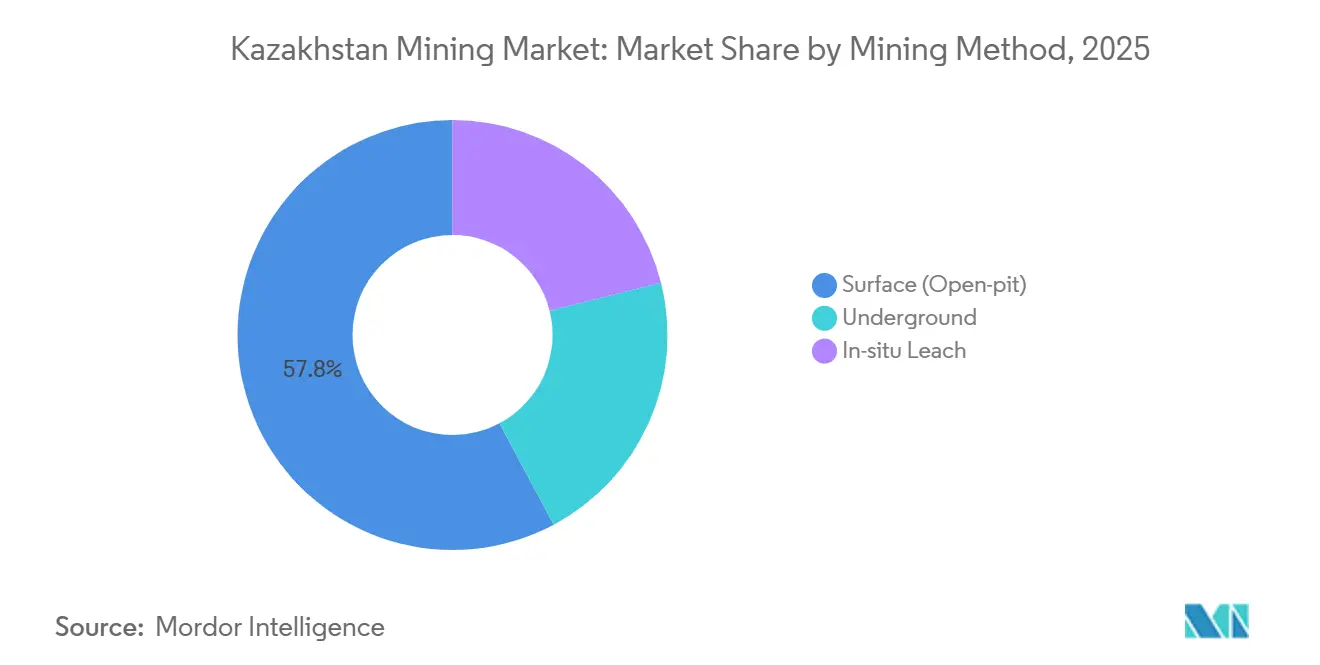
- By mining method, surface (open-pit) commanded 57.80% of volume in 2025, whereas in-situ leach is advancing at a 10.22% CAGR through 2031.
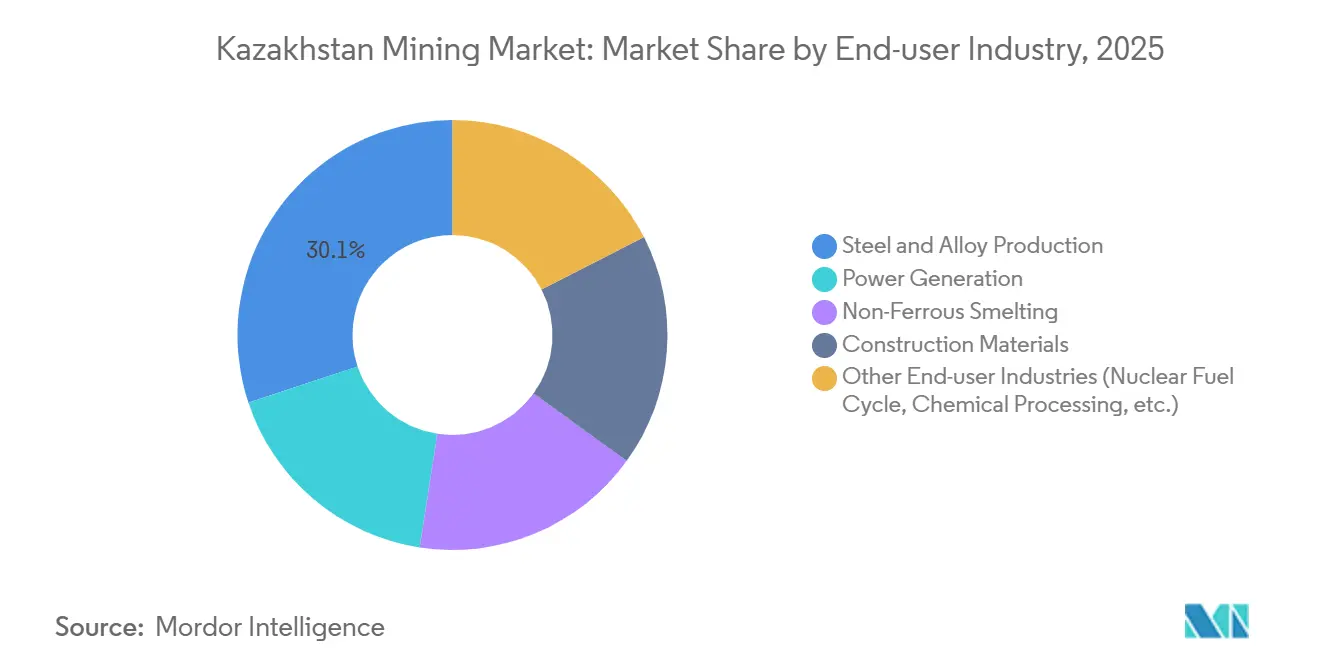
- By end-user industry, steel and alloy production absorbed 30.10% of mined output in 2025; the “Other End-user Industries” segment is forecast to grow at an 11.28% CAGR to 2031.
Note: Market size and forecast figures in this report are generated using Mordor Intelligence’s proprietary estimation framework, updated with the latest available data and insights as of January 2026.
Kazakhstan Mining Market Trends and Insights
Drivers Impact Analysis*
| Driver | (~) % Impact on CAGR Forecast | Geographic Relevance | Impact Timeline |
|---|---|---|---|
| Surge in Global Copper Demand | +2.1% | Global, with strongest pull from China and EU battery-materials hubs | Medium term (2-4 years) |
| Government-Led Uranium Expansion Plans | +1.8% | National, concentrated in Turkestan and Kyzylorda oblasts | Long term (≥ 4 years) |
| Modernisation of Coal-Fired Power Fleet | +1.3% | National, with spillover to Central Asian power grids | Medium term (2-4 years) |
| Belt and Road Rail Upgrades Slash Export Costs | +2.4% | National, with direct impact on Khorgos-Dostyk corridor and Caspian transshipment | Short term (≤ 2 years) |
| Increasing Exploration of Mining Reserves | +1.5% | National, early gains in Pavlodar, East Kazakhstan, and Mangystau regions | Long term (≥ 4 years) |
| Source: Mordor Intelligence | |||
Surge in Global Copper Demand
Copper consumption for electric-vehicle wiring and grid upgrades is pulling 1.2 million tonnes of additional refined copper into the market by 2028. Kazakhstan’s Bozshakol and Aktogay mines produced 285,000 tonnes in 2025, ranking the country 11th worldwide. Rail electrification at Khorgos cut transit times to Chinese smelters from 21 days to 14 days, lowering landed costs by USD 120-150 per tonne and enabling sellers to capture a 3-4% price premium over seaborne cargoes. Newly drilled resources in the Balkhash basin add 4.8 million tonnes of inferred copper, supporting a moderate annual output hike through 2030.
Government-Led Uranium Expansion Plans
Kazatomprom approved USD 1.2 billion for six new in-situ leach wellfields and sulfuric-acid capacity, seeking 28,000 tonnes of uranium by 2028—roughly 43% of global supply. With 62 gigawatts of nuclear capacity under construction in China, India, and the UAE, long-term fuel contracts provide predictable demand. In-situ leach cuts capital intensity by up to 50% and slashes water use in the arid Chu-Sarysu basin. Capturing conversion margins at the Ulba Metallurgical Plant could add USD 400-500 million in annual export value by 2030.
Modernisation of Coal-Fired Power Fleet
Coal still supplies 68% of Kazakhstan’s electricity, yet average plant efficiency trails modern standards at just 32%. A USD 3.8 billion retrofit program launched in 2025 targets 12 gigawatts at Ekibastuz, Almaty, and Shardara, aiming for 15-18% lower coal burn per megawatt-hour. Stable demand at 38-40 million tonnes per year underpins volumes for Bogatyr Coal even as renewables scale. Co-firing upgrades act as a hedge against potential EU carbon border measures post-2028.
Belt and Road Rail Upgrades Slash Export Costs
Completion of the Khorgos-Almaty double-track line in 2024 reduced average dwell time for concentrates from 72 hours to 18 hours and cut freight charges by 22%[1]China Railway Corporation, “Khorgos-Almaty Line Completion,” crchina.com . As a result, exports of copper, zinc, and lead concentrates to China jumped to 14.2 million tonnes in 2025 from 11.8 million tonnes in 2023. Equipment inflows from China now reach mine sites 30% faster, freeing working capital and accelerating project schedules. The Trans-Caspian route handled 1.9 million tonnes to Turkey and the Balkans in 2025, diversifying customer exposure.
Restraints Impact Analysis*
| Restraint | (~) % Impact on CAGR Forecast | Geographic Relevance | Impact Timeline |
|---|---|---|---|
| Volatile Global Commodity Prices | -1.4% | Global, with acute exposure in copper and zinc export revenues | Short term (≤ 2 years) |
| Ageing Mine Infrastructure | -0.9% | National, concentrated in Karaganda, Pavlodar, and Kostanay legacy sites | Medium term (2-4 years) |
| Chronic Skilled-Labour Out-Migration | -1.1% | National, with spillover effects on project execution timelines | Long term (≥ 4 years) |
| Source: Mordor Intelligence | |||
Volatile Global Commodity Prices
Copper prices swung from USD 9,850 per tonne in Jan 2024 to USD 6,400 in Oct 2024 before rebounding to USD 8,900 by mid-2025, squeezing mid-tier margins[2]London Metal Exchange, “Historical Copper Prices,” lme.com . Only 18% of 2025 output was hedged, versus 35-40% for peers in Chile and Australia. Limited access to derivatives leaves smaller firms exposed to spot risk or burdensome tolling terms with Chinese smelters.
Ageing Mine Infrastructure
Equipment at Soviet-era sites averages 27 years old, causing downtime above 22% of scheduled hours in 2025. Replacement needs total USD 4.2 billion across the top 15 legacy mines, yet debt covenants and dividend commitments restrict capex. Productivity per worker-hour is 1.8 tonnes versus 3.2 tonnes in Australia, widening the competitiveness gap.
*Our forecasts treat driver/restraint impacts as directional, not additive. The impact forecasts reflect baseline growth, mix effects, and variable interactions.
Segment Analysis
By Mineral Type: Non-Ferrous Momentum Overtakes Copper’s Lead
The coal segment captured 38.80% of revenue in 2025, while the non-ferrous metal segment is set for growth at a 10.56% CAGR through 2031. Kazzinc’s Ust-Kamenogorsk refinery is boosting zinc capacity to 360,000 tonnes by 2026, while Tau-Ken Samruk’s Zhairem discovery underpins a 1.2 million-tonne underground mine by 2029. Rare-earth commitments of USD 180 million in 2025 further diversify earnings as battery materials demand rises.
A second wave of investment targets manganese-lead-zinc ore in the Altai and Balkhash belts, underlining the pivot from bulk ferrous to specialty metals. Ferrous ores still feed 4.2 million tonnes of crude steel at ArcelorMittal Temirtau, but renewable power and rising scrap use constrain iron-ore upside. Coal output from Ekibastuz stabilizes electricity supply yet faces efficiency-driven demand plateaus.



By Mining Method: In-Situ Leach Accelerates in Uranium Belt
Surface (open-pit) accounts for 57.80% of 2025 share, reflecting coal’s scale and large copper porphyries. However, in-situ leach is outpacing, growing at 10.22% annually. The technology slashes upfront spending to USD 180-220 million for a 2,000-tonne unit and eliminates tailings dams, lowering permitting risk.
Underground methods service high-grade polymetallic and gold lodes in Ridder and Zyryanovsk, though costs run to USD 42 per tonne versus USD 28 for open-pit. Autonomous haulage at Vostochny lifted ore movement 11% and cut diesel use 9% in 2025, illustrating how digital adoption is narrowing cost differentials.
By End-User Industry: Nuclear Fuel and Chemicals Lead Growth
Steel and alloy production absorbed 30.10% of output in 2025, yet “Other End-user Industries” are advancing fastest at 11.28% CAGR through 2031. Uranium feedstock for Chinese, Russian, and French fuel fabricators anchors baseline demand, while zinc sulfate production at Ridder captures a 15-20% premium over commodity zinc. Construction materials supplied by limestone and gypsum quarries benefit from a 14% rise in 2025 government infrastructure spending.
Agricultural micronutrient markets, buoyed by demand for zinc fertilizers, and pharmaceutical uses for zinc sulfate diversify cash flows. Combined with stable coal burn at retrofitted power plants, these niches offset the cyclical swings of base-metal exports.
Geography Analysis
Pavlodar’s Ekibastuz basin produced 118 million tonnes of coal, while Kyzylorda and Turkestan delivered 87% of uranium via in-situ leach wells. East Kazakhstan’s copper and polymetallic hubs earned USD 4.8 billion in 2025 exports yet face 2-3% annual growth caps from labor shortages.
Western diversification is gaining momentum. Mangystau and Atyrau secured USD 340 million for lithium-brine exploration in 2024-2025 as assays suggest 18,000-22,000 tonnes of lithium carbonate equivalent by 2030. Turkestan’s proximity to Uzbekistan spurred a USD 280 million rare-earth separation facility slated for 2028. Kostanay’s Lisakovsk iron ore required USD 420 million in beneficiation in 2025 to offset grade decline from 32% to 28%.
Transport gaps drive cost disparities. The Khorgos-Almaty rail saves 18-22% versus trucking, but Aktau port congestion in the west adds 8-12 days and USD 35-50 per tonne to freight. A USD 1.6 billion Trans-Caspian upgrade aims to equalize access by 2029, potentially unlocking 2-3 million tonnes of new export capacity.
Regulatory Landscape
Kazakhstan regulates solid minerals primarily through the Code of the Republic of Kazakhstan "About subsoil and subsurface use," administered via the Ministry of Industry and Construction (MIC), while uranium governance sits with the Ministry of Energy. Amendments adopted on 30 December 2025 and effective from 2 March 2026 refreshed licensing and compliance requirements, reinforcing the state role in resource stewardship alongside the existing subsoil use contract framework.
Operationally, licensing and data access are tightening around demonstrated capability and localization. GeoCom manages geological data and licensing for geological survey, and updated licensing rules for solid mineral extraction require applicants to evidence professional and technical capacity, including relevant operating licenses. Subsoil use contracts continue to embed obligations on local personnel and procurement of goods and services, aligning investment decisions with in-country execution and supplier development.
Value Chain Analysis
The value chain runs from licensing and geological data access (GeoCom and subsoil licensing) through exploration, mine development and extraction (open-pit, underground, and in-situ leach), beneficiation and concentration, then processing into metals and chemical intermediates, followed by domestic sales and exports via rail and Trans-Caspian logistics. In uranium, Kazatomprom anchors upstream wellfield development and downstream conversion and fabrication linkages, with supply security and contract structures shaping the flow from in-situ leach production into the broader nuclear fuel cycle.
Midstream and downstream integration remains a lever for capturing margins that would otherwise accrue in external processing hubs. Industrial policy emphasis on vertical integration shows up in company actions and trade flows, including ERG signing a three-year cobalt supply agreement with Electra Battery Materials for 3,000 tonnes per year of cobalt hydroxide starting 2025/2026, and logistics diversification via the Trans-Caspian International Transport Route (Middle Corridor) to reduce route concentration risk for strategic materials. On the supply side, Kazatomprom communicated a 2026 nominal uranium production reduction to 29,697 tonnes (100% basis) from 32,777 tonnes, illustrating how upstream production decisions ripple through conversion, transport scheduling, and offtake planning.
Competitive Landscape
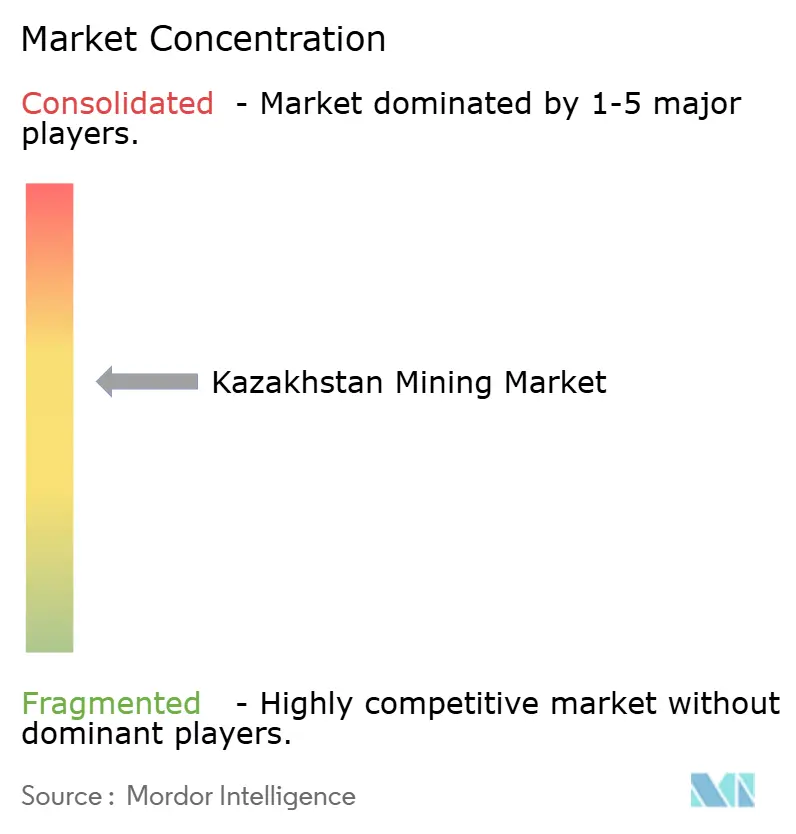
The top five operators—Bogatyr Komir, Eurasian Resources Group, Kazatomprom, KAZ Minerals, and Kazakhmys—controlled 54% of 2025 output, giving the Kazakhstan mining market a moderate concentration profile. Kazatomprom’s 2024 purchase of 49% of Ulba Metallurgical Plant secures conversion margins as global nuclear demand rises. Eurasian Resources Group’s 14 autonomous trucks cut costs 7-9% in 2025, a gap mid-tiers struggle to match.
White-space growth centers on lithium, rare earths, and specialty metals where foreign partners invested USD 520 million during 2024-2025. Tau-Ken Samruk advanced 11 greenfields using its data edge and faster permits, while Ken Resources raised USD 53 million in early 2026 for Satpayev copper-gold. Regulatory shifts mandate 51% local content and joint ventures for lithium and rare earths, accelerating technology transfer but raising entry barriers for passive investors.
Digital adoption is uneven. Drone surveying, predictive maintenance, and automated drilling are standard at tier-one sites, yet Ridder’s mid-tier miners still rely on Soviet-era gear. With labor outflows persisting, automation investment is becoming a competitive necessity rather than a choice.
Kazakhstan Mining Industry Leaders
NAC Kazatomprom JSC
Kazakhmys Corporation LLC
Eurasian Resources Group
KAZ Minerals
Bogatyr Coal
- *Disclaimer: Major Players sorted in no particular order

Market Opportunities and Future Outlook
A primary opportunity is deep processing of critical minerals, supported by named financing and industrial programs rather than concentrate-only exports. The Development Bank of Kazakhstan (DBK) established a USD 1 billion program for 2025-2030 dedicated to extraction and processing of critical materials such as lithium, tungsten, and rare earth elements, and national industrial strategy prioritizes movement from raw material exports to higher value-added industrial goods. This shifts the addressable market toward concentrators, hydrometallurgy, and specialty chemical processing.
Platform and project-level actions create near-term whitespace for suppliers of technology, project development, and capital structuring. ERG committed over USD 1 billion for Kazakhstan mining and metallurgical operations aimed at higher value-added outputs, including a 2 million tonnes/year HBI plant and gallium recovery capability in Pavlodar, while the Astana International Financial Centre (AIFC) is being used to attract foreign investment and strategic partnerships. In parallel, efforts to build multi-layer tungsten value chains, from chemical processing through tungsten carbide, point to pull for downstream capacity, quality control, and compliant sourcing systems that can link Kazakhstan feedstock to end-users beyond commodity concentrate markets.
Recent Industry Developments
- July 2026: Kazatomprom executed coupon payment on bonds listed on Astana International Exchange (AIX). The debt service event for a major uranium producer highlights liquidity management during a 2025-26 uranium demand cycle and helps maintain bondholder confidence. The action reinforces access to capital and supports visibility for Kazakhstan's nuclear fuel market.
- June 2026: Eurasian Resources Group commissioned world’s first vertical bauxite mining project at Vostochno Ayatskoye. The novel mining technology deployment in Kazakhstan expands ERG's output potential in non-uranium metals. The update signals portfolio diversification and could influence cost structures and supply dynamics.
- June 2026: Kazatomprom convened Extraordinary General Meeting to approve technical amendment to long-term uranium supply contract with China National Uranium Corporation Limited. The reinforced contract framework improves visibility for nuclear fuel supply in Kazakhstan. The action strengthens strategic alignment with China and secures a stable demand channel for uranium.


Research Methodology Framework and Report Scope
Market Definition and Coverage
For this methodology, the Kazakhstan mining market is defined as the value generated from extracting and preparing mined materials within Kazakhstan across the main mineral groups, counted at the industry level in USD and tracked over time.
Scope exclusions: This sizing excludes downstream metals manufacturing and fabrication, as well as non-mining oil and gas activities.
Segmentation Overview
- By Mineral Type
- Coal
- Ferrous Metal
- Non Ferrous Metal
- By Mining Method
- Surface (Open-pit)
- Underground
- In-situ Leach
- By End-user Industry
- Steel and Alloy Production
- Power Generation
- Non-Ferrous Smelting
- Construction Materials
- Other End-user Industries (Nuclear Fuel Cycle, Chemical Processing, etc.)
Data Sources, Market Sizing, and Validation
Desk Research
Desk work starts with official production and sector statistics for Kazakhstan so the model is anchored to what is actually extracted, processed at the mine stage, and reported by public bodies. Sources used for this include materials such as the Bureau of National Statistics of Kazakhstan releases, Ministry of Industry and Construction updates, UN Comtrade trade statistics, and USGS mineral summaries and commodity data.
We then layer in company disclosures and project signals to understand what changed and why, including annual reports, investor presentations, sustainability disclosures, and credible local and international press coverage. When available, paid subscriptions were used in limited ways for company financial intelligence and for import and export shipment-level checks, which helped us cross-check volumes and pricing direction. The sources listed here are illustrative and not exhaustive, since many other documents were also referenced for data collection, validation, and clarification.
Primary Interviews and Surveys
Our Kazakhstan fieldwork uses interviews and surveys with mining executives, functional and unit leaders, technical specialists, commercial managers, and service-side managers. Their views help check production trends, realized prices, capacity additions, operating conditions, and gaps in secondary data before assumptions and final analysis are triangulated.
Distribution of primary research fieldwork respondents
| Company type | Respondent position |
|---|---|
| Top tier: 26% | CXOs: 16% |
| Mid tier: 49% | Functional/Unit leaders: 32% |
| Smaller Players: 25% | Managers: 52% |
Market-Sizing & Forecasting
Sizing starts with a top-down build where Kazakhstan production and trade series are used to reconstruct value pools by major mineral group, and then mapped to mining methods and end-use pull to keep the totals realistic. Once that full picture is in place, we corroborate it with selective bottom-up checks using sampled operator and processor revenue patterns, a few volume-by-price calculations for key commodities, and discussions through sector channels that help flag outliers.
Inputs used in the model include mined output volumes, export volumes and destination mix, benchmark commodity prices and local realized price adjustments, mine mix shifts between surface, underground, and in-situ leach where applicable, and the expected ramp-up timing for announced projects. To forecast, scenario analysis is used because prices and output can move sharply year to year, and then assumptions are adjusted using expert views on capacity additions, logistics constraints, and policy-driven investment cycles. Where data gaps exist for smaller sites or less disclosed minerals, estimates are built using proxy production indicators and then normalized back to national totals so we do not over-count the long tail.
Data Validation & Update Cycle
Validation is done by checking whether modeled value trends move in line with independent signals such as national mining revenue references, export earnings, and commodity price movements in the same period. Any sharp jumps are reviewed, and the underlying drivers are re-tested through additional desk checks and follow-up re-contacts with interviewees when needed, before final sign-off.
Reports are refreshed annually, and interim updates are made when a material event changes the outlook, such as a large project delay, a major policy change, or an unexpected price shock. Before delivery, we do a final pass to ensure the model reflects the latest available data and that key assumptions are still consistent across the full time series.
Mordor Intelligence's Kazakhstan Mining Market Size Versus Other Published Estimates
Published market numbers for Kazakhstan mining can look different even when they are all trying to describe the same sector, because the included activities, the pricing logic, and the timing of updates are not always aligned. Differences also show up when one source reports a revenue proxy for a past year, while another estimates a forward-looking market value using projected volumes and prices.
The main gap comes from whether mining is counted as pure extraction value versus a wider mining and metals view, and from how commodity prices are carried into the base year. For that reason, Mordor Intelligence keeps the scope tied to mining activities and refreshes price and output inputs to the latest available cut as of January 2026.
Benchmark comparison
| Source | Market Size | Gaps in Research Methodology |
|---|---|---|
| Mordor Intelligence | USD 29.42 B (2025) | |
| Sector Report Publisher A | USD 30.00 B (2024) | Uses a different base year and may blend mining output valuation with broader mining and metallurgy-related revenue pools, which can shift totals when prices and downstream value are partly captured. |
| Government Trade Brief B | USD 19.10 B (2023) | Represents national mining revenues as a historical indicator, not a forward-looking market value model, and the definition can differ by what is counted as mining revenue versus adjacent processing. |
The comparison shows that year selection and what gets included around mining versus adjacent processing are the biggest drivers of the spread. By keeping the steps traceable to production, trade, and pricing inputs, the resulting estimate stays easier to reconcile with real-world signals and to replicate when assumptions need to be updated later on.


Key Questions Answered in the Report
How large is the Kazakhstan mining market in 2026?
The Kazakhstan mining market size is USD 32.33 billion in 2026 and projected to reach USD 51.81 billion in 2031, with a CAGR of 9.89%.
Which segment holds the largest share of mining revenue?
Coal is accounting for 38.80% of Kazakhstan mining market share in 2025.
What method is growing fastest for uranium extraction?
In-situ leach technology is expanding at a 10.22% CAGR through 2031, driven by Kazatomprom’s new wellfields.
Which end-user sector is set to grow most rapidly?
The “Other End-user Industries” segment is projected to grow at 11.28% CAGR to 2031.
Page last updated on:


 Your data is secure and never sold or shared.


