Japan Geospatial Analytics Market Size and Share
Market Overview
| Study Period | 2020 - 2031 |
|---|---|
| Forecast Data Period | 2026 - 2031 |
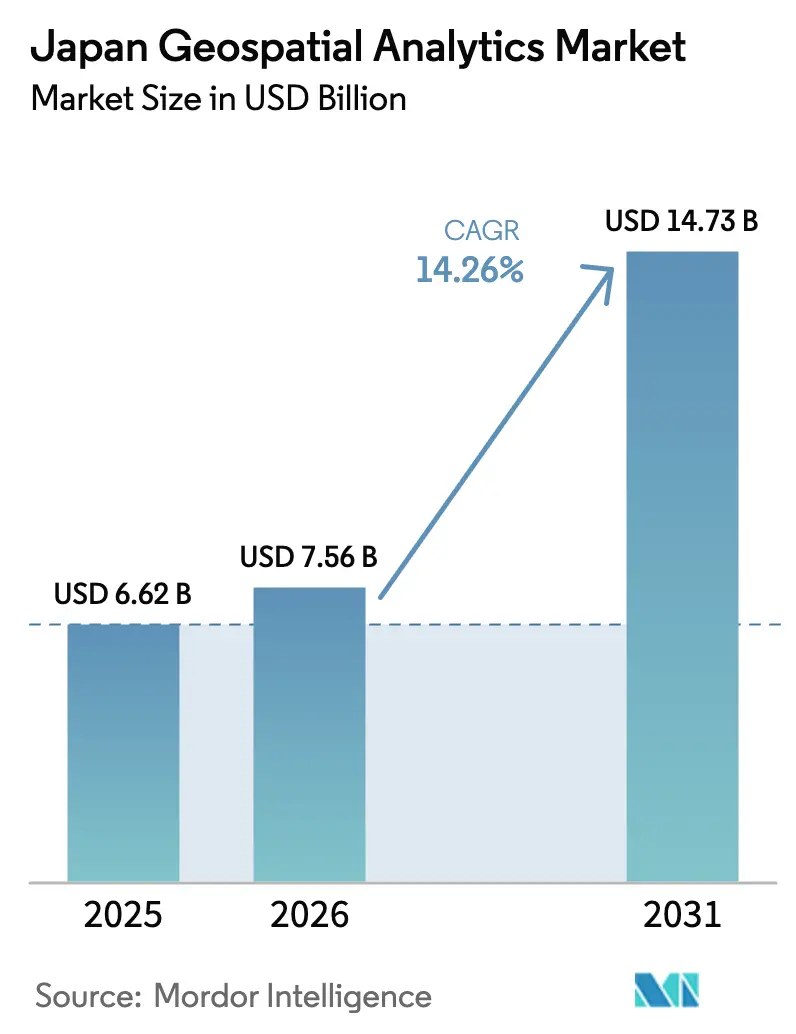
| Base Year Market Size (2025) | USD 6.62 Billion |
| Market Size (2026) | USD 7.56 Billion |
| Market Size (2031) | USD 14.73 Billion |
| Growth Rate (2026 - 2031) | 14.26% CAGR |
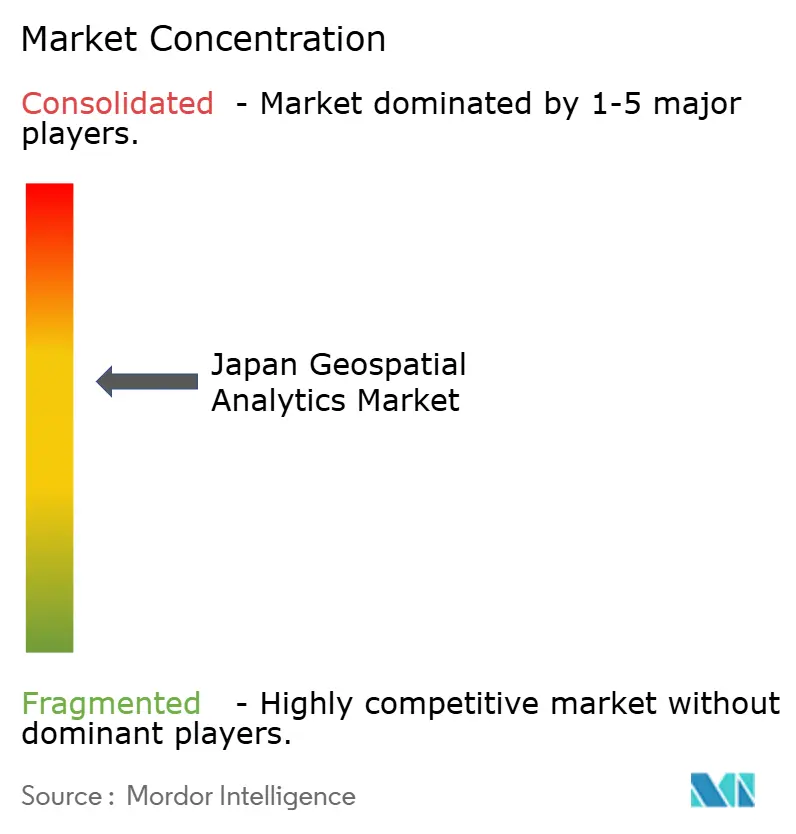
| Market Concentration | Medium |
Major Players *Disclaimer: Major Players sorted in no particular order Image © Mordor Intelligence. Reuse requires attribution under CC BY 4.0. | |
Japan Geospatial Analytics Market Analysis by Mordor Intelligence
The Japan geospatial analytics market size is expected to grow from USD 6.62 billion in 2025 to USD 7.56 billion in 2026 and is forecast to reach USD 14.73 billion by 2031 at 14.26% CAGR over 2026-2031. Policy stimulus under Society 5.0, the Digital Agency’s data-interoperability architecture and rising disaster-resilience investment keep the growth curve steep. Predictive-modeling engines that fuse multisource data are now embedded in municipal control rooms, a direct response to the 2024 Noto Peninsula earthquake. Cloud migration intensifies as the Digital Agency pre-provisions sovereign Gov-Cloud zones, though on-premise GIS stacks remain entrenched in critical infrastructure portfolios. LiDAR and 3-D mapping adoption rides on the JPY 1 trillion (USD 6.7 billion) Space Strategy Fund earmarked for domestic satellite constellations.[1]New Zealand Ministry of Foreign Affairs and Trade, “Blastoff! Japan's growing space sector,” mfat.govt.nz Route-optimization solutions for e-commerce fleets gain traction as retailers mitigate the “2024 problem” labour crunch through real-time spatial intelligence.
Key Report Takeaways
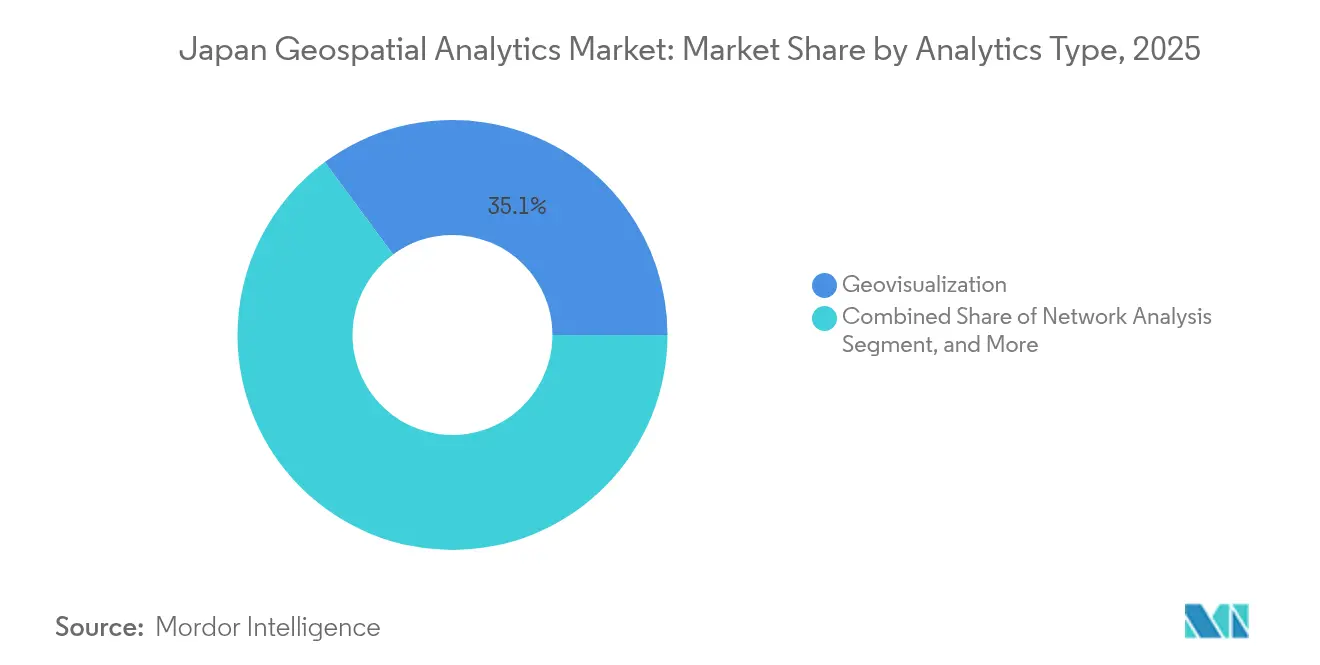
- By analytics type, geovisualization held a 35.12% Japan geospatial analytics market share in 2025; predictive modeling records an 17.89% CAGR through 2031.
- By deployment model, on-premise systems captured 61.55% of the Japan geospatial analytics market size in 2025, while cloud platforms post the highest 20.06% CAGR.
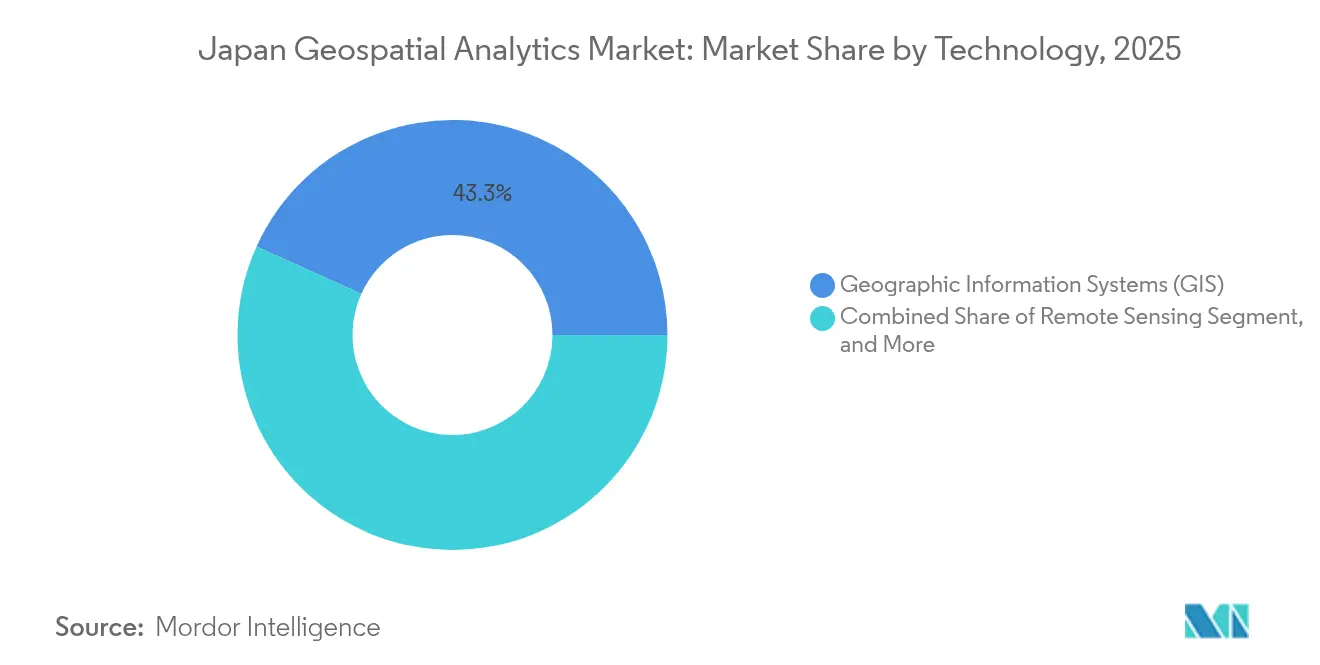
- By technology, Geographic Information Systems represented 43.25% of the Japan geospatial analytics market size in 2025; LiDAR + 3-D mapping leads with a 19.36% CAGR.
- By end-user vertical, government agencies accounted for 23.25% Japan geospatial analytics market share in 2025; retail & logistics is forecast to expand at 17.24% CAGR.
Note: Market size and forecast figures in this report are generated using Mordor Intelligence’s proprietary estimation framework, updated with the latest available data and insights as of 2026.
Expected changes in Japan many a times form part of a broader pattern of global movement rather than an isolated trend. The report on worldwide geospatial analytics market outlook by Mordor Intelligence brings these expectations together.
Japan Geospatial Analytics Market Trends and Insights
Drivers Impact Analysis*
| Driver | (~) % Impact on CAGR Forecast | Geographic Relevance | Impact Timeline |
|---|---|---|---|
| Smart-city roll-outs accelerating demand | +3.2% | National, with early gains in Tokyo, Osaka, Fukuoka | Medium term (2-4 years) |
| 5G-enabled real-time location analytics | +2.8% | National, concentrated in major metropolitan areas | Short term (≤ 2 years) |
| Government open-data and G-space project policies | +2.5% | National, with priority implementation in disaster-prone regions | Long term (≥ 4 years) |
| Disaster-resilient infrastructure planning needs | +2.1% | National, with emphasis on seismic zones and coastal areas | Medium term (2-4 years) |
| Autonomous drone-delivery pilots | +1.6% | Regional, focused on rural and isolated communities | Medium term (2-4 years) |
| Location-based carbon-accounting mandates | +1.3% | National, with industrial concentration in manufacturing hubs | Long term (≥ 4 years) |
| Source: Mordor Intelligence | |||
Smart-city roll-outs accelerating demand
Cabinet Office guidelines require standardized geospatial IDs, obliging vendors to embed GIS-ready schemas in every city-service platform.[2]Tokyo Metropolitan Government, “都市のデジタルツインをWebブラウザで体感!,” info.tokyo-digitaltwin.metro.tokyo.lg.jp Tokyo’s Digital Twin visualizes live transit, demographic and utility streams, driving operating-cost savings and resilience gains. Private developers replicate the blueprint; the Takeshiba district platform blends visitor-flow data with weather-linked coupons, while Obayashi’s Area Data Platform gives landlords near-real-time footfall analytics. Forty-plus municipalities adopted GC Navi via the Digital Agency marketplace, demonstrating scale in second-tier cities.
5G-enabled real-time location analytics
Nationwide 5G coverage unlocks sub-second positional feeds. Hitachi’s 600 km data-synchronization trial over the IOWN All-Photonics Network validated fail-safe rail signalling.[3]Hitachi, Ltd., “国内初、5Gを活用した鉄道システムの実証試験,” hitachi.co.jp KDDI’s Location Analyzer reverse-visit function refines trade-area analysis for omnichannel retail. Edge 5G backbones link rural BVLOS drones that deliver pharma supplies, reducing last-mile costs and emissions.
Government open-data and G-space policies
MLIT’s National Land Numerical Information portal publishes once-proprietary layers under Creative Commons, catalysing private innovation. Tellus democratizes satellite imagery, letting start-ups prototype land-monitoring apps at zero cost. A cross-ministry service mesh now aligns location keys, cutting integration time for national projects.
Disaster-resilient infrastructure planning
Central government earmarked JPY 20 trillion (USD 133.3 billion) for resilience outlays over fiscal 2026-2030. University of Tokyo models convert LiDAR scans into near-real-time fault geometry to inform rescue routing. Multi-hazard control centres in coastal prefectures fuse bathymetry and social-media sentiment, trimming flood-alert lead times by 8%.
Restraints Impact Analysis*
| Restraint | (~) % Impact on CAGR Forecast | Geographic Relevance | Impact Timeline |
|---|---|---|---|
| High software and data acquisition cost | -1.8% | National, with greater impact on SMEs and local governments | Short term (≤ 2 years) |
| Stringent privacy and intellectual-property laws | -1.2% | National, with particular emphasis on healthcare and financial sectors | Medium term (2-4 years) |
| Shortage of advanced geospatial data scientists | -0.9% | National, with acute shortages in rural areas and specialized sectors | Medium term (2-4 years) |
| Ageing EO-satellite refresh gap | -0.7% | National, affecting data continuity and accuracy | Long term (≥ 4 years) |
| Source: Mordor Intelligence | |||
High software & data-acquisition cost
A surveying CAD licence like TREND-ONE retails at JPY 540,000 (USD 3,600) while recurring imagery subscriptions stack additional expense. Vendors shift to SaaS; Trimble’s ARR mix hit 75%, raising life-cycle outgoings. Fragmented data origin demands multi-vendor licences and integration budgets that small councils lack.
Stringent privacy and IP laws
Japan’s Personal Information Protection Act obliges granular consent for location datasets, curbing high-resolution mobility analytics. Compliance modelling grows complex as regulators benchmark rules against GDPR. Liability over satellite-image accuracy complicates commercial property underwriting.
*Our forecasts treat driver/restraint impacts as directional, not additive. The impact forecasts reflect baseline growth, mix effects, and variable interactions.
Segment Analysis
By Analytics Type: Predictive Modeling Drives Innovation
Predictive solutions will advance at 17.89% CAGR; earthquake-uplift models from the University of Tokyo refine relief-asset allocation windows. NDVI-driven harvest planners deployed across Hokkaido co-operatives raise yield stability amid climate variability. Geovisualization, still 35.12% of 2025 revenue, stays essential for executive-level decision pipelines.
Aviation regulators simulate unmanned-traffic corridors using network-analysis engines to deconflict drone and manned aircraft routes. Surface-analysis platforms aid slope-stability checks on alpine roads, while tourism boards integrate 3-D fly-throughs to entice higher-spend visitors.


By Deployment Model: Cloud Transformation Accelerates
Cloud revenue grows 20.06% CAGR yet on-premise holds 61.55% share due to data-sovereignty doctrine in defence and power grids. Gov-Cloud certifications now stipulate domestic data-centres, propelling NTT DATA’s hyperscale pipeline. Hybrid footprints prevail where sensor latency or blackout-resilience is critical.
Smart Map’s pay-as-you-go model widens GIS access for mid-sized cities. Edge devices store buffer data, syncing to GPU clouds during network uptime to meet continuity targets in quake or typhoon events.
By Technology: LiDAR and 3-D Mapping Surge
LiDAR + 3-D mapping surge 19.36% CAGR, buoyed by autonomous-vehicle corridors and Ministry-funded digital-twin roads. Dynamic Map Platform’s BRIDGE win secures HD map coverage for ports and airports, and the firm’s Terrasolid pact globalises point-cloud distribution. Map4’s Vector Map Generator trims processing cycles from weeks to hours.
GIS retained a 43.25% revenue share in 2025, underpinning data harmonisation. GNSS accuracy upgrades enhance agricultural robot navigation, while spatial big-data engines ingest terabytes of SAR imagery, IoT feeds and traffic probes.
By End-user Vertical: Government Leadership with Retail Acceleration
Government made up 23.25% spending in 2025, underwriting multi-agency dashboards for land planning and fiscal-investment oversight. Retail & logistics is growing 17.24% CAGR; real-time catchment and ETA dashboards allow fleets to service e-commerce surge despite driver caps.
Utilities deploy LiDAR vegetation-encroachment scans to avert power outages. Agriculture layers drone NDVI with soil sensors to reduce fertiliser over-spray. Healthcare pilots mesh environmental and morbidity data to predict heat-stroke clusters, compliant with anonymisation clauses.
Geography Analysis
The Japan geospatial analytics market shows fastest momentum in the Tokyo–Osaka–Nagoya triangle, topping USD 3.47 billion in 2026 through congestion-management and asset-lifecycle programs. Expo 2025 catalyses Osaka’s edge-analytics installations, while Aichi’s OEMs integrate HD maps into robo-shuttle pilots.
Chubu’s renewables developers run terrain-suitability models for offshore wind. Tohoku municipalities, still rebuilding post-2011, receive central grants to install quake-early-warning dashboards. Rural prefectures deploy drone orthophotos for bridge inspections and paddy field NDVI mapping to offset agronomist scarcity.
Island regions adopt tsunami-route simulators combining bathymetry and handset-pings to guarantee elderly evacuation compliance. Hokkaido’s snow-mapping drones support winter logistics, feeding 3-D mesh layers into PASCO dashboards.
Mordor Intelligence's coverage of the geospatial analytics market extends across other regions including Africa and Middle East, while country-specific intelligence is also available for India, China, Nigeria, Saudi Arabia, Israel, Russia, and Germany, each offering a view on the jurisdiction-level dynamics as applicable.
Competitive Landscape
Moderate concentration defines the Japan geospatial analytics market: the top five suppliers notch 45% share. ESRI Japan leads foundational GIS, PASCO dominates aerial surveys and LiDAR, and NTT DATA leverages cloud + satellite capabilities. Dynamic Map Platform monetises API access to HD road meshes across logistics, while Hexagon’s planned spin-off simplifies geospatial focus.
International imagery providers such as Maxar supply SAR and optical data, yet procurement guidelines privilege domestic firms to maintain data sovereignty. Partnerships drive scale: NTT DATA, PASCO and Canon Electronics co-build a 2027 satellite network, internalising the imagery supply chain. Hitachi partners Singtel for green GPU clouds that host compute-heavy raster AI services.
Start-ups gain niche traction: Space Shift embeds AI models into the GEOHUB platform targeting Southeast Asian climate-risk projects; Map4 automates vectorisation and sells pay-per-output licences. Trimble bundles IoT field sensors with SaaS, steering users into multi-year subscription contracts.
Japan Geospatial Analytics Industry Leaders
Hexagon AB
Trimble Inc.
Alteryx, Inc.
TomTom N.V.
Maxar Technologies Inc.
- *Disclaimer: Major Players sorted in no particular order

Recent Industry Developments
- July 2025: Space Shift and VegaCosmos allied to extend GEOHUB satellite-data use in Vietnam and Japan.
- June 2025: Map4 debuted Vector Map Generator, automating point-cloud vectorisation.
- May 2025: Dynamic Map Platform secured Cabinet Office BRIDGE funding for public-area autonomous-vehicle HD maps.
- April 2025: Dynamic Map Platform and Terrasolid signed an MoU to co-market high-precision 3-D data worldwide.


Japan Geospatial Analytics Market Report Scope
Geospatial analytics is acquiring, manipulating, and displaying imagery and data from the geographic information system (GIS), such as satellite photos and GPS data. The specific identifiers of a street address and a zip code are used in geospatial data analytics. They are used to create geographic models and data visualizations for more accurate trend modeling and forecasting.
The scope of the study focuses on the market analysis segmented by type (surface analysis, network analysis, and geovisualization) and end-user vertical (agriculture, utility and communication, defense and intelligence, government, mining and natural resources, automotive and transportation, healthcare, real estate, and construction). The market sizes and forecasts are provided in terms of value (USD) for all the above segments.
| Surface Analysis |
| Network Analysis |
| Geovisualization |
| Predictive Modelling |
| On-premise |
| Cloud-based |
| Hybrid |
| Geographic Information Systems (GIS) |
| Remote Sensing |
| Global Navigation Satellite System (GNSS/GPS) |
| LiDAR and 3-D Mapping |
| Spatial Big-Data and AI Platforms |
| Agriculture |
| Utility and Communication |
| Defense and Intelligence |
| Government |
| Mining and Natural Resources |
| Automotive and Transportation |
| Healthcare |
| Real-estate and Construction |
| Retail and Logistics |
| Other End-user Verticals |
| By Analytics Type | Surface Analysis |
| Network Analysis | |
| Geovisualization | |
| Predictive Modelling | |
| By Deployment Model | On-premise |
| Cloud-based | |
| Hybrid | |
| By Technology | Geographic Information Systems (GIS) |
| Remote Sensing | |
| Global Navigation Satellite System (GNSS/GPS) | |
| LiDAR and 3-D Mapping | |
| Spatial Big-Data and AI Platforms | |
| By End-user Vertical | Agriculture |
| Utility and Communication | |
| Defense and Intelligence | |
| Government | |
| Mining and Natural Resources | |
| Automotive and Transportation | |
| Healthcare | |
| Real-estate and Construction | |
| Retail and Logistics | |
| Other End-user Verticals |


Key Questions Answered in the Report
What is the forecast size of the Japan geospatial analytics market by 2031?
It is projected to hit USD 14.73 billion, growing at a 14.26% CAGR.
Which segment records the fastest growth?
Predictive modeling leads, advancing at 17.89% CAGR through 2031 as agencies embed anticipatory analytics into disaster-resilience and agriculture programs.
How will cloud deployment evolve?
Cloud workloads will expand fastest at 20.06% CAGR, though hybrid architectures will dominate mission-critical government and utility settings.
Why are LiDAR and 3-D mapping critical?
These technologies fuel autonomous-vehicle corridors, infrastructure digital twins and precision agriculture, explaining their 19.36% CAGR.
What government funding supports disaster resilience?
A JPY 20 trillion (USD 133.3 billion) program covering fiscal 2026-2030 funds nationwide infrastructure monitoring and real-time hazard analytics platforms.
How does strict privacy regulation affect the market?
The Personal Information Protection Act necessitates transparent consent frameworks, adding compliance cost and limiting certain high-resolution mobility-analytics applications.
Page last updated on:


