
Market Overview
| Study Period | 2020 - 2031 |
|---|---|
| Forecast Data Period | 2026 - 2031 |
| Base Year Market Size (2025) | USD 404.37 Billion |
| Market Size (2026) | USD 433.12 Billion |
| Market Size (2031) | USD 610.61 Billion |
| Growth Rate (2026 - 2031) | 7.11 % |
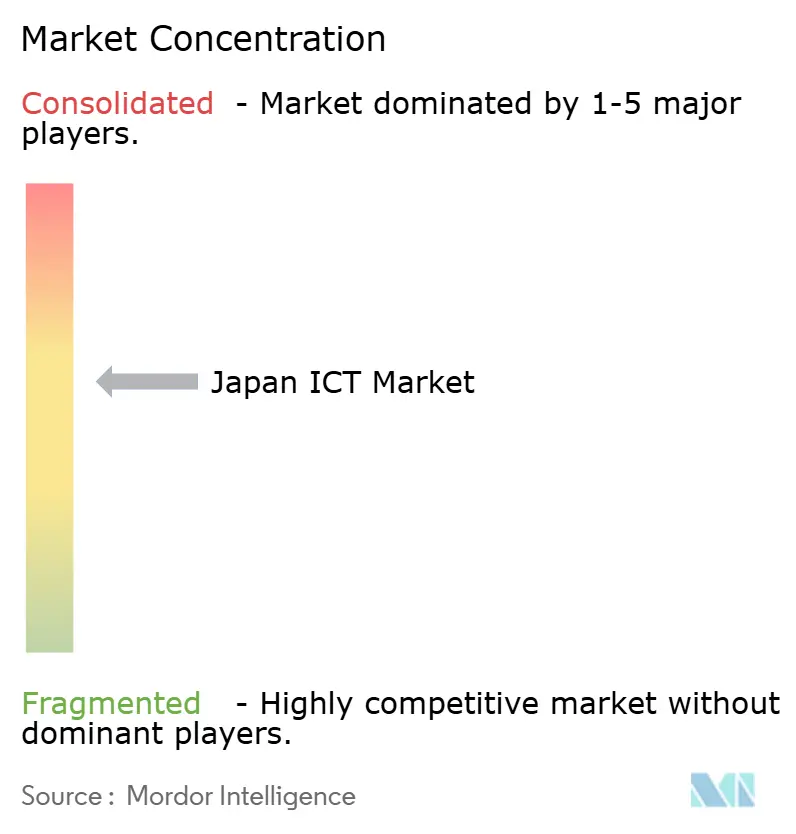
| Market Concentration | Medium |
Major Players *Disclaimer: Major Players sorted in no particular order Image © Mordor Intelligence. Reuse requires attribution under CC BY 4.0. | |
Japan ICT Market Analysis by Mordor Intelligence
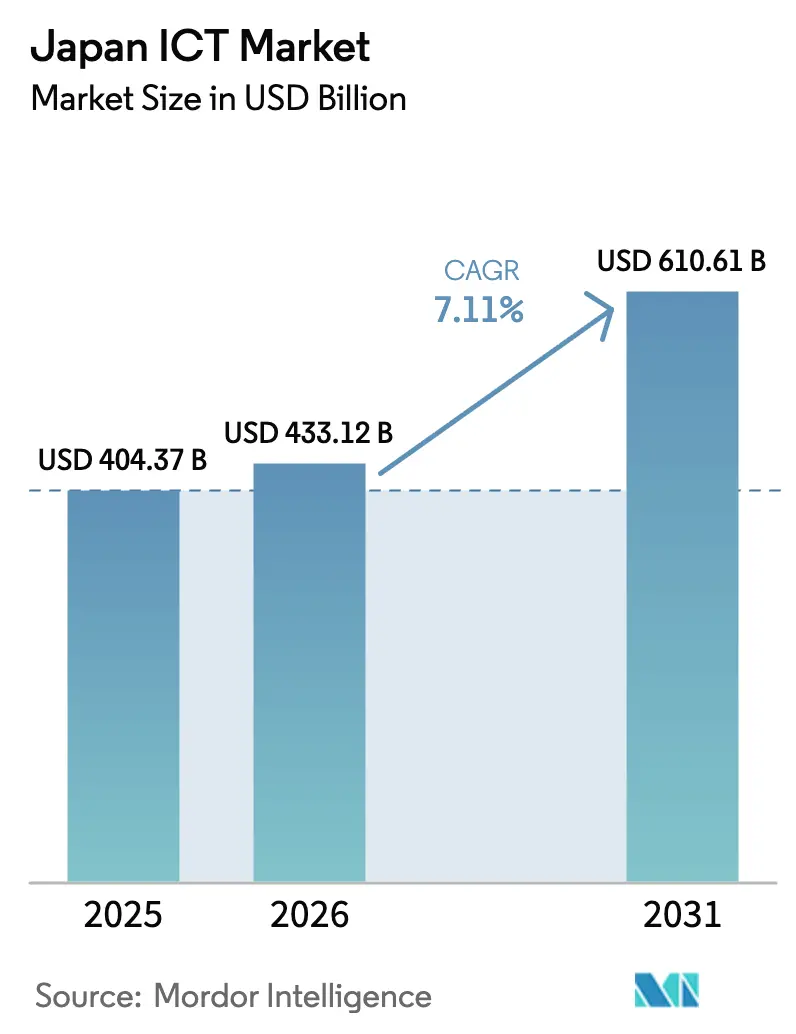
Japan ICT market size in 2026 is estimated at USD 433.12 billion, growing from 2025 value of USD 404.37 billion with 2031 projections showing USD 610.61 billion, growing at 7.11% CAGR over 2026-2031.[1] Enterprise commitments to modernize legacy mainframe estates before the “2025 cliff,” combined with Society 5.0 policy initiatives, are accelerating spending on hybrid cloud, AI infrastructure, and cybersecurity solutions.[2] Hyperscaler region build-outs exceeding USD 17.9 billion since 2024 are expanding domestic data-center capacity and creating multiplier effects for software, networking, and managed services demand Shrinking working-age population is intensifying automation investments, while ISMAP certification is reshaping procurement by favoring providers that meet more than 1,000 detailed security controls.[3] Despite robust growth, the Japan ICT market faces structural challenges from an acute shortage of cloud and AI professionals, an expanding cyber-attack surface, and a widening digital trade deficit that highlights continued dependency on overseas platforms.
Key Report Takeaways
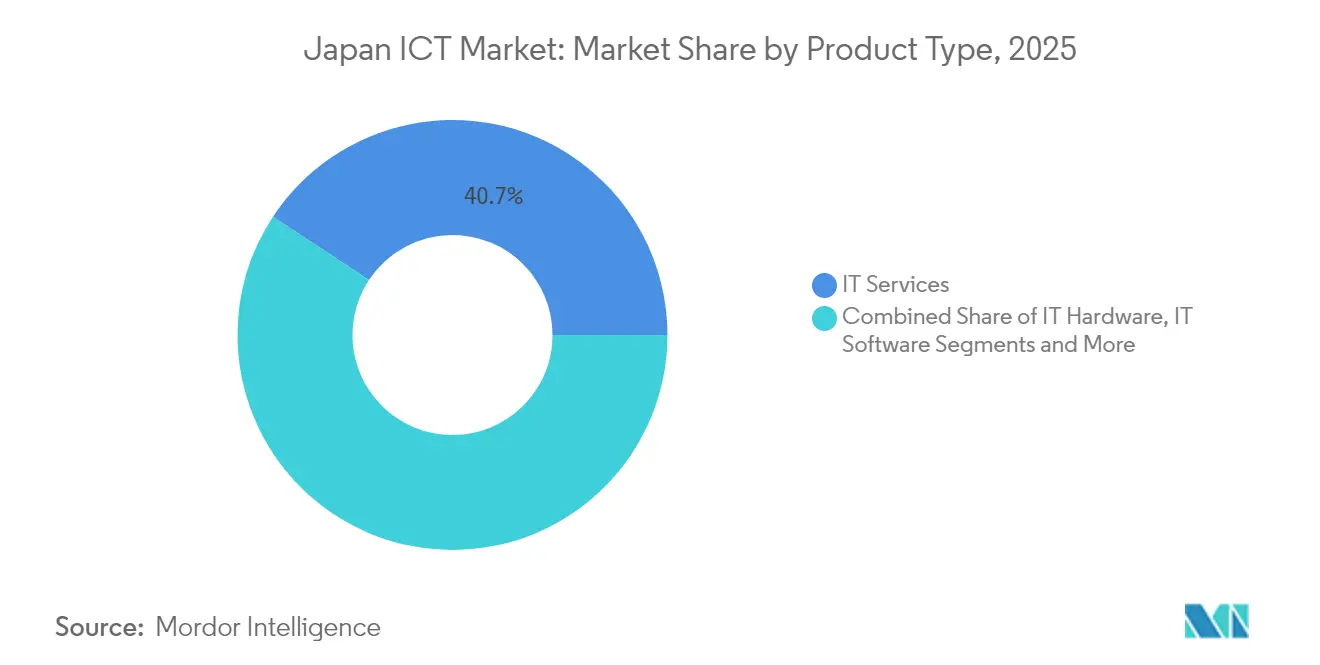
- By product type, IT Services captured 40.73% of Japan ICT market share in 2025, while Cloud Services is set to grow at a 7.78% CAGR through 2031.
- By enterprise size, large enterprises commanded 65.12% share of the Japan ICT market size in 2025; small and medium enterprises are advancing at a 7.51% CAGR through 2031.
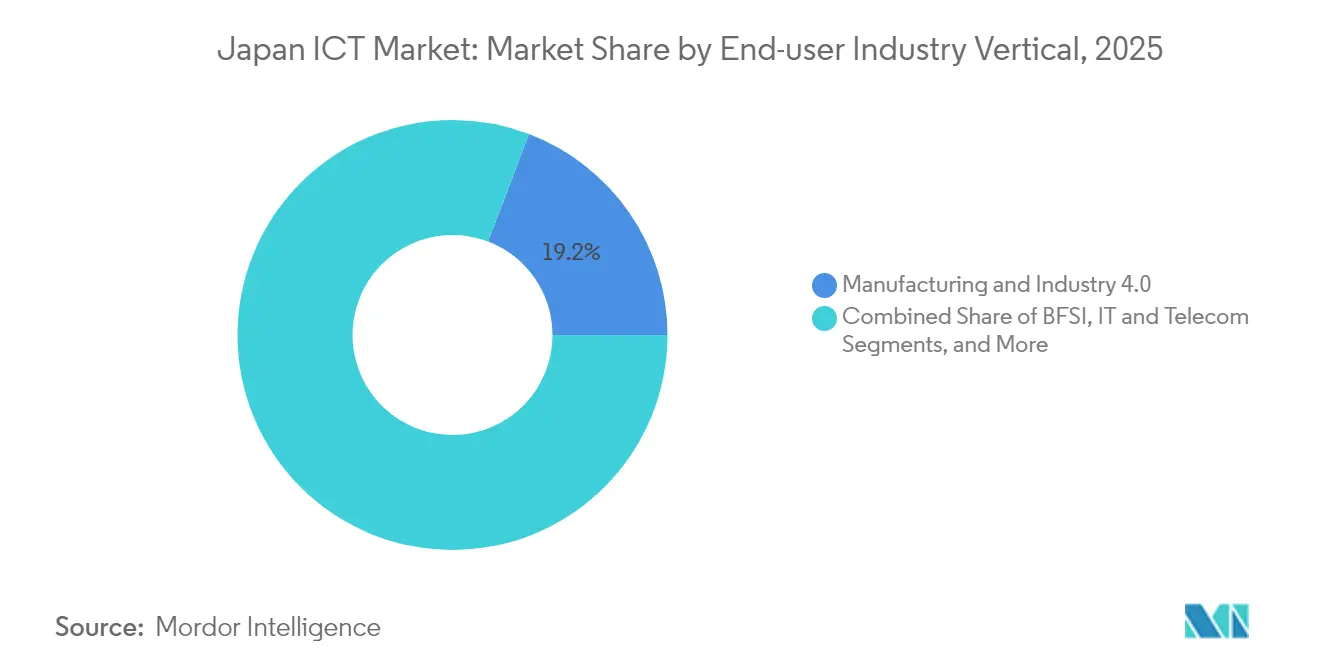
- By end-user vertical, manufacturing held 19.21% Japan ICT market share in 2025; healthcare and life sciences is forecast to grow at an 8.02% CAGR to 2031.
Note: Market size and forecast figures in this report are generated using Mordor Intelligence’s proprietary estimation framework, updated with the latest available data and insights as of 2026.
Market Trends and Insights
Drivers Impact Analysis of Japan ICT Market*
| Driver | (~) % Impact on CAGR Forecast | Geographic Relevance | Impact Timeline |
|---|---|---|---|
| Accelerating DX spending by large enterprises | +1.8% | Tokyo, Osaka, Nagoya metro areas | Medium term (2-4 years) |
| Hyperscaler CAPEX surge and local region build-outs | +1.5% | Kansai and Kyushu for new data-center clusters | Short term (≤ 2 years) |
| Government Cloud program boosting public-sector IT | +1.2% | Nationwide, central agencies and municipalities | Medium term (2-4 years) |
| AI-enabled SaaS adoption in underserved SMB segment | +0.9% | Urban centers with dense SME bases | Long term (≥ 4 years) |
| Semiconductor-equipment investments for AI infrastructure | +0.7% | Kumamoto, Hokkaido, broader APAC supply chain | Long term (≥ 4 years) |
| Workforce-automation demand amid aging demographics | +0.6% | Manufacturing regions and logistics corridors | Long term (≥ 4 years) |
| Source: Mordor Intelligence | |||
Accelerating DX Spending by Large Enterprises
Large corporations are raising IT budgets to mitigate the “2025 cliff,” with 78% of major firms planning to double spend by 2026 as legacy systems reach end-of-life. METI estimates that economic losses could reach JPY 12 trillion (USD 0.08 trillion) per year if modernization lags, prompting rapid uptake of mainframe-to-cloud migration services. Panasonic’s COBOL-to-Java conversion has already saved tens of billions of yen in operating costs, demonstrating tangible ROI. Financial institutions lead demand, representing a JPY 500 billion (USD 3.38 billion) opportunity for legacy system transformation. Systems integrators and cloud providers alike are bundling assessment, re-platforming, and managed services into multi-year contracts that lock in recurring revenue.
Hyperscaler CAPEX Surge and Local Region Build-Outs
Microsoft, AWS, and Google Cloud have collectively earmarked more than USD 18 billion for new Japanese regions through 2025, adding power-dense campuses in Osaka, Fukuoka, and Hokkaido. SoftBank’s 400 MW AI facility and KDDI’s NVIDIA-powered center at the former Sharp Sakai site exemplify Japan’s push for local, low-latency compute that can train trillion-parameter models. These investments stimulate domestic supply chains for power, cooling, network interconnects, and professional services. Land-constrained metros are seeing creative brownfield conversions of idle industrial sites into tier-IV data centers, increasing region diversity and energy-efficiency standards.
Government Cloud Program Boosting Public-Sector IT
Japan’s Digital Agency mandates cloud-first procurement and enforces ISMAP accreditation, now totaling 702 certified services. Certification aligns more than 1,000 controls with ISO 27001 and NIST 800-53, setting a high security baseline. Local cloud provider Sakura Internet secured inclusion alongside global players, underscoring policy intent to balance sovereignty and innovation. Municipal DXSaaS platforms standardize back-office functions such as tax processing and resident services, shortening project lead-times. Private companies mirror ISMAP controls to streamline sales into public agencies, effectively expanding the compliant addressable market.
AI-Enabled SaaS Adoption in Underserved SMB Segment
SMEs benefit from SaaS platforms that embed GPT-based assistants for quoting, help-desk, and inventory tasks. TIS demonstrated 30% faster quotation cycles at Kyoei Sangyo after deploying its Generative AI Platform, reducing reliance on domain experts. No-code tools like CELF allow line-of-business staff to automate workflows without professional developers, slashing deployment timelines. Subscription pricing mitigates capex constraints typical of SMEs. Fintech startups exploit this accessibility to comply with FSA reporting rules, illustrating spillover effects into regulated verticals. Over time, SME cloud adoption is expected to narrow the productivity gap with large enterprises.
Restraints Impact Analysis of Japan ICT Market*
| Restraint | (~) % Impact on CAGR Forecast | Geographic Relevance | Impact Timeline |
|---|---|---|---|
| Acute shortage of cloud/AI talent | -1.4% | Tokyo and Osaka tech corridors | Short term (≤ 2 years) |
| Intensifying cyber-attack surface and compliance costs | -0.8% | Nationwide, especially BFSI and critical infrastructure | Medium term (2-4 years) |
| Dependency on foreign software driving digital trade deficit | -0.6% | Nationwide, cross-industry | Medium term (2-4 years) |
| Legacy mainframe lock-in elevating modernization costs | -0.5% | Large enterprise hubs | Short term (≤ 2 years) |
| Source: Mordor Intelligence | |||
Acute Shortage of Cloud/AI Talent
Japan may face a 400,000-to-800,000 engineer deficit by 2030, inflating salaries 40-60% above traditional IT roles and delaying project timelines. Legacy mainframe specialists over age 50 are in unprecedented demand for COBOL remediation, commanding multiple offers. Government reskilling grants and simplified “Specified Skilled Worker” visas aim to broaden the labor pool but will have limited near-term effect. Enterprises are offshoring niche tasks, yet language and security concerns restrict strategic workloads. This scarcity raises total cost of ownership and forces prioritization of high-ROI projects, tempering the overall Japan ICT market growth momentum.
Intensifying Cyber-Attack Surface and Compliance Costs
METI plans a corporate cybersecurity rating system that forces firms to report maturity metrics publicly, adding layers to ISO 27001 and sectoral mandates. Proliferation of IoT devices, 5G MEC nodes, and multicloud footprints widens threat exposure. BFSI and energy utilities must pursue zero-trust architectures and 24 × 7 SOC coverage, heightening operational expenses. Insurance premiums for cyber risk rose 34% year-over-year in 2024, eroding profit margins. While vendors gain revenue from defense spending, end-user capital is diverted from innovation to compliance.
*Our forecasts treat driver/restraint impacts as directional, not additive. The impact forecasts reflect baseline growth, mix effects, and variable interactions.
Japan ICT Market Segment Analysis
By Product Type:
Services Maintain Scale While Cloud AcceleratesIT Services contributed 40.73% to Japan ICT market share in 2025, reflecting persistent reliance on systems integration and managed operations for mission-critical workloads. Cloud Services, powered by USD 17.9 billion hyperscaler CAPEX, is forecast to post an 7.78% CAGR, propelling the Japan ICT market size of this sub-segment from a 2025 base of USD 197.0 billion to USD 308.9 billion by 2031.
Systems integrators bundle application refactoring, data-center decommissioning, and ongoing governance, securing multi-year annuity revenue. Meanwhile, hardware demand clusters around AI-optimized GPUs and high-density rack power distribution. Domestic software publishers lag global peers, widening the digital trade deficit and reinforcing demand for SaaS imports. Communication Services leverage 5G Stand-Alone cores that enable network slicing, creating cross-sell opportunities for edge analytics. Cybersecurity vendors integrate zero-trust suites with observability platforms, delivering unified threat detection across hybrid estates.

By Enterprise Size:
SMEs Pace Growth as Large Firms Lead SpendLarge enterprises held 65.12% of Japan ICT market share in 2025 and continue to fund large-scale DX programs designed to modernize COBOL estates and deploy AI governance tools. In contrast, SMEs are projected to grow at a 7.51% CAGR, adding USD 34.7 billion incremental spend by 2031 and lifting their contribution to 38.12% of incremental Japan ICT market size expansion.
The SME surge is catalyzed by subscription-based SaaS, governmental digital subsidies, and marketplaces that simplify procurement. Vendor go-to-market strategies include channel-first bundles pairing connectivity with productivity suites. Large enterprises centralize vendor panels to compress pricing and enforce ESG criteria. Both cohorts converge on managed security services to mitigate skills gaps, yet delivery models differ: SMEs leverage multi-tenant SOCs, while large firms fund dedicated fusion centers and red-team exercises.
By End-User Industry Vertical:
Manufacturing Tops, Healthcare AcceleratesManufacturing held 19.21% of Japan ICT market share in 2025, underwritten by Industry 4.0 upgrades such as AI-guided quality inspection and digital twins on advanced MES platforms. Healthcare and life sciences will register the highest 8.02% CAGR, supported by telemedicine reimbursement reforms and AI-assisted diagnostics for an aging population that will top 30% of citizens over 65 by 2030.
Government agencies expand adoption of municipality standard systems and digital resident ID platforms. BFSI institutions channel budgets to core banking modernization and open-API compliance, creating demand for microservices architectures. Gaming and esports, a nascent but fast-growing vertical, leverages edge compute and CDN optimization to deliver sub-50 ms latency for competitive play. Retail and logistics rely on AI-driven demand forecasting and autonomous last-mile delivery pilots, signalling multi-industry breadth of digitalization momentum.
Geography Analysis
Japan ICT market demand clusters in Tokyo’s Chiyoda, Minato, and Shibuya wards as well as Osaka’s Umeda district, where enterprise headquarters and carrier-neutral interconnect facilities concentrate network traffic. Regional governments aggressively court data-center investors with tax incentives, resulting in new campuses in Fukui, Mie, and Ibaraki Prefectures that diversify geographic risk and exploit renewable energy sources.
Rural revitalization programs harness 5G and satellite broadband to connect remote communities, allowing SMEs in Hokkaido dairy and Kyushu tourism to deploy cloud POS and AI chatbots. Hyperscaler edge zones in Sapporo, Hiroshima, and Sendai reduce round-trip latency for AI inference workloads to less than 20 ms, stimulating adoption of computer-vision-based smart-factory solutions.
National semiconductor hubs in Kumamoto and Hokkaido will attract ancillary ICT services from EDA software to clean-room automation. These technopoles create demand for high-performance computing clusters and secure OT-IT convergence solutions. Collectively, the geographic expansion ensures that the Japan ICT market continues to grow beyond the traditional Kanto–Kansai corridor, reinforcing nationwide digital resilience.
Regulatory Landscape
Japan ICT regulation is shaped by telecommunications and media oversight under the Ministry of Internal Affairs and Communications (MIC), alongside cross-government digital procurement and cybersecurity frameworks. The Digital Agency enforces a cloud-first stance for public-sector procurement through ISMAP, a security assessment scheme aligned to more than 1,000 controls mapped to standards such as ISO 27001 and NIST 800-53, which has become a practical gating requirement for cloud and managed-service vendors selling into ministries and municipalities.
Cyber and AI governance continue to tighten through 2025-2026 policy steps. The Act on the Promotion of Research, Development, and Utilization of Artificial Intelligence Technologies (AI Act) entered into force on 1 September 2025, and the Cyber Security Capability Enhancement Act (and its supplementary act) was promulgated on 23 May 2025, with entry into force scheduled around autumn 2026. Institutional enforcement also changed with the establishment of the National Cybersecurity Office (successor to NISC) on 1 July 2025 as a central cybersecurity authority, and essential infrastructure operators face additional obligations under the 2022 Economic Security Act, including submissions related to critical facility changes.
Value Chain Analysis
Japan ICT delivery is typically structured as a multi-tier systems-integration pyramid, where enterprise and government buyers contract a prime contractor (Motoke) for requirements definition, governance, and overall delivery, while execution is distributed across first-tier and lower-tier subcontractors. Major prime contractors include NTT DATA, Fujitsu, NEC, Hitachi, and Nomura Research Institute, which coordinate large modernization, cloud migration, and security programs, then allocate application development, testing, operations, and field work to partner ecosystems.
Platform and infrastructure supply is anchored by global cloud and software vendors and domestic telecom operators, with implementation, managed operations, and compliance work handled by SIers and MSPs that maintain long-term run operations. Consolidation and reorganization among SIers continue to reshape delivery capability and bargaining power across the chain, including TIS Inc. progressing a consolidation with Intec to form a new entity (TISI) as of July 2026. Vendor-neutral SIers (for example, TIS and Otsuka Corporation) generally have more flexibility to assemble multi-vendor stacks, while maker-affiliated groups (such as Fujitsu- or NEC-aligned ecosystems) rely on proprietary platforms and long-standing accounts to secure large, multi-year engagements.
Competitive Landscape
Domestic systems integrators Fujitsu, NEC, and Hitachi command long-standing relationships with ministries and megabanks, yet face margin pressure as clients demand outcome-based pricing tied to KPI delivery. These incumbents forge alliances with AWS, Microsoft Azure, and Google Cloud to co-deliver hybrid solutions that protect legacy investments while offering cloud-native scalability. IBM Japan pivots to partner-centric sales, winning Oracle Cloud Applications Partner of the Year in 2024 and collaborating with SCSK to launch MF+ Hosting on IBM z16 mainframes.
Telecom operators NTT DATA, KDDI, and SoftBank leverage network footprints to bundle connectivity and edge services, vying for smart-factory and MEC contracts. SoftBank’s 750,000 m² Sakai AI data-center campus positions the firm as a domestic GPU cloud pioneer. Start-ups like FPT Smart Cloud Japan compete in niche GPU leasing, supported by SBI Holdings’ planned 35% stake that injects capital and enterprise channels.
Certification race under ISMAP governs public-sector eligibility; AvePoint, Google Cloud, and SAP achieved or renewed compliance in 2025. Vendors lacking accreditation face procurement barriers, intensifying rivalry to secure audits. The competitive arena values local data-sovereignty assurances, Japanese-language AI models, and long-term commitment to relationship management over pure pricing tactics.
Japan ICT Industry Leaders
-
Fujitsu Limited
-
Hitachi Ltd
-
IBM Japan Ltd
-
NEC Corporation
-
TIS Inc.
- *Disclaimer: Major Players sorted in no particular order
Japan ICT Market Companies Covered in this Report
- Fujitsu Limited
- NEC Corporation
- Hitachi, Ltd.
- TIS Inc.
- IBM Japan, Ltd.
- ITOCHU Techno-Solutions Corporation
- Panasonic Holdings Corporation
- Sony Group Corporation
- Salesforce Japan Co., Ltd.
- SCSK Corporation
- NTT DATA Corporation
- KDDI Corporation
- SoftBank Corp.
- Internet Initiative Japan Inc.
- Rakuten Group, Inc.
- Nomura Research Institute, Ltd.
- Oracle Corporation Japan
- Microsoft Japan Co., Ltd.
- Google Cloud Japan G.K.
- Amazon Web Services Japan G.K.
Market Opportunities and Future Outlook
Public-sector cloud and security compliance remains a clear whitespace for vendors that can operationalize government procurement requirements, particularly under the Digital Agency cloud-first approach and ISMAP accreditation. In the current report context, ISMAP has scaled to 702 certified services, and the control set (1,000+ requirements) creates recurring demand for security engineering, continuous monitoring, documentation, and audit support across cloud, SaaS, and managed security services, not only for central agencies but also for municipalities adopting standardized digital service platforms.
Enterprise modernization and SME digitalization continue to expand addressable work across migration, application refactoring, and productivity automation. METI has warned that economic losses could reach JPY 12 trillion per year if legacy modernization lags, and the government is also backing regional and SME digitization through programs such as the Vision for a Digital Garden City Nation (supported by JPY 100 billion in grants) and business restructuring/IT introduction subsidies referenced in official investment and digital policy materials. On the supply side, acute talent scarcity (a 400,000 to 800,000 engineer deficit cited in the report context) creates room for managed services, standardized modernization toolchains, and AI-assisted development that compresses delivery effort. At the same time, hyperscaler region build-outs and domestic data-center campus projects keep pulling demand for network interconnect, observability, and hybrid operations capabilities across Tokyo, Kansai, and emerging regional clusters.
Recent Industry Developments in Japan ICT Market
- July 2026: Fujitsu Limited - Launched the Japan-specific Fujitsu AI-driven Modernization Service, combining internal generative AI capabilities with third-party models to shorten migration periods by approximately 40%. The launch expands Fujitsu's AI enabled modernization offerings for enterprise IT and accelerates migration timelines in the Japanese market. The move strengthens Fujitsu's competitive position in hybrid cloud and AI assisted services across the sector.
- July 2026: IBM Japan Ltd. - Partnered with Mitsubishi UFJ Bank, Mitsubishi UFJ Information Technology, and Red Hat to implement AI-driven development for financial systems. The collaboration broadens IBM's footprint in banking AI development and strengthens co-delivery of hybrid cloud solutions for financial institutions. The partnership enhances domestic capabilities for rapid, secure modernization of core banking platforms.
- July 2026: IBM Japan Ltd. - Supplied IBM Instana Observability software to Hitachi Ltd. for integration into the JP1 IT operations platform, effective July 31, 2026. The deployment adds advanced observability to Hitachi's JP1 operations, improving fault detection and performance insights across JP1 deployments. The initiative reinforces IBM Japan's role in adding operational intelligence to Japan's enterprise IT landscape.
Japan ICT Market Report Scope and Research Methodology
Market Definition and Coverage
For this methodology, the Japan ICT market is counted as spending and revenue linked to ICT hardware, software, and services that enable computing, connectivity, and digital operations across Japan.
Scope exclusions: We exclude consumer-only digital content spend and purely non-ICT business services that do not directly deliver an ICT product or ICT service.
Segments Covered in This Report
- By Product Type
- IT Hardware
- Computer Hardware
- Networking Equipment
- Peripherals
- IT Software
- IT Services
- IT Consulting and Implementation
- IT Outsourcing (ITO)
- Business Process Outsourcing (BPO)
- Managed Security Services
- Cloud and Platform Services
- IT Infrastructure
- IT Security/Cybersecurity
- Communication Services
- IT Hardware
- By Enterprise Size
- Small and Medium-sized Enterprises
- Large Enterprises
- By End-user Industry Vertical
- Government and Public Administration
- BFSI
- IT and Telecom
- Energy and Utilities
- Retail, E-commerce, and Logistics
- Manufacturing and Industry 4.0
- Healthcare and Life Sciences
- Oil and Gas
- Other Verticals
Data Sources, Market Sizing, and Validation
Desk Research
Desk research starts with measurable public time series that show how ICT spend behaves in Japan, and it is then used to set realistic guardrails for our model. We referred to sources such as Japan's Ministry of Internal Affairs and Communications ICT White Paper and related ICT market research outputs, Statistics Bureau Japan data for macro indicators, OECD digital economy and ICT indicators, and the ITU for telecom and broadband baselines.
To make the model usable for sizing, we also reviewed company filings and investor decks for Japan-focused ICT revenue splits, product category mix, and demand commentary by end users. For price and shipment context, we used customs and trade statistics where relevant, and we also used paid subscriptions for company financials and intelligence, news and financials, patent databases, and an import-export shipment-level database to cross-check market direction and major inflection points. The desk sources mentioned here are illustrative only, and many other public documents and datasets were used for validation and clarification during the work.
Primary Interviews and Surveys
Primary work is used to confirm what part of ICT spend is truly addressable in Japan and how it is changing by category, buyer type, and budget cycle. We spoke with a mix of ICT suppliers, channel and integration partners, enterprise and public-sector buyers, and industry experts across major Japan demand centers, which then helped us sanity check adoption assumptions and pricing movement.
Distribution of primary research fieldwork respondents
| Company type | Respondent position |
|---|---|
| Top tier: 27% | CXOs: 13% |
| Mid tier: 57% | Functional/Unit leaders: 33% |
| Smaller Players: 16% | Managers: 54% |
Market-Sizing & Forecasting
The sizing model begins with a top-down spend reconstruction for Japan, where published ICT expenditure series and macro drivers are translated into an addressable pool and then distributed across core ICT categories. Once the high-level totals are formed, we corroborate them using selective bottom-up checks such as sampled average selling price times volume for devices, supplier revenue splits for Japan, and channel checks for major service lines, and totals are adjusted only when multiple checks point in the same direction.
Inputs that are tracked in the model include enterprise IT budget momentum, cloud migration and data center build activity, telecom service revenue direction, device replacement cycles, and the pace of cybersecurity and modernization programs in regulated industries. When a variable has weak direct data, we use a proxy that can be defended on a call, such as using public capex and IT investment indicators to guide services intensity.
Forecasting is built using scenario analysis tied to these drivers, which is then reviewed against what interviewees expect for budget approvals, staffing, and contract renewal timing. Where category-level gaps appear, the missing portion is filled using conservative ranges from primary inputs and then rebalanced so the final market total stays consistent with the top-down spend logic.
Data Validation & Update Cycle
Validation is done through multiple passes, starting with simple range checks on category shares and year-over-year movement, followed by cross-checks against independent signals such as telecom revenue series, IT investment indicators, and public ICT spend benchmarks. Any unusual spikes are reviewed again, and if the reason cannot be defended with evidence, the assumption is revised and re-tested.
Before sign-off, the model and key assumptions go through analyst-to-analyst review, and interview follow-ups are triggered when a major category or growth driver shows inconsistent feedback. Reports are refreshed annually, with interim updates when material policy changes, large demand shocks, or major price swings occur, and a final pre-delivery pass is completed so clients receive the latest updated view.
Mordor Intelligence's Japan Ict Market Size Measured Against Other Published Estimates
Different publishers often end up with different Japan ICT market sizes because they treat ICT as either a broad expenditure bucket or a tighter addressable revenue market, and they also vary on how they handle telecom services, devices, and currency timing. The result is that two numbers can look far apart even when each is internally reasonable.
The main gap comes from whether telecom service revenue and device spending are counted as full ICT market value or only as categories that are filtered to addressable business demand, and that is why Mordor Intelligence keeps the total tied to a defined Japan ICT scope and refreshes category mixes using buyer-side validation before finalizing the yearly value.
Benchmark comparison
| Source | Market Size | Gaps in Research Methodology |
|---|---|---|
| Mordor Intelligence | USD 404.37 B (2025) | |
| Government ICT Outlook A | USD 206.00 B (2024) | This figure is published in JPY as ICT market expenditure and then converted to USD, which can swing with FX timing, and it can also treat some categories as spend pools rather than revenue captured by ICT suppliers. |
| Trade Body Digest B | USD 360.00 B (2026) | This estimate appears to emphasize business IT and services intensity, which can undercount consumer device cycles and parts of communications services, and it typically relies on fewer cross-checks on category mix shifts year to year. |
The table shows that the widest spread is explained by scope and conversion choices, not just growth assumptions. By keeping category inclusions explicit, checking totals against independent ICT signals, and re-testing share shifts with interviews, the final size stays traceable to inputs that can be repeated and reviewed.
Key Questions Answered in the Report
How large is the Japan ICT market in 2026?
It is valued at USD 433.12 billion in 2026 and is projected to grow at a 7.11% CAGR to USD 610.61 billion by 2031.
Which segment grows fastest inside Japan’s ICT sector?
Cloud Services shows the highest momentum, expanding at an 7.78% CAGR through 2031, propelled by hyperscaler investments and government cloud mandates.
What is driving SME technology adoption in Japan?
Affordable AI-enabled SaaS and no-code tools reduce entry barriers, allowing SMEs to automate processes and close productivity gaps.
What is ISMAP and why does it matter?
ISMAP is a government security certification that evaluates more than 1,000 controls; only certified cloud services can be procured by public agencies, influencing vendor selection across sectors.
How are talent shortages affecting ICT projects?
Limited availability of cloud and AI engineers inflates labor costs by up to 60% and forces companies to prioritize high-ROI initiatives or rely on managed services and offshore support.
Which region attracts the most data-center investments?
The Kansai region, particularly Osaka’s Sakai district, is emerging as a hotspot due to large brownfield sites, robust power infrastructure, and proximity to enterprise demand centers.