Market Overview
| Study Period | 2020 - 2031 |
|---|---|
| Forecast Data Period | 2026 - 2031 |
| Historical Data Period | 2020 - 2024 |
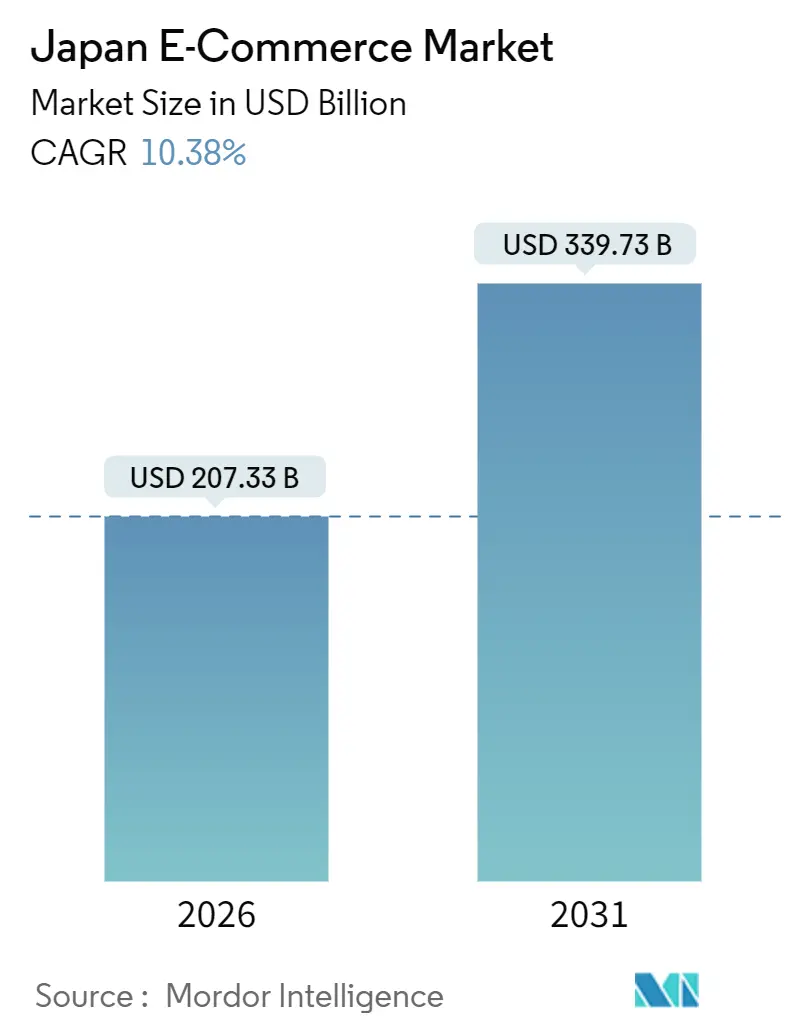
| Market Size (2026) | USD 207.33 Billion |
| Market Size (2031) | USD 339.73 Billion |
| Growth Rate (2026 - 2031) | 10.38% CAGR |
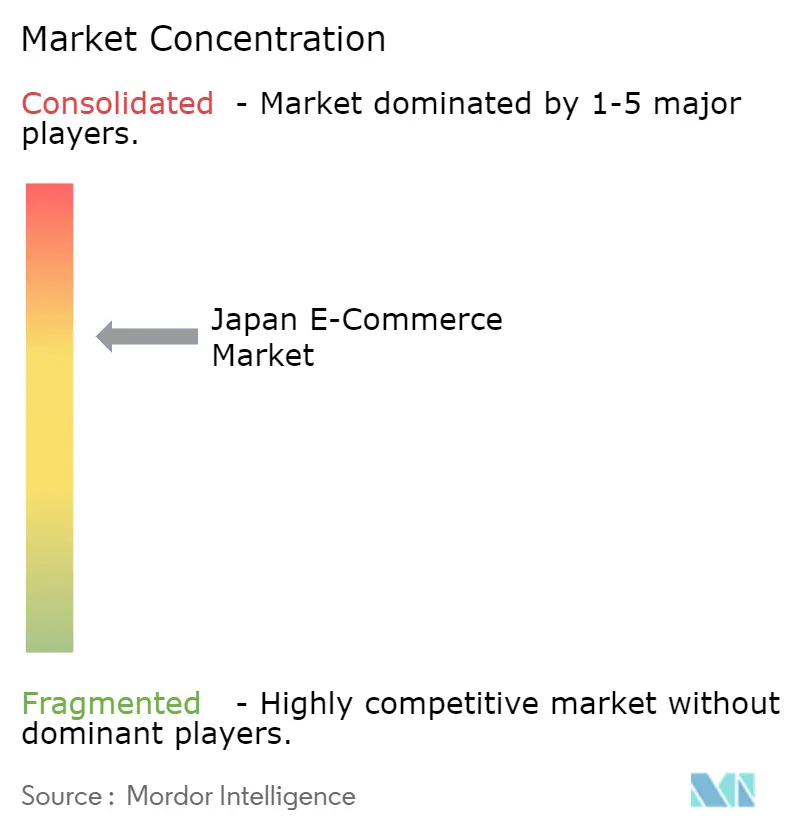
| Market Concentration | Medium |
Major Players *Disclaimer: Major Players sorted in no particular order Image © Mordor Intelligence. Reuse requires attribution under CC BY 4.0. | |
Japan E-commerce Market Analysis by Mordor Intelligence
The Japan E-commerce Market size stands at USD 207.33 billion in 2026 and is projected to reach USD 339.73 billion by 2031, reflecting a robust 10.38% CAGR. Consumer migration from cash to digital payments, government incentives that extend cashless subsidies to 2027, and logistics networks capable of sub-one-hour fulfillment in major cities are amplifying the addressable base. Structural tailwinds include rising smartphone penetration among seniors, accelerated adoption of buy-now-pay-later (BNPL) by Gen-Z females, and platform investments in generative-AI merchandising that compress browsing and checkout into a single mobile session. Enterprise digitization lags the retail curve, yet tax incentives for electronic invoicing and procurement card programs signal a sizable future inflection. Competitive behavior continues to revolve around ecosystem lock-in: Rakuten pairs loyalty points with financial services, Amazon Japan uses Prime to secure repeat orders, and Yahoo Japan leverages the PayPay super-app to widen daily engagement.
Key Report Takeaways
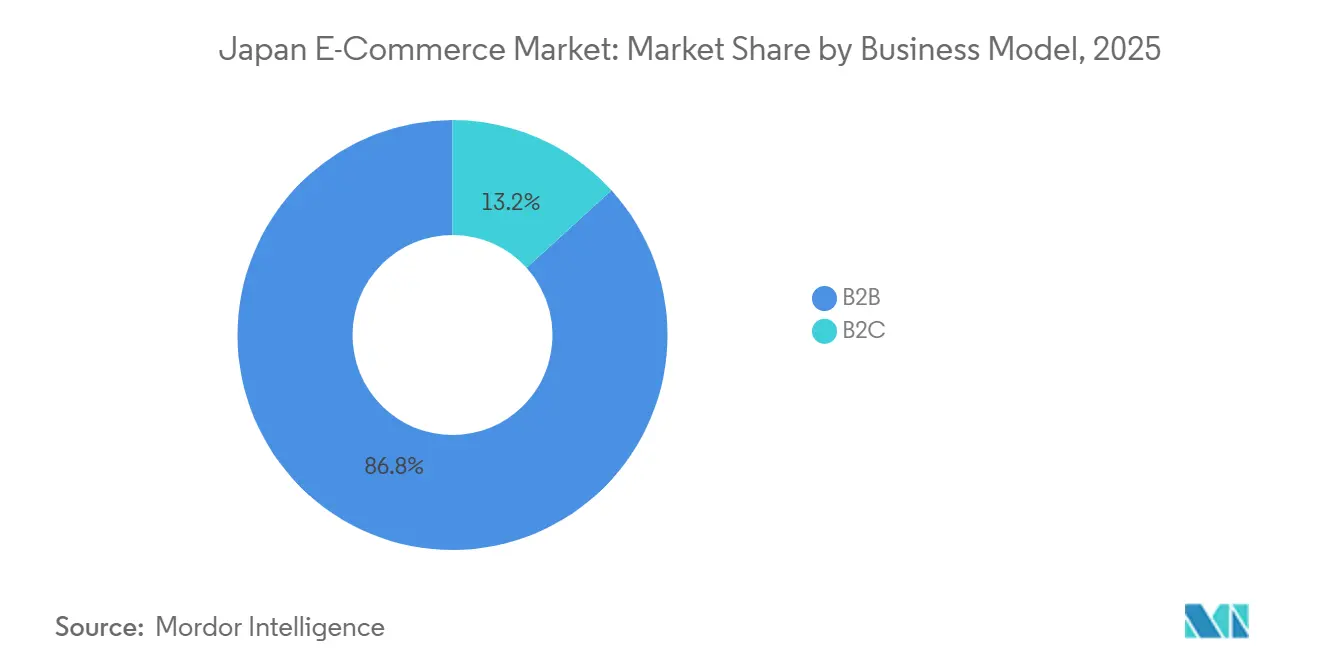
- By business model, business-to-consumer transactions captured 86.76% of the Japan E-commerce Market share in 2025, while business-to-business procurement is projected to scale at a 12.03% CAGR up to 2031.
- By device type, smartphones generated 64.76% of transaction value in 2025 and are forecast to advance at an 11.48% CAGR through 2031, outpacing desktops and laptops.
- By payment method, credit and debit cards retained 66.87% share of spend in 2025 even as digital wallets expand at a 13.53% CAGR through 2031, buoyed by PayPay’s October 2025 link with Google Wallet.
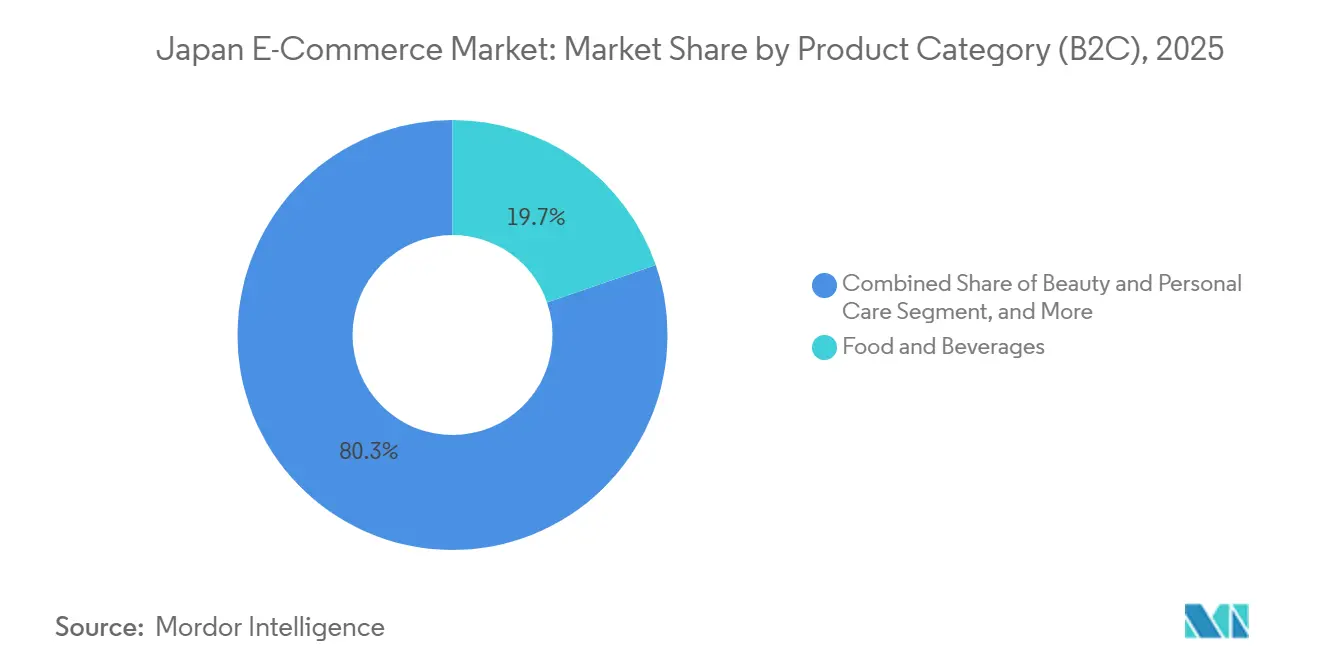
- By product category, food and beverages led with 19.7% of the Japan E-commerce Market size in 2025, while beauty and personal care is growing fastest at a 10.76% CAGR through 2031.
Note: Market size and forecast figures in this report are generated using Mordor Intelligence’s proprietary estimation framework, updated with the latest available data and insights as of January 2026.
Japan E-commerce Market Trends and Insights
Drivers Impact Analysis*
| Driver | (~) % Impact on CAGR Forecast | Geographic Relevance | Impact Timeline |
|---|---|---|---|
| Rising Silver-Economy Digital Spend in Urban Prefectures | +2.1% | Tokyo, Osaka, Nagoya | Medium term (2-4 years) |
| Consolidation of 1-Hour Hyper-Local Delivery Networks in Tokyo and Osaka | +1.8% | Tokyo and Osaka, spillover to Fukuoka | Short term (≤ 2 years) |
| Government Cashless-Subsidy Extension to 2027 | +1.5% | Nationwide, higher in urban areas | Short term (≤ 2 years) |
| Surge in In-game and Livestream-Commerce Monetization | +1.3% | Nationwide, mobile-first cohorts | Medium term (2-4 years) |
| Rapid Uptake of BNPL among Gen-Z Females | +1.2% | Urban youth clusters | Short term (≤ 2 years) |
| Corporate Tax Incentives for B2B E-procurement Platforms | +0.9% | Enterprise-dense prefectures | Long term (≥ 4 years) |
| Source: Mordor Intelligence | |||
Rising Silver-Economy Digital Spend in Urban Prefectures
Japan’s over-65 demographic reached 29.3% of the population in 2024, yet internet usage among seniors climbed into the mid-80% range in Tokyo, Osaka, and Nagoya. Voice-assisted navigation, family-linked accounts, and same-day delivery windows designed around retiree schedules have removed usability friction. Household savings averaging JPY 24.3 million (USD 162,000) combined with lower price sensitivity mean each new senior adopter delivers higher lifetime value than younger cohorts. Retailers are re-architecting mobile checkout to a three-tap flow and layering prescription-management modules for health supplements, thereby widening the Japan E-commerce Market beyond traditional tech-savvy users. Platform loyalty schemes that allow family members to pool points further stimulate discretionary spend. The result is incremental volume rather than channel substitution, raising revenue density in metropolitan prefectures and improving logistical route economics.
Consolidation of 1-Hour Hyper-Local Delivery Networks in Tokyo and Osaka
Micro-fulfillment centers within 3 km of dense residential clusters now underpin one-hour grocery and convenience deliveries. Same-day or next-day preferences for online grocery in Tokyo rose to 62% in 2025, a 14-point gain over three years.[1]Bank of Japan, “Payment Trends Report 2025,” boj.or.jp Uber Eats, Wolt, and DoorDash lock in customers by bundling dark-store exclusives, while Rakuten Seiyu Netsuper defends share with automated picking lines inside legacy supermarket backrooms. Yamato Transport’s 2025 introduction of cargo flights between Haneda and regional hubs was a direct hedge against driver shortages yet simultaneously enabled faster restocks for these urban nodes. As localized density grows, service-level differentiation eclipses price competition, raising barriers to entry and lengthening the customer-lifetime window for established players.
Government Cashless-Subsidy Extension to 2027
The Ministry of Economy, Trade and Industry kept point-back rebates of 5-30% in force through 2027, maintaining a fiscal tailwind for QR-wallet uptake. Cashless ratios remain below the 80% target, yet subsidy continuity reassures platforms that acquisition spending will translate into durable retention rather than incentive-driven churn. Lower interchange fees for small merchants shorten payback periods on contactless terminals, accelerating long-tail acceptance that feeds the Japan E-commerce Market flywheel. The policy also prompts wallet providers to deepen loyalty integration, fueling repeat transactions that raise average revenue per user. In aggregate, the subsidy extension converts latent willingness into actual digital spend, nudging both consumers and micro-merchants past the hesitation threshold.
Surge in In-game and Livestream-Commerce Monetization
Mobile-gaming in-app purchases totaled USD 11 billion in 2025, equating to USD 807 per paying player, five times the Asia-Pacific average.[2]Sensor Tower, “Japan Mobile Gaming Market Report 2024,” sensortower.com The 2024 Smartphone Software Competition Promotion Act cut platform commissions, letting publishers embed proprietary stores. Game studios now sell exclusive skins bundled with physical merchandise, collapsing fandom and retail into a single micro-ecosystem. Parallel growth in livestream commerce via 17Live and Mercari Shops captures consumers who treat entertainment as discovery. Because these channels sit upstream of standard search-based journeys, they expand gross merchandise value without cannibalizing existing categories. The net effect adds younger, entertainment-led cohorts to the Japan E-commerce Market, diversifying revenue streams and diluting reliance on traditional banner advertising.
Restraints Impact Analysis*
| Restraint | (~) % Impact on CAGR Forecast | Geographic Relevance | Impact Timeline |
|---|---|---|---|
| Logistics Labour Shortage Beyond 2026 (Yamato “2024 Problem”) | -1.4% | Nationwide, acute in rural corridors | Medium term (2-4 years) |
| Digital-Platform Fair-Trading Act Compliance Costs | -0.8% | Nationwide, incumbent platforms | Short term (≤ 2 years) |
| Persistent Preference for Cash-on-Delivery in Rural Shoppers | -0.6% | Rural prefectures | Long term (≥ 4 years) |
| Ageing IT Infrastructure of SME Sellers | -0.5% | Nationwide SME clusters | Long term (≥ 4 years) |
| Source: Mordor Intelligence | |||
Logistics Labour Shortage Beyond 2026 (Yamato “2024 Problem”)
Annual driver overtime caps set at 960 hours from April 2024 have tightened parcel-handling capacity, forcing Yamato to refuse peak-season loads and lift commercial rates by double digits. Forty percent of drivers are already over 50, while recruitment classes shrink year on year, creating a structural deficit that ripples through fulfillment costs. Parcel carriers prioritize high-density urban routes, leaving rural prefectures exposed to longer lead times that chill order volumes. Platforms experimenting with cargo flights and autonomous delivery corridors may blunt the worst impacts, but labor scarcity remains a medium-term drag on service levels and margins inside the Japan E-commerce Market.
Digital-Platform Fair-Trading Act Compliance Costs
Amazon Japan, Rakuten, and Yahoo Japan were designated as large-scale platforms in May 2024, triggering mandatory disclosures of search-ranking logic, dispute mechanisms, and seller metrics. Rakuten’s fiscal-year filing shows JPY 2.8 billion (USD 18.7 million) in incremental compliance outlays. Smaller rivals lack such budgets, yet they too must meet transparency requirements once they cross transaction thresholds, effectively hardening entry barriers. The regulation diverts engineering resources from feature innovation toward audit documentation, muting experimentation and elongating product cycles. Over the short term, these costs erode margin expansion that would otherwise flow from scale efficiencies within the Japan E-commerce Market.
*Our forecasts treat driver/restraint impacts as directional, not additive. The impact forecasts reflect baseline growth, mix effects, and variable interactions.
Segment Analysis
By Business Model: Enterprise Procurement Lags Consumer Maturity
Business-to-consumer activity represented 86.76% of transaction value in 2025, cementing its lead after decades of platform investment. Despite this dominance, business-to-business flows are forecast to rise at a 12.03% CAGR through 2031, the highest of any model inside the Japan E-commerce Market. MonotaRO booked JPY 288.1 billion (USD 1.92 billion) in 2024 sales, yet still captured under 3% of the wider maintenance-repair-operations universe, revealing massive offline whitespace.[3]MonotaRO Co., “FY2024 Securities Report,” monotaro.com Procurement-system integrations jumped 27.9%, signaling that mid-sized manufacturers now plug e-catalogs directly into ERP workflows, thereby slashing manual data entry. Rakuten Card’s March 2025 initiative to chase JPY 1,100 trillion (USD 7.33 trillion) in corporate spend underscores the strategic pivot toward enterprise payments. As tax incentives for electronic invoicing kick in, digitized procurement is set to tilt the revenue mix, expanding the Japan E-commerce Market size while compressing processing errors.
The upside is tempered by cultural inertia in indirect spend, where fax orders persist. Yet macro forces, corporate decarbonization reporting and supply-chain traceability mandates, necessitate digital audit trails, indirectly nudging firms onto e-procurement rails. Service providers now bundle spend analytics with compliance dashboards, making platform adoption a governance hedge. Combined with looming succession issues at small manufacturers, where digital fluency is a hiring criterion, enterprise e-commerce has moved from optional to inevitable. Consequently, capital allocation within leading platforms now balances consumer retention with aggressive moves into industrial categories, reshaping competitive priorities across the Japan E-commerce Market.


By Device Type (B2C): Mobile-First Design Unlocks Incremental Users
Smartphones accounted for 64.76% of 2025 transaction value and are projected to grow at 11.48% annually, expanding both share and total spend. Seniors adopting voice-assisted search and Gen-Z treating phones as a primary computer underpin this surge. Desktop’s role is narrowing to high-consideration purchases such as premium electronics where screen real estate aids feature comparison. Voice-enabled devices and wearables begin to register meaningful volume, aided by natural-language payment authentication. Generative-AI try-on tools accelerate mobile conversion by collapsing discovery and purchase steps into a single interaction. Perfect Corp.’s May 2025 launch cut fashion return rates by 18% among early adopters.[4]Perfect Corp., “GenAI Clothes Try-On Launch,” perfectcorp.com These gains feed directly into gross merchandise value, lifting the Japan E-commerce Market size for mobile-originated sales.
Investment priorities now emphasize thumb-optimized UX, biometric login, and latency reduction to beat the five-second abandonment threshold. Parallel upgrades to desktop sites focus on AR overlays for large-ticket items, preserving relevance where visual fidelity matters. The strategic payoff is a wider funnel: previously offline seniors join via simplified mobile interfaces, while younger users deepen engagement through social-media–linked storefronts. This two-pronged expansion reinforces the primacy of mobile without amputating desktop revenue streams inside the Japan E-commerce Market.
By Payment Method (B2C): Digital Wallets Gain Share Through Super-App Integration
Cards retained a 66.87% payment share in 2025, yet digital wallets grow 13.53% a year, fueled by PayPay’s integration into Google Wallet in October 2025. PayPay processed 7.46 billion transactions in 2024 and boasts over 60 million users, turning transaction frequency rather than user acquisition into the core battleground.[5]PayPay Corp., “Corporate Press Release,” about.paypay.ne.jp Wallet providers gamify everyday spend via instant rebates and point lotteries, solidifying habit loops. BNPL, while smaller, outpaces all other methods among Gen-Z females, dovetailing with fashion and beauty categories where average order values breach monthly discretionary budgets. The Financial Services Agency’s 2025 guidance mandates income checks only above JPY 50,000 (USD 333), preserving onboarding ease. Declines in cash-on-delivery are slow but observable, constrained primarily to rural prefectures where point-of-sale acceptance remains thin.
Platform economics pivot on interchange reduction: QR-wallets cost merchants less than card rails, encouraging small retailers to promote wallet usage. Loyalty ecosystems further tip the scales, with points earned on wallet spend redeemable inside broader lifestyle loops, reinforcing stickiness. As merchant and consumer adoption converge, digital wallets will accelerate turnover and compress settlement cycles, broadening the Japan E-commerce Market share for non-card payments.
By Product Category (B2C): Beauty Outpaces Food on AR Innovation
Food and beverages retained the largest slice of consumer spend in 2025 owing to high purchase frequency and the rise of one-hour grocery delivery. Oisix ra daichi alone posted JPY 256.01 billion (USD 1.71 billion) in trailing-twelve-month revenue, strengthened by subscription meal kits. Rakuten Seiyu Netsuper, integrated into Rakuten’s points ecosystem, reports customer acquisition costs under standalone peers, validating omnichannel synergy. Despite leadership, online grocery still represents under 5% of total grocery outlay, implying vast headroom that will fortify the food segment’s contribution to the Japan E-commerce Market size through 2031.
Beauty and personal care advances at a 10.76% CAGR, the fastest of all product groups. Shiseido’s Mirai Shift NIPPON 2025 aims for a 30% digital ratio, leveraging virtual skin-analysis tools. istyle’s @cosme platform counts 16.6 million monthly active users, providing social proof that amplifies small-brand visibility. Augmented-reality try-ons and AI shade-matching curb return rates, elevating basket sizes and reinforcing category appeal among Gen-Z BNPL users. Electronics, fashion, and furniture show mixed trajectories: electronics lift on launch cycles, fashion rides social-commerce momentum, while furniture’s growth is capped by heavy-goods logistics. Nonetheless, AR configuration tools in furniture hint at future upside once return-policy friction is solved, setting the stage for diversified category growth within the Japan E-commerce Market.

Geography Analysis
Tokyo, Osaka, and Nagoya generated roughly 68% of transaction value in 2025 despite accounting for 52% of the population. Superior infrastructure, one-hour delivery zones, dense payment acceptance, and 5G coverage compress shopper friction. Household internet penetration in Tokyo reached 91.4% in 2024 versus 78.6% in rural areas.[6]Ministry of Internal Affairs and Communications, “White Paper on Information and Communications 2024,” soumu.go.jp Rural shoppers cling to cash-on-delivery, raising working-capital strain and complicating reverse logistics. Carriers grappling with driver scarcity already sidestep low-density routes, widening the urban-rural digital divide inside the Japan E-commerce Market.
Hyper-local delivery density in Tokyo and Osaka rests on micro-fulfillment assets and carrier networks that promise sub-hour windows. The Bank of Japan recorded a 62% preference for same-day grocery delivery in Tokyo in 2025, up from 48% three years earlier. Fukuoka emerges as a proving ground for automated dark stores, signaling diffusion beyond the largest metros. Urban markets thus shift from user-acquisition growth to order-frequency expansion, whereas rural markets remain volume-constrained by logistics economics.
Cross-border flows add a further geographic layer. Rakuten Ichiba opened to Singapore sellers in July 2025, enriching product diversity and importing Southeast Asian demand patterns. Mercari’s global app unlocks overseas appetite for Japanese vintage items, turning rural households into exporters. Shein’s aggressive entry spurred debate over import taxes on low-value parcels. TikTok’s April 2025 e-commerce pilot further internationalizes shopper exposure, blending social content with transactional hardware. Geography therefore shapes competitive levers, with urban density favoring service differentiation and cross-border channels introducing new assortment dynamics across the Japan E-commerce Market.
Competitive Landscape
Rakuten Group, Amazon Japan, and Yahoo Japan together controlled an estimated 55-60% of consumer gross merchandise value in 2025, giving the Japan E-commerce Market a moderate concentration profile. Rakuten’s ecosystem spans e-commerce, fintech, mobile, and digital media, drawing 100 million-plus user IDs and 44 million monthly active users; e-commerce GMV reached JPY 6.1 trillion (USD 40.7 billion) for the twelve months to March 2025. Amazon Japan leverages global logistics and Prime perks, including video streaming, to drive renewal, while Yahoo Japan nests storefronts inside the PayPay wallet, converting payments data into personalized offers. Vertical champions like ZOZO command fashion mindshare and acquired UK-based Lyst for USD 154 million in April 2025 to boost cross-border discovery. MonotaRO leads industrial supplies, and Oisix captures organic grocery niches, both reinforcing the category-depth strategy.
Mercari’s re-commerce model illustrates disruptive potential: fiscal-2025 cross-border GMV hit JPY 90 billion (USD 600 million), a 15-fold expansion in three years. Perfect Corp.’s generative-AI suite became a must-integrate module for apparel retailers seeking lower return rates, indicating technology partnerships as an emerging moat. Regulatory overhead from the Fair-Trading Act raises fixed compliance costs, unintentionally reinforcing incumbent dominance. Yet social-commerce entrants such as TikTok threaten traditional search-based funnels, suggesting the competitive chessboard remains fluid. Strategic investments now emphasize cross-border capability, AI-driven merchandising, and super-app ecosystems, each a lever to capture incremental share in the Japan E-commerce Market.
Japan E-commerce Industry Leaders
Rakuten Group, Inc.
Mercari, Inc.
Amazon Japan G.K.
Yahoo Japan Corporation
DMM.com LLC
- *Disclaimer: Major Players sorted in no particular order

Recent Industry Developments
- January 2026: Google Wallet completed a phased rollout that allows Japanese commuters to tap transit gates using PayPay balances, closing the gap between daily mobility and retail wallet usage.
- October 2025: PayPay, au PAY, d Payment, and Rakuten Pay went live on Google Wallet, letting users store multiple wallets in one interface.
- September 2025: Mercari launched its Global App, enabling overseas buyers to access Japanese secondhand goods directly.
- July 2025: Tencent Cloud partnered with forGIFT to deploy AR try-on across 50 apparel brands.


Research Methodology Framework and Report Scope
Market Definitions and Key Coverage
Mordor Intelligence defines the Japan e-commerce market as every online transaction, B2C, B2B, and C2C, concluded via internet-enabled devices, expressed in gross merchandise value (USD). The valuation covers domestic and inbound cross-border orders for physical goods and fee-based digital services settled through cards, wallets, BNPL, bank transfer, or cash on delivery.
Scope Exclusion: in-app gaming spend, ticket-resale markups, and marketplace advertising revenue lie outside this study.
Segmentation Overview
- By Business Model
- B2C
- B2B
- By Device Type (B2C)
- Smartphone / Mobile
- Desktop and Laptop
- Other Device Types
- By Payment Method (B2C)
- Credit and Debit Cards
- Digital Wallets
- Buy Now Pay Later (BNPL)
- Other Payment Methodss
- By Product Category (B2C)
- Beauty and Personal Care
- Consumer Electronics
- Fashion and Apparel
- Food and Beverages
- Furniture and Home
- Toys, DIY and Media
- Other Product Categories
Detailed Research Methodology and Data Validation
Primary Research
We spoke with marketplace managers, logistics integrators, and card-scheme executives in Kanto, Kansai, and Kyushu.
Their insights on basket values, mobile-checkout share, and fulfillment constraints calibrated several model assumptions.
Desk Research
Our team began with tier-1 public sources such as METI's FY-2023 EC survey, Statistics Bureau household outlay tables, Bank of Japan payment statistics, and UN Comtrade import flows to size cross-border demand. JADMA whitepapers plus peer-reviewed work on last-mile costs rounded out behavioral inputs.
We then tapped D&B Hoovers for merchant splits and Dow Jones Factiva for deal flow to validate retailer concentration, while company filings, investor decks, and respected news portals filled recent event gaps. The sources listed are illustrative; many additional open and paid references informed our desk analysis.
Market-Sizing & Forecasting
A top-down build started with METI yen totals for B2C, B2B, and C2C, converted to USD using annual average FX, and trimmed for items beyond scope. Select bottom-up checks, sampled platform GMV roll-ups and payment-provider volume disclosures, tested and fine-tuned the totals. Key drivers in our ARIMA with exogenous inputs forecast include smartphone penetration, disposable income per capita, card transaction volume, parcel capacity growth, and cross-border spending propensity. Scenario bands capture labor shortage or tax policy shocks.
Data Validation & Update Cycle
Two analysts review every figure; variances above ±5 % trigger fresh source audits.
We refresh the dataset each year and issue interim updates when FX swings, tax reforms, or major M&A materially alter the baseline.
Why Mordor's Japan E-Commerce Baseline Commands Reliability
Published estimates differ because providers vary segment mix, FX treatment, and refresh cadence. We flag those realities so clients can trace exactly what sits inside our totals.
Key Gap Drivers: some studies track retail B2C only, others fold gaming micro transactions into GMV, and several freeze exchange rates at report launch. Mordor revisits both macro and micro signals annually, which narrows drift.
Benchmark comparison
| Market Size | Anonymized source | Primary gap driver |
|---|---|---|
| USD 186.9 B (2025) | Mordor Intelligence | - |
| USD 206.8 B (2025) | Global Consultancy A | Excludes C2C, single-day FX snapshot |
| USD 258.0 B (2024) | Industry Association B | Includes digital content and gaming spend |
| USD 195 B (2024) | Regional Consultancy C | Partial B2B coverage, five-year-old FX base |
These comparisons show that our disciplined scope selection, iterative validation, and transparent variables yield a balanced, reproducible baseline for decision-makers.


Key Questions Answered in the Report
How large is the Japan E-commerce Market in 2026?
It is valued at USD 207.33 billion and is on track to reach USD 339.73 billion by 2031.
What is the projected CAGR for Japan's online retail sector?
The compound annual growth rate is forecast at 10.38% between 2026 and 2031.
Which payment method is gaining the most share among Japanese shoppers?
Digital wallets are expanding fastest, posting a 13.53% CAGR through 2031, spurred by PayPay's October 2025 link with Google Wallet.
Why is business-to-business e-commerce important in Japan?
B2B procurement is expected to grow at 12.03% annually to 2031 because most indirect materials are still sourced offline, leaving vast room for digitization.
What role does one-hour delivery play in driving sales?
Hyper-local fulfillment in Tokyo and Osaka has shifted competition toward service-level differentiation, raising repeat purchase frequency and basket size.
How are seniors influencing online growth?
Urban seniors now transact on smartphones, bringing high household savings and low price sensitivity into the digital channel, which materially boosts lifetime value.
Page last updated on:


