Market Overview
| Study Period | 2020 - 2031 |
|---|---|
| Forecast Data Period | 2026 - 2031 |
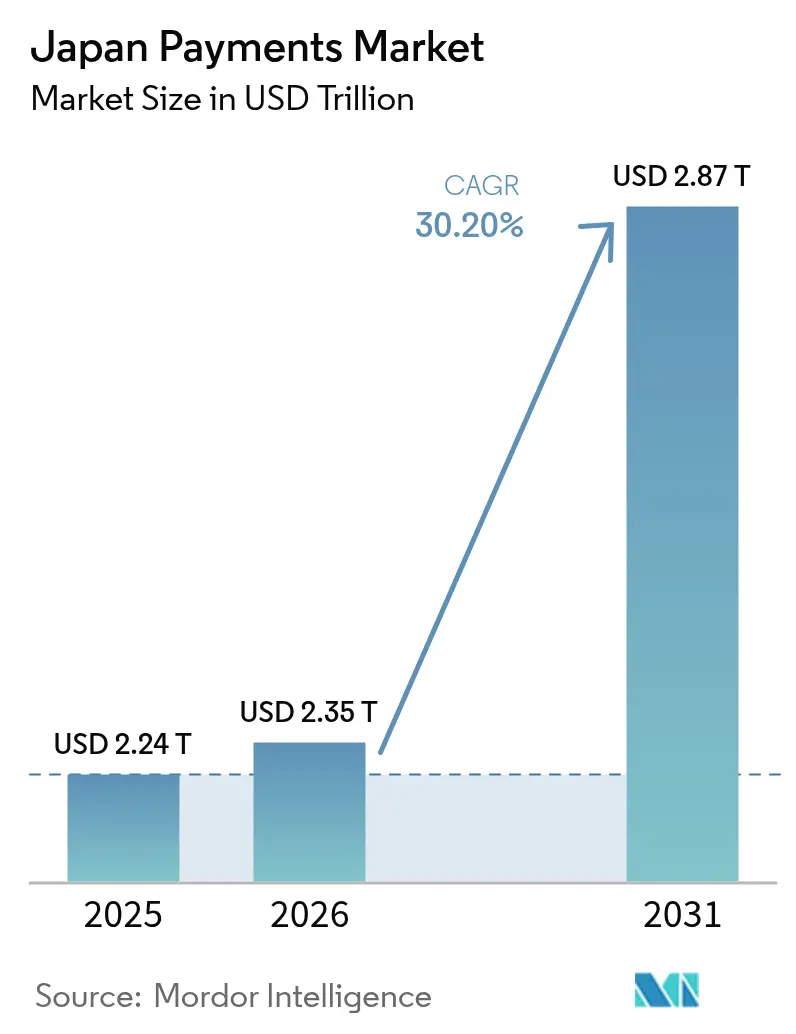
| Base Year Market Size (2025) | USD 2.24 Trillion |
| Market Size (2026) | USD 2.35 Trillion |
| Market Size (2031) | USD 2.87 Trillion |
| Growth Rate (2026 - 2031) | 30.20% CAGR |
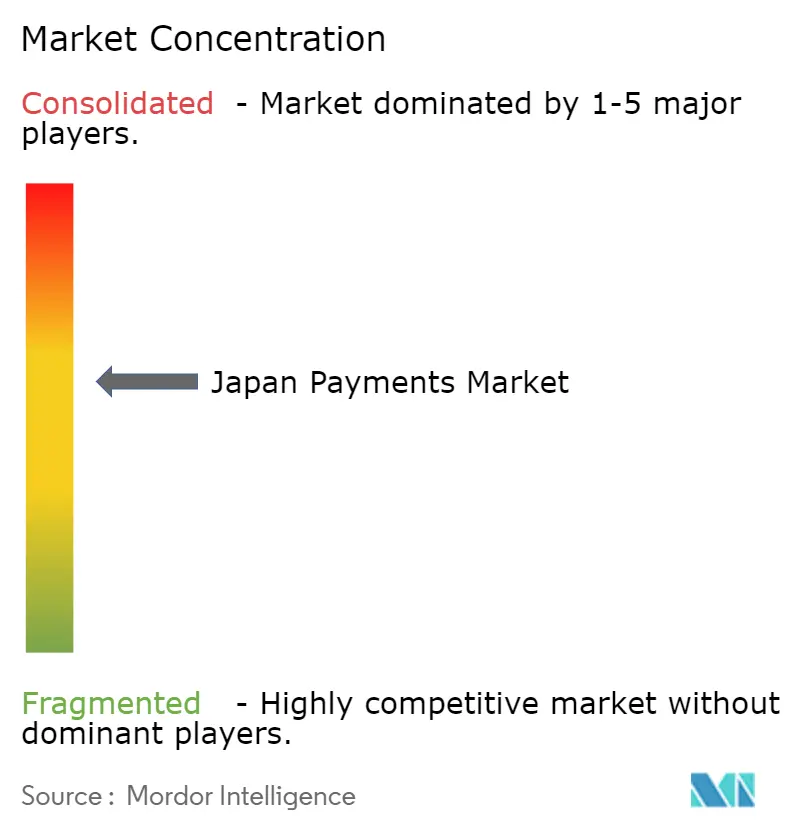
| Market Concentration | Medium |
Major Players *Disclaimer: Major Players sorted in no particular order Image © Mordor Intelligence. Reuse requires attribution under CC BY 4.0. | |
Japan Payments Market Analysis by Mordor Intelligence
The Japan payments market size is expected to increase from USD 2.24 trillion in 2025 to USD 2.35 trillion in 2026 and reach USD 2.87 trillion by 2031, growing at a CAGR of 4.08% over 2026-2031. A decisive pivot away from cash is underway as instant account-to-account rails, QR-code wallets and upgraded card networks converge on a unified, application-programming-interface (API) backbone. Merchant acceptance of digital wallets now exceeds 3 million terminals nationwide, while 5G coverage of 96.3% has slashed authentication latency and enabled biometric checkout at unmanned kiosks. Intensifying policy support, exemplified by consumption-tax rebates and the My Number Card’s expanding role in digital identity, continues to compress the payback period for small-ticket contactless infrastructure. Meanwhile, consolidation among payment processors is accelerating, with scale required to defray fraud-analytics and tokenization costs that have doubled since 2022.
Key Report Takeaways
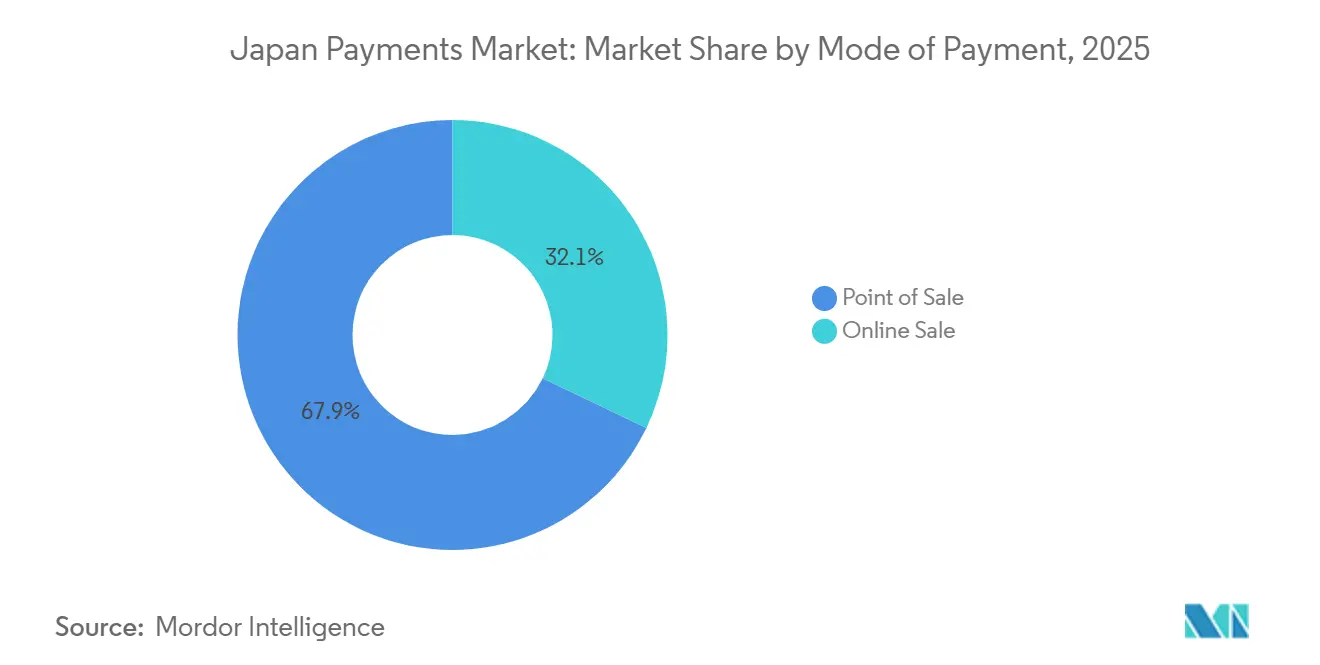
- Point of sale transactions led with 67.89% of Japan payments market share in 2025, while online sales are projected to expand at a 5.43% CAGR through 2031.
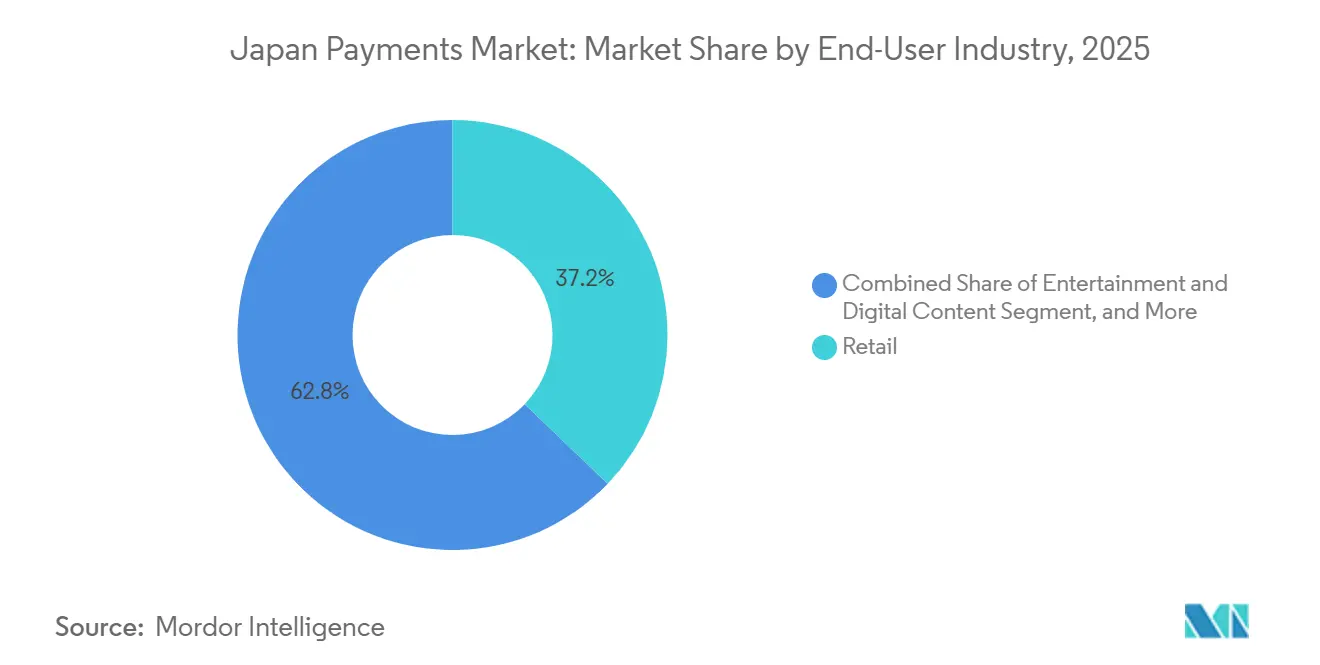
- Retail accounted for 37.17% of transaction value in 2025, whereas healthcare payments are forecast to grow at a 6.24% CAGR to 2031.
Note: Market size and forecast figures in this report are generated using Mordor Intelligence’s proprietary estimation framework, updated with the latest available data and insights as of 2026.
Japan Payments Market Trends and Insights
Drivers Impact Analysis*
| Driver | (~) % Impact on CAGR Forecast | Geographic Relevance | Impact Timeline |
|---|---|---|---|
| Adoption of Online Payments | +1.2% | National, concentrated in Kanto, Kansai and Chubu | Medium term (2-4 years) |
| Government-Led Cashless Incentives | +1.0% | National, higher penetration in urban centers and tourist destinations | Short term (≤2 years) |
| Ubiquitous Smartphone and 5G Connectivity | +0.8% | National, 5G spreading from major cities to regional hubs | Medium term (2-4 years) |
| Integration of MaaS Fare Payments | +0.5% | National, early adoption in Tokyo, Osaka, Nagoya and Fukuoka transit networks | Long term (≥4 years) |
| CBDC Pilot Accelerating Instant A2A Rails | +0.4% | National, pilots in select municipalities | Long term (≥4 years) |
| Corporate B2B Payment Modernization via APIs | +0.3% | National, early adoption among large enterprises and financial institutions | Medium term (2-4 years) |
| Source: Mordor Intelligence | |||
Adoption of Online Payments
E-commerce penetration reached 13.3% of retail sales in 2024, up from 8.9% five years earlier as logistics upgrades shortened next-day delivery coverage to 88% of households.[1]Ministry of Economy, Trade and Industry, “E-Commerce Market Survey,” meti.go.jp Middle-aged consumers accelerated the shift, with those aged 50-64 boosting online spending by 37% between 2019 and 2024.[2]Japan External Trade Organization, “Consumer Shift Toward Online Spending,” jetro.go.jpCard dominance is slipping; credit cards handled 68% of online transactions in 2025, down 4 percentage points year on year as wallets captured share through one-click checkout and loyalty integration. Rakuten’s marketplace processed JPY 5.4 trillion (USD 38.6 billion) in gross merchandise value during fiscal 2024, and wallet attachment cut cart-abandonment by 14 points. Streaming, gaming and other digital-content platforms bypass physical POS entirely, reinforcing the secular tilt toward cloud-based acquiring.
Government-Led Cashless Incentives
The central government allocated JPY 280 billion (USD 2 billion) to terminal-subsidy and reward programs between 2019 and 2024. My Number Card issuance hit 78.3% of residents by December 2025, positioning the credential as a universal login for taxes, welfare and, prospectively, private-sector payments.[3]Digital Agency, “My Number Card Distribution,” digital.go.jp Osaka’s April 2025 QR-based municipal-billing pilot cut collection cycles from 14 days to 2 days and trimmed processing costs 23%.[4]Osaka Prefecture, “Municipal QR Pilot,” pref.osaka.lg.jp Yet subsidy dependency is visible: once point-back rewards expired in October 2024, merchant volumes slid 18% within 90 days, hinting at fragile consumer loyalty. The next policy wave emphasizes back-office adoption, tying corporate tax credits to API-enabled invoicing and instant payroll.
Ubiquitous Smartphone and 5G Connectivity
Smartphone penetration reached 94.2% among adults in 2024, delivering a nationwide hardware base for mobile wallets. By March 2025, the three nationwide carriers blanketed 96.3% of the population with 5G, shrinking average authorization times on near-field-communication (NFC) transactions to under 200 milliseconds.[5]Ministry of Internal Affairs and Communications, “Telecom Statistics,” soumu.go.jp Seven Bank’s QR-cash-out at 26,000 ATMs illustrates converged channel design, allowing app users to withdraw without cards. Low-latency networks also enable real-time fraud scoring, cutting counterfeit-card chargebacks by 11% at major acquirers. Tourism applications benefit; 36.9 million foreign visitors in 2025 relied on wallets that translate in-app menus and execute dynamic currency conversion on the fly.
Integration ff MaaS Fare Payments into the Transit Card Ecosystem
Suica and Pasmo handled 9.8 billion rides in 2024, but mobile tokens are displacing plastic as JR East’s Welcome Suica Mobile extended wallet top-ups to international users in March 2025. A November 2025 agreement to share a unified QR interface across Tokyo and Osaka networks paves the way for bundled mobility-as-a-service (MaaS) subscriptions. Dynamic fare calculation requires legacy fare engines to ingest real-time occupancy data while GDPR-style privacy rules insist on anonymization before external sharing. The Ministry of Land, Infrastructure, Transport and Tourism estimates efficiency gains of JPY 1.2 trillion (USD 8.6 billion) annually once full rollout is achieved. MaaS success is expected to cascade to parking, micromobility and event-ticketing verticals, broadening contactless relevance beyond daily commuting.
Restraints Impact Analysis*
| Restraint | (~) % Impact on CAGR Forecast | Geographic Relevance | Impact Timeline |
|---|---|---|---|
| Ageing Population's Cash Preference | -0.6% | National, most acute in rural prefectures and smaller cities | Long term (≥4 years) |
| Consumer Data-Privacy Concerns | -0.4% | National, heightened in urban areas with higher digital literacy | Medium term (2-4 years) |
| Thin Merchant Margins on Micropayments | -0.3% | National, especially small retailers and service providers | Short term (≤2 years) |
| QR-Code Scheme Interoperability Gaps | -0.2% | National, fragmentation most visible in competitive urban markets | Medium term (2-4 years) |
| Source: Mordor Intelligence | |||
Aging Population’s Cash Preference
Residents aged 65 and older represented 28.6% of Japan’s population in 2024 and executed 71% of their payments in cash. Rural prefectures such as Akita and Shimane, where seniors exceed 35%, register cashless ratios below 25%, stalling terminal roll-outs. Resona introduced a large-font, voice-command wallet in September 2024, garnering 180,000 users within six months. Nonetheless, 63% of seniors say they “see no need to change,” suggesting any shift will hinge on policy levers like pension disbursement via digital rails. Unless cash access is curtailed, gray-market demand for physical yen will cap cashless penetration ceiling at about 80%.
Consumer Data-Privacy Concerns
Revisions to the Act on the Protection of Personal Information strengthened consent and erasure rights in 2022, yet enforcement remains patchy. A July 2024 breach at a mid-tier processor exposed 2.3 million records and triggered a 14% fall in new wallet sign-ups the following quarter. The Personal Information Protection Commission’s March 2025 guidance obliges providers to offer opt-outs, but penalties top out at JPY 100 million (USD 715,000), an amount too small to deter major platforms. Privacy advocates warn that granular purchase histories, location pings and behavioral scores are sold to ad brokers without explicit permission. Heightened scrutiny threatens data-monetization revenue streams that subsidize zero-fee consumer pricing, potentially slowing innovation in risk-based routing and loyalty personalization.
*Our forecasts treat driver/restraint impacts as directional, not additive. The impact forecasts reflect baseline growth, mix effects, and variable interactions.
Segment Analysis
By Mode of Payment: Online Channels Accelerate Amid Physical Dominance
Point of sale held 67.89% of transaction value in 2025, underscoring the continued heft of brick-and-mortar commerce within the Japan payments market. Card products generated 48% of in-store value, while debit and prepaid combined for 21%, reflecting domestic reliance on charge-off-free instruments. Digital wallets reached an 18% in-store foothold as PayPay and Rakuten Pay blanketed convenience stores, yet QR-code fragmentation still compels many stores to display multiple decals at checkout. The smaller online segment captured 32.11% in 2025 but is on track to expand at 5.43% CAGR to 2031, the fastest lane of the Japan payments market. Checkout-abandonment has fallen to a record 68 basis points on leading platforms due to tokenized one-click routines and installment-payment widgets, while logistics providers now levy surcharges that discourage cash-on-delivery. Buy-now-pay-later trafficked 6% of online volume in 2025, addressing thin credit files among Gen Z consumers and smoothing conversion for ticketing and apparel merchants.
Online transaction growth feeds demand for omnichannel acquiring, forcing acquirers to unify fraud engines and loyalty accrual across touchpoints. Prepaid cards bridge cash and digital universes, particularly among privacy-minded gamers; JCB issued 89 million active prepaid cards in 2024, with 34% used strictly online. Regulatory latitude under the Payment Services Act fosters experimentation, provided issuers segregate float in trust accounts. As wallets add bank-directed transfers and instant payouts, the total Japan payments market size processed via fully digital channels is expected to overtake physical card rails within the next decade.


By End-User Industry: Healthcare Digitization Outpaces Retail Maturity
Retail retained 37.17% of value in 2025, but growth is plateauing as penetration nears saturation and average basket value stalls. Convenience chains have achieved more than 97% contactless acceptance, yet processor fee revenue inches forward only as fast as discretionary retail spending. Entertainment and digital content fetched 18% share, propelled by subscription bundling and in-app cosmetic sales, underscoring a usage profile divorced from cash registers. Sony disclosed that digital downloads accounted for 78% of PlayStation unit sales in fiscal 2024, illustrating the runaway shift to cloud-purchased bits.
Healthcare is the outlier, projected to deliver the steepest upswing at 6.24% CAGR. The electronic-claims mandate that took effect in March 2025 forced every clinic to integrate with gateways certified by the Social Insurance Medical Fee Payment Fund. Telemedicine, which processed 12.4 million video consultations in 2024, embeds pay-at-call-end functionality, cutting no-shows by 27%. The resulting uplift means the segment could command a double-digit slice of the Japan payments market size before 2031. Hospitality and travel contribute 14% of throughput; multilingual terminals that accept Alipay and WeChat Pay are now table stakes for hotels in Kansai and Hokkaido. Government and utilities claim 8%, a figure poised to climb once My Number-linked wallets handle tax and water bills, broadening the taxable base and compressing reconciliation cycles across municipal treasuries.

Geography Analysis
Tokyo-centric Kanto anchors roughly one-third of national population and more than 40% of the Japan payments market, supported by dense consumer traffic, headquarters of all major wallets and 24-hour rail lines that have normalized tap-to-ride behavior. JR East processed 5.2 billion Suica taps in 2024, and the region’s 5G saturation sustains biometric checkout pilot programs at major supermarkets. Kansai trails with a mid-teens share yet outperforms in tourist-wallet acceptance; inbound visitors spent USD 14.3 billion via contactless instruments in 2025 as Osaka prepares to host Expo 2025. Chubu leverages manufacturing-centered B2B modernization; Toyota City corporates led early adoption of Zengin’s ISO 20022 APIs to slash supplier-payment processing from two days to sub-hour windows.
Kyushu, particularly Fukuoka, incubates fintech aimed at remittances to Korea and China, handling USD 890 million in 2024 cross-border payments. Tohoku, Hokkaido, Chugoku and Shikoku lag behind, partly because seniors exceed 32% of residents and mobile broadband rolls out four to seven years later than in megacities. Cashless ratios in these regions sit below 30%, even after JPY 42 billion in terminal-installation subsidies (2022-2024) expired. Hokkaido’s ski economy inflates seasonal wallet acceptance to 55%, proving tourism can fast-track contactless adoption when foreign cardholders dominate peak-season receipts.
The Digital Agency’s roadmap shows a nationwide authentication layer by 2028, yet municipal IT capacity gaps widen regional disparities. Merchants in hot-spring villages must maintain three distinct QR readers, as PayPay and Rakuten Pay still withhold JPQR compliance, fragmenting user journeys. Consequently, the Japan payments market share of urban prefectures will likely rise at the expense of rural corridors until interoperability and network cost curves converge.
Competitive Landscape
Competition manifests as a barbell. On one end, PayPay, Rakuten Pay, au PAY and d Barai pursue user-scale warfare, spending an estimated USD 1 billion in combined rewards during 2025. PayPay crossed 70 million users in July 2025, 55% of the population, and has exclusive cashback agreements with FamilyMart and Uniqlo. Rakuten Pay exploits ecosystem flywheels, exchanging Super Points for fee concessions and capturing a rising slice of the group’s e-commerce gross merchandise value. Telecom wallets leverage billing relationships to preset auto-charge, minimizing registration friction for 170 million mobile subscribers.
The mid-tier processor layer is consolidating: GMO Payment Gateway’s December 2025 pickup of Epsilon added 18,000 merchants, raising total throughput toward USD 100 billion annually, a scale that justifies proprietary risk-scoring engines. Traditional megabanks preserve dominance in card issuing and merchant acquiring but face erosion in wallet brand visibility. They respond with fintech joint ventures, such as Mitsubishi UFJ’s stake in mobile ledger Musubime, and with open-banking APIs that let third-party wallets draw on deposit funding instantly.
White-space pockets invite new entrants. Healthcare orchestration lacks a champion capable of stitching together claims, pharmacy dispensing and patient co-pays. B2B payments, especially for SMEs, present a USD 180 billion opportunity as paper invoices give way to e-invoicing mandated under the Qualified Invoice System. Cross-border corridors, valued at USD 4.8 billion in 2024, face cost disruption from blockchain rails able to clear under 1% fees versus the incumbent 5%. The Payment Services Act sets prudential guardrails without interchange caps, a stance that keeps the door open to global platforms like Stripe and Adyen that market unified payout across 30+ currencies.
Japan Payments Industry Leaders
Mitsubishi UFJ Financial Group
KDDI Corporation (AuPay)
Merpay, Inc.
Resona Holdings, Inc.
Japan Post Bank Co., Ltd.
- *Disclaimer: Major Players sorted in no particular order

Recent Industry Developments
- January 2026: JR East and Pasmo set the start of unified QR pilot across Tokyo and Osaka networks for Q2 2026.
- December 2025: GMO Payment Gateway completed the acquisition of Epsilon, expanding its merchant base by 18,000 accounts.
- November 2025: JR East and Pasmo operators announced the shared QR interface for trains and buses in major metros.
- July 2025: PayPay reported 70 million registered users, equal to roughly 55% of the population.


Japan Payments Market Report Scope
The payments market is segmented by two modes of payment - POS and e-commerce. E-commerce payments include online purchases of goods and services, such as purchases made on e-commerce websites and online bookings for travel and accommodation. However, they do not include online purchases of motor vehicles, real estate, payments of utility bills (such as water, heating, and electricity), mortgage payments, loans, credit card bills, or purchases of shares and bonds. In the POS segment, all transactions that occur at the physical point of sale are included in the scope of the market studied. It includes traditional in-store transactions and all face-to-face transactions, regardless of where they occur. Cash is also considered for both cases (cash on delivery for e-commerce sales).
The Japan Payments Market Report is Segmented by Mode of Payment (Point of Sale including Card Payments, Digital Wallets, and Other POS; Online Sale including Card Payments, Digital Wallets, and Other Online Sales), End-User Industry (Retail, Entertainment and Digital Content, Healthcare, Hospitality and Travel, Government and Utilities, Other End-User Industries), and Geography. The Market Forecasts are Provided in Terms of Value (USD).
By Mode of Payment
| Point of Sale | Card Payments | Debit Cards |
| Credit Cards | ||
| Bank Financing Prepaid Cards | ||
| Digital Wallets (Includes Mobile Wallet) | ||
| Other Point of Sale | ||
| Online Sale | Card Payments | Debit Cards |
| Credit Cards | ||
| Bank Financing Prepaid Cards | ||
| Digital Wallets | ||
| Other Online Sales (Includes Cash on Delivery, Bank Transfer, and Buy Now Pay Later) |
By End-User Industry
| Retail |
| Entertainment and Digital Content |
| Healthcare |
| Hospitality and Travel |
| Government and Utilities |
| Other End-User Industries |
| By Mode of Payment | Point of Sale | Card Payments | Debit Cards |
| Credit Cards | |||
| Bank Financing Prepaid Cards | |||
| Digital Wallets (Includes Mobile Wallet) | |||
| Other Point of Sale | |||
| Online Sale | Card Payments | Debit Cards | |
| Credit Cards | |||
| Bank Financing Prepaid Cards | |||
| Digital Wallets | |||
| Other Online Sales (Includes Cash on Delivery, Bank Transfer, and Buy Now Pay Later) | |||
| By End-User Industry | Retail | ||
| Entertainment and Digital Content | |||
| Healthcare | |||
| Hospitality and Travel | |||
| Government and Utilities | |||
| Other End-User Industries | |||


Key Questions Answered in the Report
How large is cash usage among seniors in Japan?
Individuals aged 65 and older still settle 71% of their payments in cash, a key drag on cashless momentum.
What CAGR is forecast for online payments in Japan through 2031?
Online channels are projected to grow at a 5.43% CAGR from 2026 to 2031.
Which segment leads the Japan payments market by share?
Point of sale transactions dominated with 67.89% share in 2025.
Why is healthcare the fastest-growing end-user segment?
A nationwide electronic-claims mandate and telemedicine uptake are pushing healthcare payments toward a 6.24% CAGR.
How many users does PayPay have?
PayPay surpassed 70 million registered users in July 2025, equal to roughly 55% of the population.
What role will a CBDC play in Japan?
The Bank of Japan pilot is refining offline functionality and programmability, but officials have not committed to issuance, so its impact remains medium-to-long term.
Page last updated on:


