Market Overview
| Study Period | 2020 - 2031 |
|---|---|
| Forecast Data Period | 2026 - 2031 |
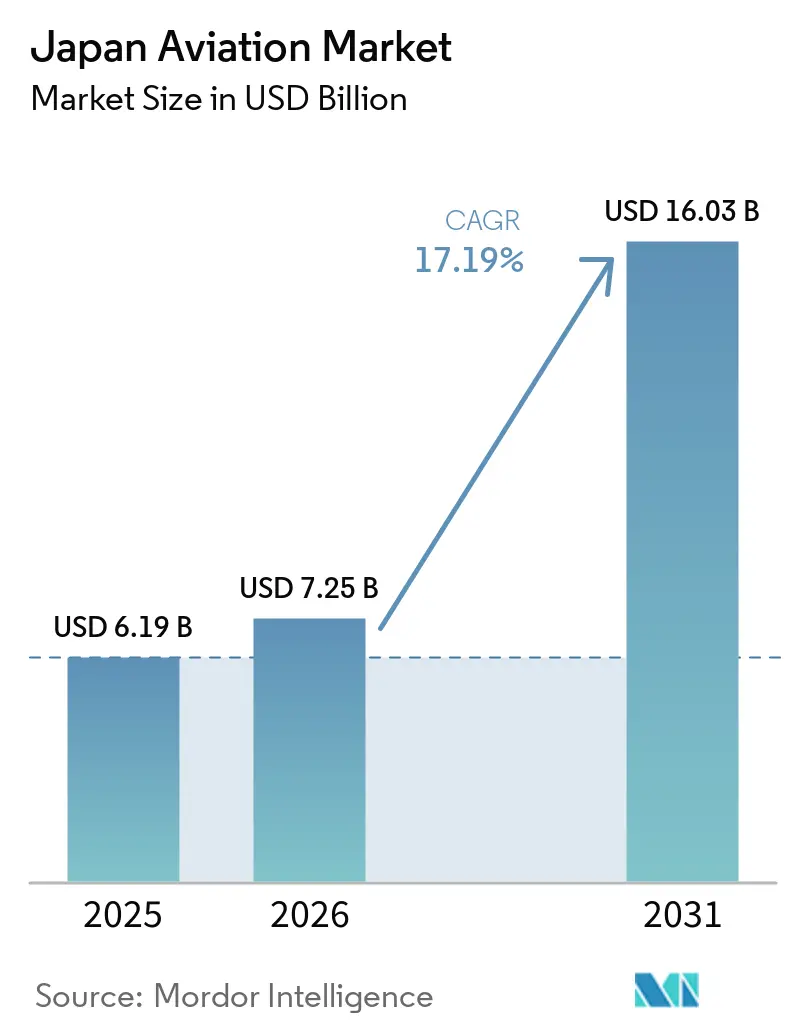
| Base Year Market Size (2025) | USD 6.19 Billion |
| Market Size (2026) | USD 7.25 Billion |
| Market Size (2031) | USD 16.03 Billion |
| Growth Rate (2026 - 2031) | 17.19% CAGR |
| Market Concentration | Medium |
Major Players *Disclaimer: Major Players sorted in no particular order Image © Mordor Intelligence. Reuse requires attribution under CC BY 4.0. | |
Japan Aviation Market Analysis by Mordor Intelligence
Japan Aviation market size in 2026 is estimated at USD 7.25 billion, growing from 2025 value of USD 6.19 billion with 2031 projections showing USD 16.03 billion, growing at 17.19% CAGR over 2026-2031. Capacity growth stems from a synchronized rebound in international tourism, unprecedented defense spending, and accelerated modernization programs for the fleet. Domestic carriers have secured early production slots for next-generation narrowbody and widebody aircraft, thereby insulating their operations from global supply chain volatility. At the same time, record defense budgets finance the co-development of sixth-generation fighter platforms, creating spill-over benefits for local suppliers of advanced materials, avionics, and MRO services. New sustainability mandates, ranging from carbon-fiber weight-reduction initiatives to hydrogen-electric propulsion trials, keep the Japan Aviation market at the forefront of Asia-Pacific innovation while sustaining profitable load factors on key long-haul routes.
Key Report Takeaways
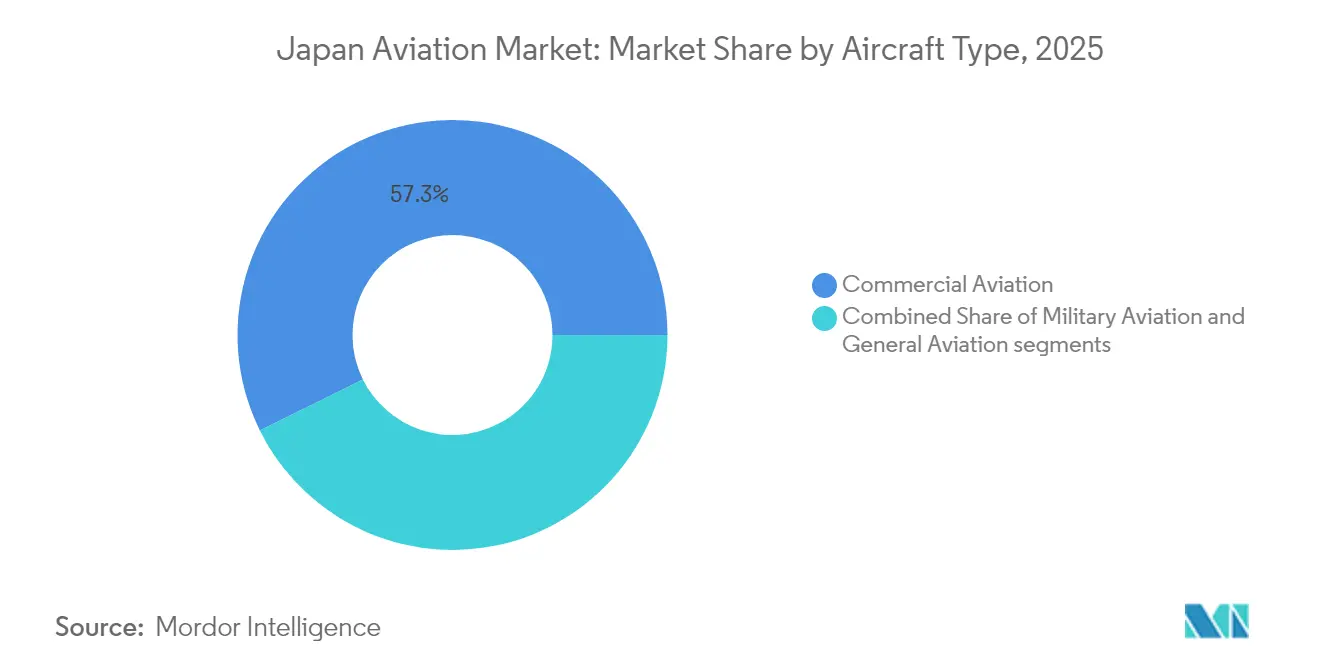
- By aircraft type, commercial aviation led with a 57.32% share of the Japan Aviation market in 2025, whereas military aviation is projected to expand at a 18.77% CAGR to 2031.
- By propulsion technology, turbofan engines accounted for 57.88% of the Japan Aviation market size in 2025, while the “Others” category is set to post the fastest 19.36% CAGR through 2031.
- By end user, civil and commercial operators commanded 61.12% of Japan aviation market share in 2025, while business and general aviation owners are poised for a 18.94% CAGR during the forecast period.
Note: Market size and forecast figures in this report are generated using Mordor Intelligence’s proprietary estimation framework, updated with the latest available data and insights as of 2026.
Japan Aviation Market Trends and Insights
Drivers Impact Analysis*
| Driver | (~) % Impact on CAGR Forecast | Geographic Relevance | Impact Timeline |
|---|---|---|---|
| Surge in inbound tourism post pandemic | +3.2% | Nationwide; early gains in Tokyo, Osaka, Kyoto | Short term (≤ 2 years) |
| Record defense budget boosting fighter and rotorcraft procurement | +4.1% | Nationwide; defense-manufacturing hubs | Medium term (2-4 years) |
| Fleet renewal by airlines favoring fuel-efficient aircraft | +2.8% | Major airline hubs | Medium term (2-4 years) |
| Growth in e-commerce increasing demand for freighter conversions | +1.9% | Cargo-focused regions | Short term (≤ 2 years) |
| Steady helicopter replacement demand in disaster response and offshore missions | +1.4% | Coastal and mountainous areas | Long term (≥ 4 years) |
| Expansion of domestic carbon fiber capacity strengthening supply chain | +2.1% | Advanced-manufacturing clusters | Long term (≥ 4 years) |
| Source: Mordor Intelligence | |||


Surge in Inbound Tourism Post Pandemic
Japan aims to attract 60 million overseas visitors by 2030, a goal already supported by double-digit monthly arrivals in 2025. ANA Holdings reinforced the premium segment by taking a stake in XPERISUS, a curator of bespoke travel experiences, to capture higher revenue per passenger. Airlines are responding with widebody retrofits that expand premium-cabin density while retaining economy-class seat counts, balancing yield and volume. Regional airports, from Kyushu to Hokkaido, now host more direct international services as tourists seek heritage and culinary experiences beyond the Tokyo-Osaka axis. These dispersed flows encourage operators of 70- to 150-seat aircraft and helicopter tour providers to broaden route maps, stimulating auxiliary segments such as ground handling and hospitality training. The tourism-linked uplift remains front-loaded, with pronounced gains expected through 2027, before growth normalizes to structural demand tied to cultural, business events, and remote work travel.
Record Defense Budget Boosting Fighter and Rotorcraft Procurement
In FY 2025 Japan's Defense budget topped USD 52 billion, directing new funds to the Global Combat Air Programme (GCAP) it is co-developing with the United Kingdom and Italy.[1]EU-Japan Centre, “Weekly Japanese Industry and Policy News,” eu-japan.eu The project transfers stealth-airframe and mission-system design authority to Japanese primes, elevating domestic aerospace know-how ahead of prototype rollout in 2026. Complementary investments in multi-mission helicopters protect maritime assets and strengthen disaster-response readiness. A parallel workforce plan removed minimum height limits for pilot applicants, broadening the talent pipeline and integrating gender-diverse cadets across all service branches.[2]AvioNews, “Japan Revolutionizes Pilot Recruitment Criteria,” avionews.it Rising procurement outlays cascade through suppliers of carbon-fiber composites, infrared sensors, and electronic warfare suites, cementing Japan’s status as a regional defense and aviation hub with growing export potential.
Fleet Renewal Favoring Fuel-Efficient Aircraft
Japan Airlines’ multibillion-dollar order for 42 A350-900, A321neo, and 787-9 aircraft underscores a shift toward 15–20% lower fuel burn and up to 30% maintenance-cost savings compared with retiring types. Securing early slots shields carriers from ongoing airframe-delivery backlogs and positions fleets for tighter CO₂ caps from 2027 onward. Cabin configuration flexibility allows airlines to swap seat mixes between premium leisure and corporate itineraries without extensive downtime. Regional operators mirror this strategy: smaller carriers, such as JeyCas Airways, plan ATR deliveries to open thin routes while replacing older turboprops that face escalating part shortages. Together, these moves keep the Japan Aviation market ahead of ICAO’s CORSIA compliance curve and deliver a structural margin advantage versus regional peers.
Growth in E-commerce Driving Freighter Conversions
Domestic parcel volume climbed 11% year-on-year in 2024, spurring demand for main-deck cargo space. Airborne Capital’s A321 passenger-to-freighter program at Naha Airport demonstrates how localized conversion lines shorten turnaround times and cut logistics costs. Logistics giants leverage the narrow-body freighter’s standardized container profile to serve time-definite deliveries between Tokyo, Osaka, and Fukuoka, while freeing widebodies for trans-Pacific lanes. The model also buffers capacity against global airframe delays, letting integrators scale fleets independently of OEM production rates. New routes for pharmaceutical cold-chain and semiconductor equipment add further momentum to the dedicated-freighter segment, solidifying freight conversions as a strategic pillar of the Japanese aviation market.
Restraints Impact Analysis*
| Restraint | (~) % Impact on CAGR Forecast | Geographic Relevance | Impact Timeline |
|---|---|---|---|
| Pilot shortage driven by aging workforce and training limitations | -2.7% | Nationwide; acute in regional and cargo ops | Medium term (2-4 years) |
| Aircraft delivery delays and ongoing spare parts shortages | -1.9% | All operator categories | Short term (≤ 2 years) |
| High landing fees and slot constraints at Tokyo airports | -1.3% | Tokyo metro; spillover to regional hubs | Long term (≥ 4 years) |
| Termination of the SpaceJet program reducing indigenous OEM expertise | -0.8% | Aerospace-manufacturing regions | Long term (≥ 4 years) |
| Source: Mordor Intelligence | |||
Pilot Shortage Driven by Aging Workforce and Training Limitations
The average pilot age at full-service carriers surpassed 49 years in 2025, straining roster planning during peak traffic periods. The SKYCAMP initiative, a collaboration between Kagoshima University, JAL, and Japan Airlines, has produced its first cadets, who will enter line service in 2026, providing a template for regional talent pipelines. JAL partnered with JAXA to develop AI-driven proficiency-forecast models that reduced simulator hours by up to 20% while maintaining safety thresholds. Even so, training capacity ceilings and high tuition deter recruits, especially for cargo and turboprop roles that require multiple ratings. Policy responses include relaxed visa pathways for foreign captains and widened eligibility criteria for military cadets. Still, these measures will mature only after 2027, leaving a medium-term capacity gap in the Japan Aviation market.
Aircraft Delivery Delays and Ongoing Spare-Parts Shortages
Persistent supply-chain bottlenecks pushed average narrowbody delivery lead times to 26 months in 2025, forcing ANA Holdings to extend leases on older 777-200ERs and 767-300Fs to safeguard capacity. Engine OEMs grapple with casting- and blade-coating backlogs, elongating shop-visit cycles, and swelling reserve-part inventories. Operators have responded by clustering heavy checks to unlock economies of scale and using predictive maintenance analytics to extendictive-maintenance analytics to stretch on-wing times without compromising dispatch reliability. However, the strategy inflates capital expenditures and limits fleet growth flexibility, weighing on the near-term CAGR contribution of the Japanese aviation market.
*Our forecasts treat driver/restraint impacts as directional, not additive. The impact forecasts reflect baseline growth, mix effects, and variable interactions.
Segment Analysis
By Aircraft Type: Military Aviation Drives Growth
Military aviation contributed 18.77% CAGR to the Japan Aviation market between 2026 and 2031, outpacing all other categories despite commercial aviation holding a 57.32% revenue share in 2025. Fighter-procurement budgets earmarked for GCAP prototypes and F-35 follow-on orders underpin spending momentum, while transport-helicopter acquisitions address humanitarian relief and maritime security missions. The Japan Aviation market size for military fixed-wing assets is forecast to exceed USD 4.46 billion by 2031, reflecting steady pipeline funding and localized sustainment contracts. Commercial carriers nevertheless secure the larger revenue pool through passenger-traffic recovery and premium-cabin densification programs that enhance unit economics.
Rotorcraft fleets across defense and civil agencies capitalize on shared maintenance infrastructure, which lowers per-flight-hour costs and accelerates fleet turnover. Regulatory harmonization between the Japan Civil Aviation Bureau and the Ministry of Defense simplifies dual-use certification pathways, enabling manufacturers to amortize research and development costs across both civilian and military variants. The blended demand profile improves order-book visibility and fosters economies of scale, uplifting the Japan Aviation market.


By Propulsion Technology: Sustainable Systems Gain Momentum
Turbofan engines delivered 57.88% of the Japan Aviation market share in 2025, yet the “Others” category—comprising hydrogen-electric and hybrid platforms—is projected to lead with a 19.36% CAGR through 2031. Investments, such as ITOCHU’s USD 100 million stake in ZeroAvia for Asian hydrogen-electric engine sales, elevate Japan from an early adopter to a strategic supply-chain node. The Japan Aviation market size for alternative-propulsion demonstrators is expected to reach USD 775.6 million by 2031, converging with SAF-ready turbofan retrofits on a cost-per-ASK basis.
Electric-hybrid systems target 500-km regional segments, where battery-assisted takeoff and climb phases reduce fuel burn by 30% compared to comparable turboprops. Hydrogen infrastructure pilots at Chubu and Kansai airports validate cryogenic-storage and refueling cycles, de-risking commercial rollouts from 2028 onward. OEM partnerships with automotive majors further accelerate cross-industry technology transfer, embedding long-term upside into the Japan Aviation market.
By End User: Business Aviation Accelerates
Civil and commercial operators retained 61.12% of revenue in 2025, but business and general aviation owners will add the highest incremental value at a 18.94% CAGR through 2031. Corporate time-efficiency pressures and a rise in regional headquarters relocations to Osaka and Fukuoka elevate charter demand. Honda Aircraft’s next-generation Echelon model, boasting 20% fuel efficiency gains, aligns with operating cost thresholds acceptable to mid-sized enterprises.
The initiative complements existing heliport networks and creates an on-ramp for electrified short-haul services that feed mainline airline hubs. Collectively, these dynamics widen the end-user base and strengthen revenue diversification in the Japanese aviation market.

Geography Analysis
The Tokyo metropolitan system accounted for the majority of passenger traffic in 2024, anchoring the Japanese aviation market despite the near saturation of prime slots. Airlines offset capacity constraints by up-gauging to A350-900s and 787-10s on trunk routes, extracting incremental seat-kilometers from finite movements.
Osaka positions itself as a secondary international node, leveraging Kansai Airport’s 24-hour operations to attract China-bound cargo frequencies during the 2025 World Expo. The Kansai cluster also benefits from government incentives for hydrogen-propulsion ground tests and SAF-blending trials, embedding a developmental edge that lifts local GDP contributions.
Northern and southern prefectures—Hokkaido and Kyushu—register the fastest growth rates in traffic, supported by a tourism rebound and logistics for offshore wind farms. Regional airlines capitalize on shorter stage lengths and high load factors, underpinning resilient profitability against higher per-movement fees. These distributed gains underscore a gradual pivot from a Tokyo-centric system to a more balanced geography within the Japan aviation market.
Competitive Landscape
Market concentration in 2025 remains moderate, with ANA Holdings and Japan Airlines capturing the majority of scheduled domestic passengers, yet facing encroachment from Peach Aviation, Skymark, and StarFlyer in price-sensitive leisure corridors. Strategic diversification into premium tourism curation, hydrogen propulsion partnerships, and venture capital funds illustrates how incumbents hedge against legacy airline margin compression.
OEM–supplier alliances deepen as Airbus teams with Toshiba on superconductivity for hydrogen aircraft, while Toray advances composite technology that shaves hundreds of kilograms off widebody operating weights. MRO joint ventures such as JAL–Mitsubishi Heavy Industries expand domestic heavy-check capacity, mitigating overseas slot scarcity and keeping maintenance spend onshore.
Disruptive entrants accelerate the technology curve: NTT DOCOMO’s USD 100 million commitment to Airbus’s HAPS program signals telecom convergence with high-altitude platforms. These developments collectively sharpen competitive intensity while expanding the solution set available to end users, enriching the Japan Aviation market.
Japan Aviation Industry Leaders
Airbus SE
Kawasaki Heavy Industries, Ltd.
Lockheed Martin Corporation
The Boeing Company
Mitsubishi Heavy Industries, Ltd.
- *Disclaimer: Major Players sorted in no particular order


Recent Industry Developments
- August 2025: The Japan Air Self-Defense Force received its first three F-35B Lightning II fighters, which feature short take-off and vertical-landing capabilities, and established a provisional F-35B squadron.
- April 2025: The Japan Self-Defense Forces (JSDF) ordered 17 CH-47 Block 2 Chinook extended range helicopters to modernize its fleet, replacing a portion of its existing CH-47JA aircraft. Boeing Company and Kawasaki Heavy Industries (KHI) will jointly manufacture these aircraft.


Japan Aviation Market Report Scope
Commercial Aviation, General Aviation, Military Aviation are covered as segments by Aircraft Type.
By Aircraft Type
| Commercial Aviation | Passenger Aircraft | Narrowbody Aircraft |
| Widebody Aircraft | ||
| Freighter | ||
| General Aviation | Business Jets | Large Jet |
| Mid-Size Jet | ||
| Light Jet | ||
| Helicopters | ||
| Others | ||
| Military Aviation | Fixed-Wing Aircraft | Multi-Role Aircraft |
| Training Aircraft | ||
| Transport Aircraft | ||
| Others | ||
| Rotorcraft | Multi-Mission Helicopter | |
| Transport Helicopter | ||
| Training | ||
By Propulsion Technology
| Turboprop |
| Turbofan |
| Piston Engine |
| Turboshaft |
| Others |
By End User
| Civil and Commercial Operators |
| Government and Defense Agencies |
| Business and General Aviation Operators |
| By Aircraft Type | Commercial Aviation | Passenger Aircraft | Narrowbody Aircraft |
| Widebody Aircraft | |||
| Freighter | |||
| General Aviation | Business Jets | Large Jet | |
| Mid-Size Jet | |||
| Light Jet | |||
| Helicopters | |||
| Others | |||
| Military Aviation | Fixed-Wing Aircraft | Multi-Role Aircraft | |
| Training Aircraft | |||
| Transport Aircraft | |||
| Others | |||
| Rotorcraft | Multi-Mission Helicopter | ||
| Transport Helicopter | |||
| Training | |||
| By Propulsion Technology | Turboprop | ||
| Turbofan | |||
| Piston Engine | |||
| Turboshaft | |||
| Others | |||
| By End User | Civil and Commercial Operators | ||
| Government and Defense Agencies | |||
| Business and General Aviation Operators | |||


Market Definition
- Aircraft Type - All the aircraft related to commercial, military and general aviation have been included in this study
- Sub-Aircraft Type - Fixed-Wing passenger aircraft, freighter aircraft, business jets, piston fixed-wing aircraft, military fixed-wing aircraft, and rotorcraft are included under this study.
- Body Type - Body type includes all types of aircraft segmented based on application/size/capacity/role.
| Keyword | Definition |
|---|---|
| IATA | IATA stands for the International Air Transport Association, a trade organization composed of airlines around the world that has an influence over the commercial aspects of flight. |
| ICAO | ICAO stands for International Civil Aviation Organization, a specialized agency of the United Nations that supports aviation and navigation around the globe. |
| Air Operator Certificate (AOC) | A certificate granted by a National Aviation Authority permitting the conduct of commercial flying activities. |
| Certificate Of Airworthiness (CoA) | A Certificate Of Airworthiness (CoA) is issued for an aircraft by the civil aviation authority in the state in which the aircraft is registered. |
| Gross Domestic Product (GDP) | Gross domestic product (GDP) is a monetary measure of the market value of all the final goods and services produced in a specific time period by countries. |
| RPK (Revenue Passenger Kilometres) | The RPK of an airline is the sum of the products obtained by multiplying the number of revenue passengers carried on each flight stage by the stage distance - it is the total number of kilometers traveled by all revenue passengers. |
| Load Factor | The load factor is a metric used in the airline industry that measures the percentage of available seating capacity that has been filled with passengers. |
| Original Equipment Manufacturer (OEM) | An original equipment manufacturer (OEM) traditionally is defined as a company whose goods are used as components in the products of another company, which then sells the finished item to users. |
| International Transportation Safety Association (ITSA) | International Transportation Safety Association (ITSA) is an international network of heads of independent safety investigation authorities (SIA). |
| Available Seats Kilometre (ASK) | This metric is calculated by multiplying Available Seats (AS) in one flight, defined above, multiplied by the distance flown. |
| Gross Weight | The fully-loaded weight of an aircraft, also known as “takeoff weight,” which includes the combined weight of passengers, cargo, and fuel. |
| Airworthiness | The ability of an aircraft, or other airborne equipment or system, to operate in flight and on the ground without significant hazard to aircrew, ground crew, passengers or to other third parties. |
| Airworthiness Standards | Detailed and comprehensive design and safety criteria applicable to the category of aeronautical product (aircraft, engine or propeller). |
| Fixed Base Operator (FBO) | A business or organization that operates at an airport. An FBO provides aircraft operating services like maintenance, fueling, flight training, charter services, hangaring, and parking. |
| High Net worth Individuals (HNWIs) | High Net worth Individuals (HNWIs) are individuals with over USD 1 million in liquid financial assets. |
| Ultra High Net worth Individuals (UHNWIs) | Ultra High Net worth Individuals (UHNWIs) are individuals with over USD 30 million in liquid financial assets. |
| Federal Aviation Administration (FAA) | The division of the Department of Transportation is concerned with aviation. It operates Air Traffic Control and regulates everything from aircraft manufacturing to pilot training to airport operations in the United States. |
| EASA (European Aviation Safety Agency) | The European Aviation Safety Agency is a European Union agency established in 2002 with the task of overseeing civil aviation safety and regulation. |
| Airborne Warning and Control System (AW&C) aircraft | Airborne Warning and Control System (AEW&C) aircraft is equipped with a powerful radar and on-board command and control center to direct the armed forces. |
| The North Atlantic Treaty Organization (NATO) | The North Atlantic Treaty Organization (NATO), also called the North Atlantic Alliance, is an intergovernmental military alliance between 30 member states – 28 European and two North American. |
| Joint Strike Fighter (JSF) | Joint Strike Fighter (JSF) is a development and acquisition program intended to replace a wide range of existing fighter, strike, and ground attack aircraft for the United States, the United Kingdom, Italy, Canada, Australia, the Netherlands, Denmark, Norway, and formerly Turkey. |
| Light Combat Aircraft (LCA) | A light combat aircraft (LCA) is a light, multirole jet/turboprop military aircraft, commonly derived from advanced trainer designs, designed for engaging in light combat. |
| Stockholm International Peace Research Institute (SIPRI) | Stockholm International Peace Research Institute (SIPRI) is an international institute that provides data, analysis, and recommendations for armed conflict, military expenditure, and arms trade as well as disarmament and arms control. |
| Maritime Patrol Aircraft (MPA) | A maritime patrol aircraft (MPA), also known as maritime reconnaissance aircraft is a fixed-wing aircraft designed to operate for long durations over water in maritime patrol roles, in particular, anti-submarine warfare (ASW), anti-ship warfare (AShW), and search and rescue (SAR). |
| Mach Number | The Mach number is defined as the ratio of true airspeed to the speed of sound at the altitude of a given aircraft. |
| Stealth Aircraft | Stealth is a Common term applied to low observable (LO) technology and doctrine, that makes an aircraft near invisible to radar, infrared or visual detection. |


Research Methodology
Mordor Intelligence follows a four-step methodology in all our reports.
- Step-1: Identify Key Variables: In order to build a robust forecasting methodology, the variables and factors identified in Step-1 are tested against available historical market numbers. Through an iterative process, the variables required for market forecast are set and the model is built on the basis of these variables.
- Step-2: Build a Market Model: Market-size estimations for the historical and forecast years have been provided in revenue and volume terms. For sales conversion to volume, the average selling price (ASP) is kept constant throughout the forecast period for each country, and inflation is not a part of the pricing.
- Step-3: Validate and Finalize: In this important step, all market numbers, variables and analyst calls are validated through an extensive network of primary research experts from the market studied. The respondents are selected across levels and functions to generate a holistic picture of the market studied.
- Step-4: Research Outputs: Syndicated Reports, Custom Consulting Assignments, Databases & Subscription Platforms


