Market Overview
| Study Period | 2020 - 2031 |
|---|---|
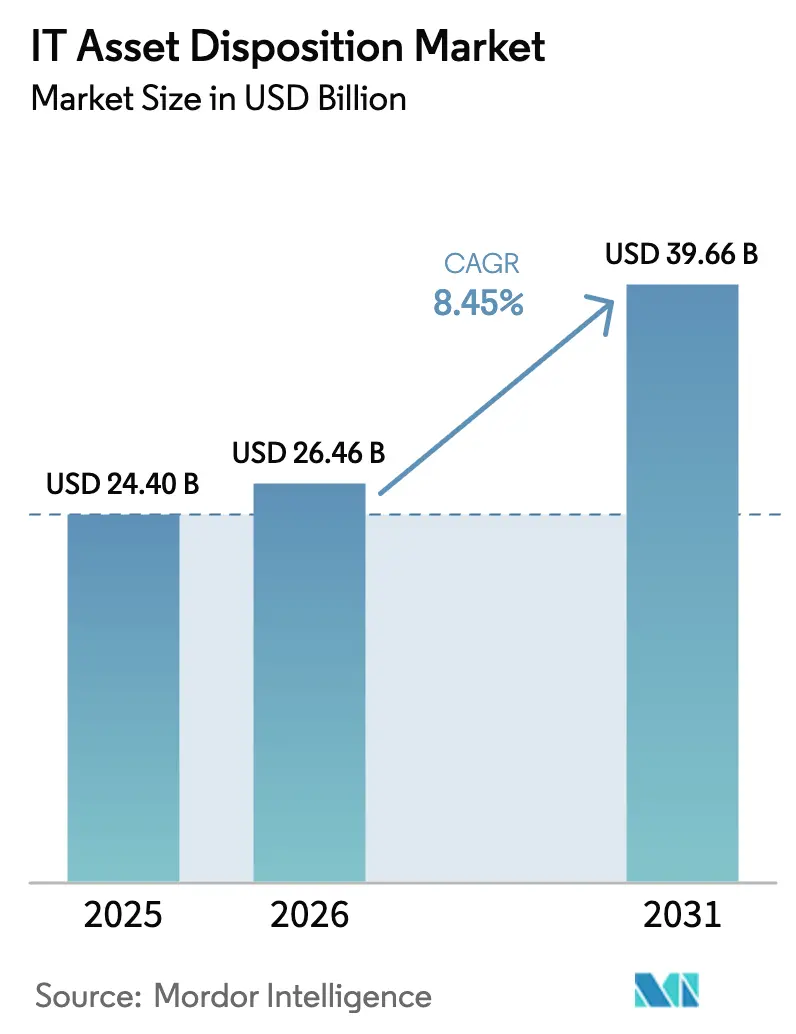
| Market Size (2026) | USD 26.46 Billion |
| Market Size (2031) | USD 39.66 Billion |
| Growth Rate (2026 - 2031) | 8.45% CAGR |
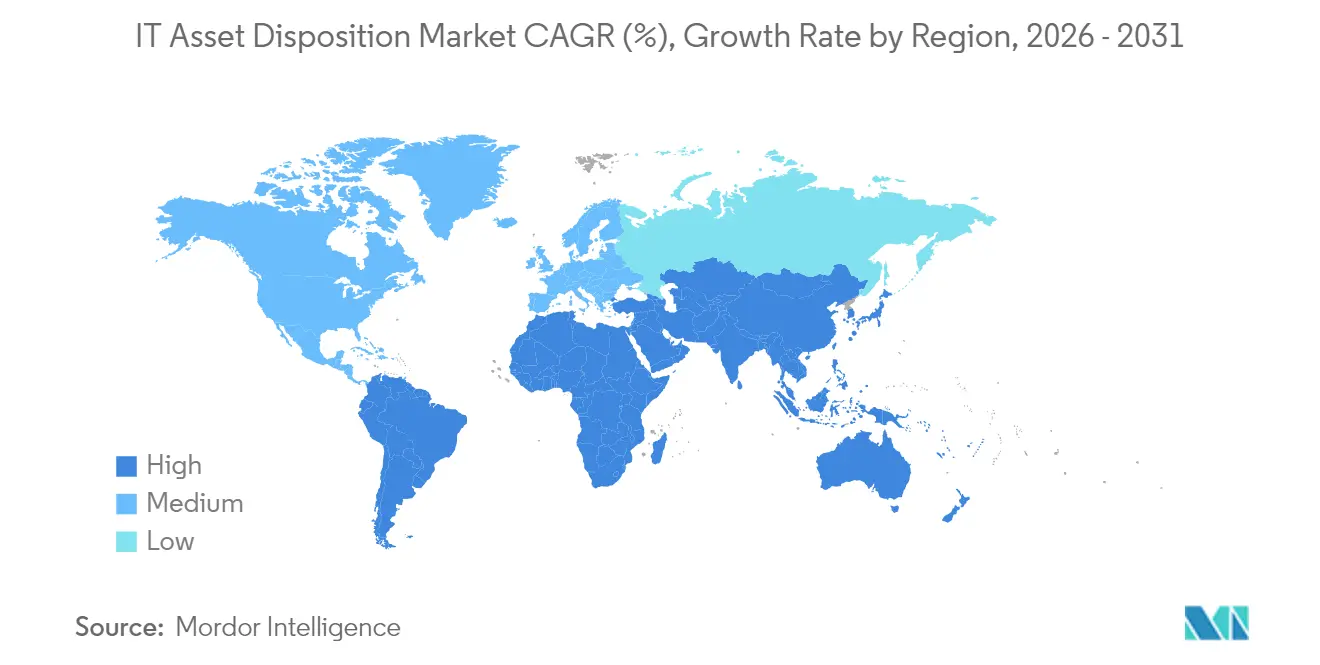
| Fastest Growing Market | Asia Pacific |
| Largest Market | North America |
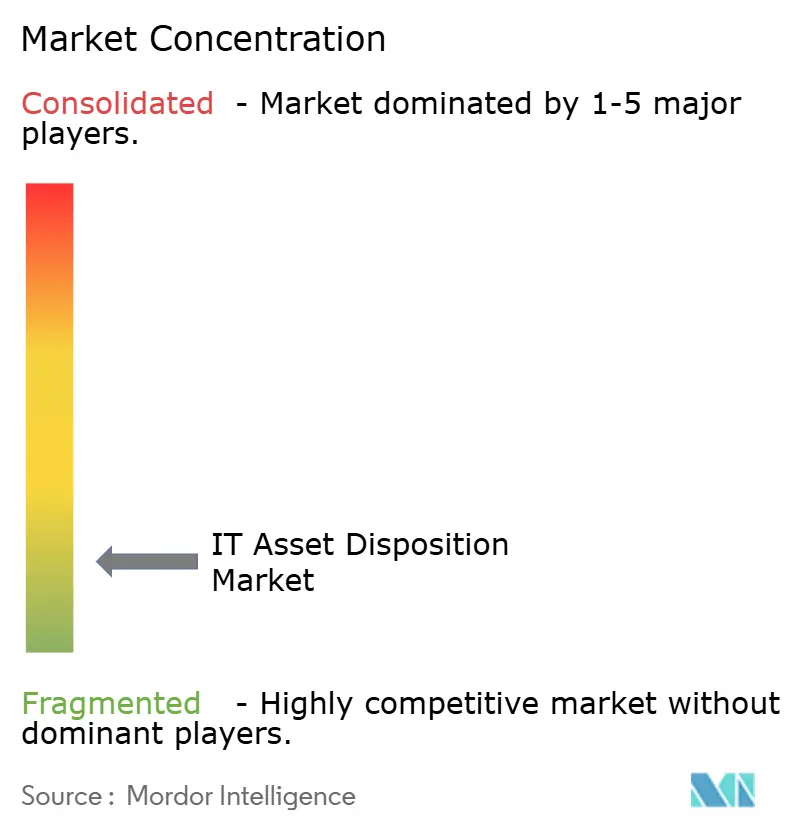
| Market Concentration | Low |
Major Players *Disclaimer: Major Players sorted in no particular order Image © Mordor Intelligence. Reuse requires attribution under CC BY 4.0. | |
IT Asset Disposition Market Analysis by Mordor Intelligence
The IT asset disposition market size is expected to grow from USD 24.4 billion in 2025 to USD 26.46 billion in 2026 and is forecast to reach USD 39.66 billion by 2031 at 8.45% CAGR over 2026-2031. Rising volumes of end-of-life personal computers, rapid AI-ready data-center refresh cycles, and stricter environmental disclosure rules are reshaping the economics of enterprise hardware retirement. Enterprises are compressing refresh intervals from 5-7 years to 3-4 years, which is funneling a steady pipeline of equipment into certified disposition channels. Mandatory Scope 3 carbon reporting under the SEC and CSRD frameworks is pushing CFOs to prioritize auditable asset retirement programs, while Device-as-a-Service contracts are embedding reverse logistics commitments that guarantee predictable asset return volumes. At the same time, hyperscalers are divesting legacy servers to free capital for AI accelerators, catalyzing high-value secondary markets. Together, these forces keep pricing for refurbished hardware attractive even as battery-fire insurance premiums and talent shortages add cost pressure to logistics and data-destruction operations.
Key Report Takeaways
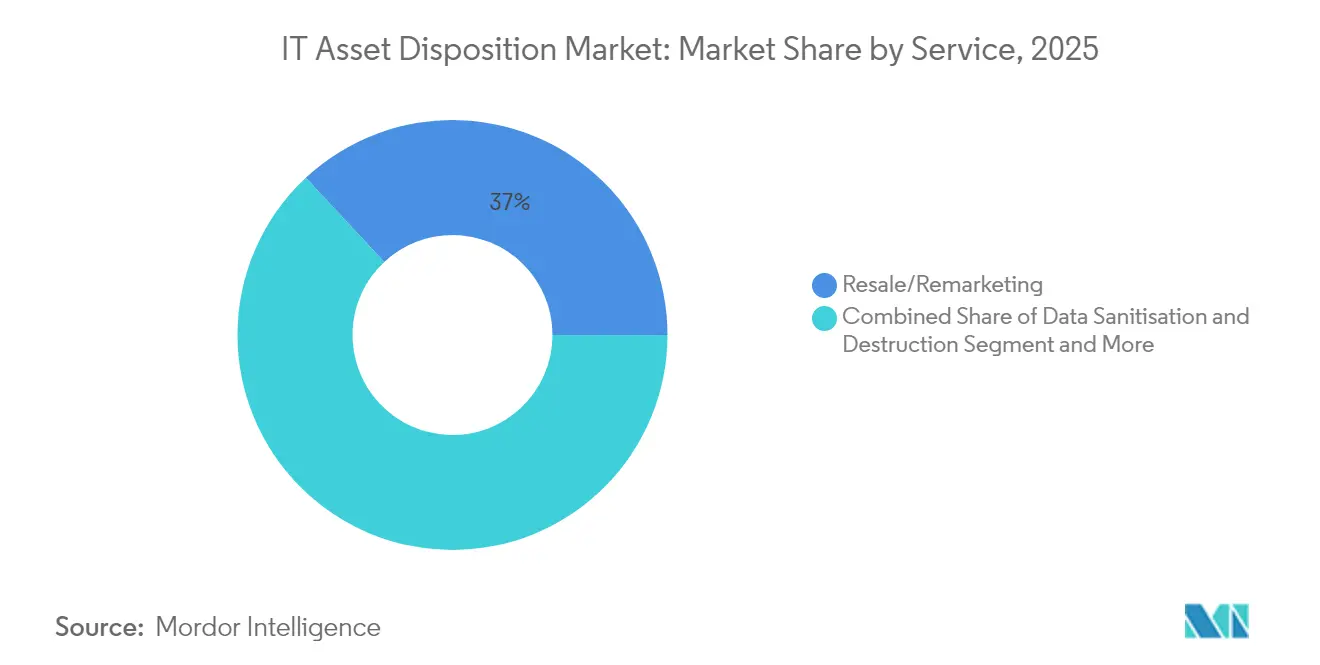
- By service, Resale/Remarketing led with 36.95% revenue share in 2025; Full-Stack Asset Lifecycle Management is forecast to expand at a 12.25% CAGR through 2031.
- By asset type, Desktop/Laptop equipment accounted for 30.45% of the IT asset disposition market share in 2025, whereas server disposition is forecast to grow at a 12% CAGR through 2031.
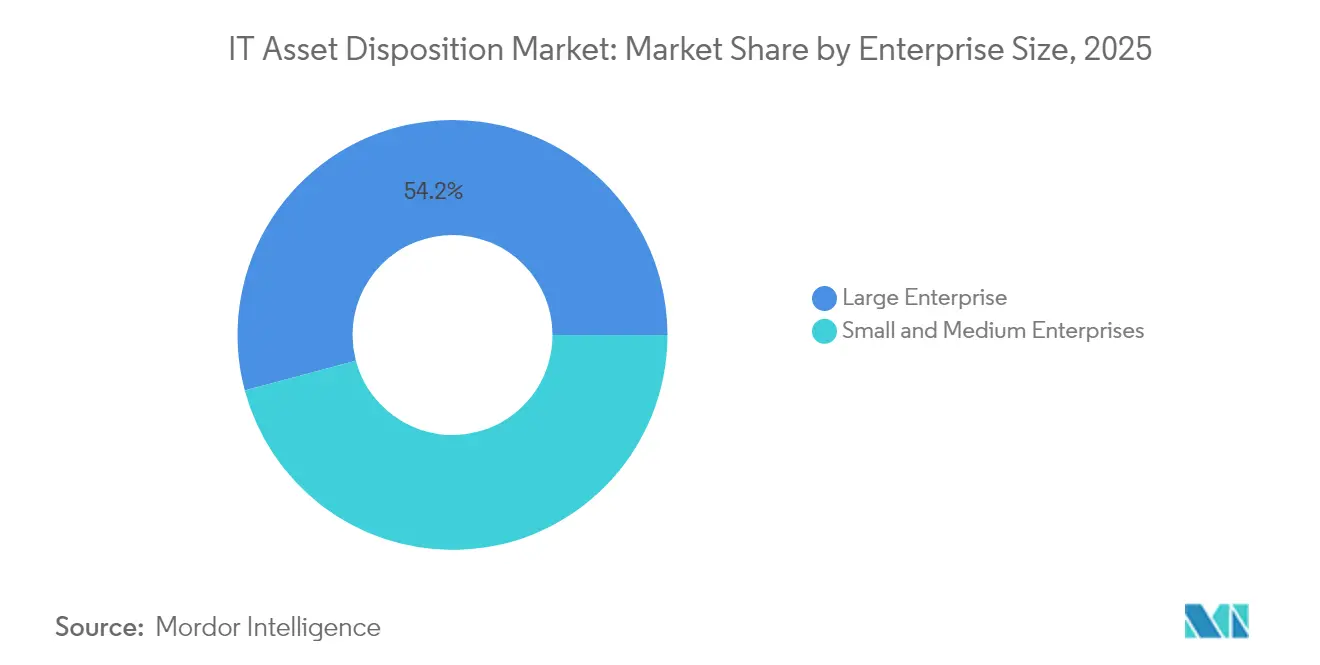
- By enterprise size, Large Enterprises held 54.15% of the overall IT asset disposition market size in 2025, while the SME segment is set to advance at an 10.6% CAGR to 2031.
- By end-user industry, IT & Telecom retained 27.85% of revenue in 2025; Healthcare is expected to pace the field with an 11.1% CAGR through 2031.
- By geography, North America dominated with a 41.35% share in 2025; Asia-Pacific is the fastest-growing region at a 12.8% CAGR.
Note: Market size and forecast figures in this report are generated using Mordor Intelligence’s proprietary estimation framework, updated with the latest available data and insights as of 2026.
Global IT Asset Disposition Market Trends and Insights
Drivers Impact Analysis*
| Driver | (~) % Impact on CAGR Forecast | Geographic Relevance | Impact Timeline |
|---|---|---|---|
| Explosion of AI-ready data-centre refresh cycles | +2.1% | Global, concentrated in North America and APAC | Medium term (2–4 years) |
| Device-as-a-Service contracts embedding reverse-logistics clauses | +1.8% | North America and Europe, expanding to APAC | Long term (≥ 4 years) |
| Mandatory carbon-accounting disclosures (SEC, CSRD) elevating ITAD demand | +1.5% | North America and EU, spill-over to APAC | Short term (≤ 2 years) |
| ESG-linked credit pricing rewarding certified circular-tech practices | +1.2% | Global, led by developed markets | Medium term (2–4 years) |
| Source: Mordor Intelligence | |||
Explosion of AI-ready Data-Centre Refresh Cycles
Compressed refresh intervals for AI-optimized infrastructure are channeling unprecedented hardware volumes into the IT asset disposition market. Enterprises are retiring an estimated 240 million Windows 10 PCs during 2025 as they transition to AI-capable devices, forcing disposition providers to expand capacity while elevating data-sanitization rigor. Data centers generated 61.9 million metric tonnes of e-waste in 2022, yet formal recycling captured only 22.3% of that stream, underscoring a gap that certified vendors are rushing to fill. Microsoft’s investment in Cyclic Materials illustrates the pivot toward rare-earth recovery from retired hard drives, intertwining data security with advanced materials extraction. Providers able to integrate shredding, degaussing, and precision metals separation now command premium margins. As AI workloads proliferate, demand for server-grade GPUs will further compress server refresh timelines, sustaining long-run growth for the IT asset disposition market.
Device-as-a-Service Contracts Embedding Reverse-Logistics Clauses
DaaS models shift end-of-life obligations from buyers to vendors, guaranteeing certified take-back pathways and stabilizing disposition volumes. The 2025 Cascade Asset Management survey of 55 enterprises reported that 34% of respondents embed ESG benchmarks in IT procurement, up from 18% two years earlier. [1]Cascade Asset Management, “2025 ITAD Benchmarking Report,” Cascade-Assets.com Large, distributed workforces rely on courier-based pick-up and validated chain-of-custody tracking, which is prompting disposition firms to invest in geofenced scheduling software and tamper-evident packaging. Standardized return clauses reduce leakage into grey markets and improve forecasting for remarketing channels. Over the long term, embedded reverse logistics is expected to normalize re-commerce flows, underpinning price stability for refurbished laptops and smartphones in the IT asset disposition market.
Mandatory Carbon-Accounting Disclosures Elevating ITAD Demand
Scope 3 reporting rules require granular accounting of downstream hardware retirement, driving enterprises to pick vendors that can provide auditable lifecycle data. Apple diverted 40,000 metric tons of scrap to certified recyclers in 2024 and achieved product-level carbon neutrality on the Mac mini via 50% recycled content, setting a benchmark for asset disposition transparency. SEC disclosure guidelines scheduled for phased enforcement in 2026 already motivate Fortune 500 boards to formalize ITAD audit trails. Vendors offering blockchain-secured certificates and automated CO₂-equivalent calculators are landing multi-year master agreements, reinforcing the structural expansion of the IT asset disposition market.
ESG-Linked Credit Pricing Rewarding Certified Circular-Tech Practices
Banks are tying interest-rate spreads to verified reuse and recycling metrics. ERI processed 123.98 million pounds of electronics in 2023 while preventing 675 million pounds of CO₂ emissions, a data trail that qualified several clients for discounted sustainability-linked loans in 2024. As the cost of capital becomes contingent on demonstrable circularity, companies treat disposition documentation as a credit-rating input rather than a compliance formality. This incentive alignment broadens buyer focus from pure data security to holistic lifecycle optimization, further deepening revenue pools for the IT asset disposition market.
Restraints Impact Analysis*
| Restraint | (~) % Impact on CAGR Forecast | Geographic Relevance | Impact Timeline |
|---|---|---|---|
| Fragmented global chain-of-custody standards | -1.4% | Global, particularly affecting cross-border operations | Medium term (2–4 years) |
| Talent shortages in certified data-destruction operatives | -1.1% | Global, acute in developed markets | Short term (≤ 2 years) |
| Battery-fire insurance premiums for logistics providers | -0.8% | Global, concentrated in regions with strict liability laws | Short term (≤ 2 years) |
| Growing grey-market exports driving price compression | -0.6% | Global, particularly affecting developing markets | Medium term (2–4 years) |
| Source: Mordor Intelligence | |||
Fragmented Global Chain-of-Custody Standards
Multinational corporations often wrestle with conflicting national rules on waste classification, shipment permits, and data-destruction attestations. The European Round Table for Industry catalogued more than 100 regulatory barriers hampering cross-border e-waste flows in 2025, including diverging lithium-ion battery transit requirements. Basel Convention amendments effective January 2025 now obligate exporters to secure prior informed consent for many e-scrap categories, prolonging transit times and elevating administrative overhead. Disposition firms with multinational footprints absorb these costs through compliance departments, but smaller specialists lose margin or cede business, tempering overall IT asset disposition market growth.
Talent Shortages in Certified Data-Destruction Operatives
The supply of NAID AAA-qualified technicians has lagged demand, particularly in healthcare and finance, where solid-state drive encryption and HIPAA rules heighten disposal complexity. Data-breach costs in U.S. hospitals averaged USD 10.93 million in 2024, making certified destruction non-negotiable. [2]Synetic Technologies, “Mitigating Financial and Reputational Risk,” SyneticTechnologies.com Wage inflation for field engineers and plant supervisors is running 9-12% annually in major metros, eroding gross margins. Automation can shred drives, but chain-of-custody validation and mobile onsite purging still depend on human oversight, constraining capacity in the IT asset disposition market.
*Our forecasts treat driver/restraint impacts as directional, not additive. The impact forecasts reflect baseline growth, mix effects, and variable interactions.
Segment Analysis
By Service: Full-Stack ALM Gains Momentum
Resale and remarketing captured 36.95% of 2025 revenue, anchoring the IT asset disposition market through predictable secondary-device demand. Yet the fast-growing Full-Stack Asset Lifecycle Management suite is posting a 12.25% CAGR that will lift its contribution within the overall IT asset disposition market size over the forecast period. Enterprises are bundling procurement, maintenance, and disposition under a single master service agreement to simplify compliance and unlock residual-value insights early in the buying cycle.
Full-stack programs integrate asset tagging at deployment, firmware erasure at retirement, and materials reclamation for critical minerals such as neodymium. Providers that combine real-time inventory portals, certified logistics, and downstream refining partnerships can defend pricing, even as pure-play resale margins commoditize. This integrated stance blurs the line between ITAD and managed services, deepening stickiness in the IT asset disposition market.


By Asset Type: Server Disposition Accelerates
Desktop and laptop devices held 30.45% of the IT asset disposition market share in 2025 due to persistent enterprise mobility refreshes. However, server volumes are slated to expand at a 12% CAGR, enlarging their slice of the IT asset disposition market size as hyperscalers replace x86 racks with GPU-dense nodes. Rack-scale retirements favor on-site shredding and serialized component tracking, elevating logistics complexity.
Blades housing AI accelerators fetch a premium in secondary markets, encouraging meticulous cosmetic handling to maximize resale value. The convergence of storage, compute, and networking within hyper-converged infrastructure also raises the technical bar for disposition specialists. Firms capable of separating solid-state drives for secure erasure while harvesting heat-sink copper are best positioned to capture upside in the IT asset disposition market.
By Enterprise Size: SME Adoption Accelerates
Large enterprises contributed 54.15% of total revenue in 2025, reflecting their global asset footprints and multi-regulation exposure. Yet SME uptake is climbing at an 10.6% CAGR, adding breadth to the IT asset disposition industry. Cloud-based portals and templated compliance reports allow small firms to satisfy customer audits without dedicated asset-management staff.
Vendor financing arms package per-device disposition into monthly device lease fees, easing cash-flow hurdles for growing firms. As more supply-chain contracts demand verifiable e-waste practices, SME penetration will diversify volume sources for the IT asset disposition market and mitigate reliance on a handful of megadeployers.
By End-user Industry: Healthcare Leads Growth
IT and Telecom firms maintained 27.85% of 2025 revenue, but healthcare’s 11.1% CAGR sets the growth pace. That trajectory will widen healthcare’s share of the IT asset disposition market size for regulated data-bearing hardware. Post-quantum cryptography upgrades in imaging systems and electronic health record servers accelerate refresh cycles, while HIPAA penalties incentivize certified chain-of-custody protocols.
Pharmaceutical labs also view end-of-life hardware as a source of recoverable platinum from test equipment, dovetailing security with sustainability. As telemedicine proliferates, edge devices in clinics and home monitoring kits will feed new streams into the IT asset disposition market.
Geography Analysis
North America retained a 41.35% revenue stake in 2025, underpinned by SEC climate disclosures, mature secondary-hardware channels, and entrenched certification protocols such as R2v3. Government contracts accessed through distributors like Carahsoft ensure predictable federal demand, keeping utilization rates high for shredding plants in Texas, Ohio, and Ontario.
Europe leverages CSRD and WEEE legislation to enforce circular-economy targets, making documentation depth a competitive differentiator. Regulatory heterogeneity across the bloc heightens compliance costs but also invites premium pricing for vendors that can navigate multi-language audit regimes. Basel Convention export revisions add administrative layers for cross-channel flows, favoring disposition firms with local processing capacity in Germany, France, and the Nordics.
Asia-Pacific is expanding at a 12.8% CAGR, reflecting digital government programs and booming hyperscale investments. SK Tes’s joint venture with VSD Holdings will open a Hanoi plant by early 2026, underlining Southeast Asia’s shift from collection to full processing. Chinese Extended Producer Responsibility rules and India’s e-Waste (Management) Amendment impel OEMs to prove domestic recycling, presenting an entry path for global ITAD brands through licensed local partnerships. Together these dynamics diversify revenue for the IT asset disposition market and hedge currency risk.

Competitive Landscape
The market is moderately fragmented; the top five vendors command an estimated 25-35% of combined global revenue, leaving room for regional specialists. Iron Mountain exploits its archival heritage to bundle physical records storage with device destruction and has partnered with Carahsoft to tap federal channels. [3]Iron Mountain, “Iron Mountain Partners with Carahsoft,” IronMountain.com Dell Technologies integrates take-back into client device sales, leveraging its OEM scale to subsidize logistics. Sims Lifecycle Services focuses on hyperscaler infrastructure, securing multi-year contracts for server remarketing.
Consolidation is gaining momentum: Closed Loop Partners took a majority stake in Sage Sustainable Electronics in 2023, and Sage acquired Relectro in 2024 to strengthen its European footprint. Vertical integration appears in HPE Pointnext services, which fold ITAD into enterprise support agreements, safeguarding customer touchpoints and residual-value capture.
Technology investment is another battleground. Cyclic Materials’ CC360™ rare-earth extraction has attracted Microsoft funding, giving participating ITAD vendors a value-added metals stream. Automation, computer vision for cosmetic grading, and blockchain audit trails are now table stakes for enterprise RFPs, raising capital thresholds for newcomers but improving scalability across the IT asset disposition market.
IT Asset Disposition Industry Leaders
Iron Mountain
Dell Technologies
Sims Lifecycle Services
Hewlett Packard Enterprise
Cascade Asset Management
- *Disclaimer: Major Players sorted in no particular order

Recent Industry Developments
- March 2025: SK Tes announced an ITAD factory in Hanoi, Vietnam, via a partnership with VSD Holdings, reinforcing certified capacity in Southeast Asia.
- October 2024: Sage Sustainable Electronics acquired Relectro, broadening European service reach.
- July 2024: Microsoft invested in Cyclic Materials to advance rare-earth recovery from hard drives.
- May 2024: Iron Mountain partnered with Carahsoft to expand ITAD solutions for U.S. government agencies.


Research Methodology Framework and Report Scope
Market Definitions and Key Coverage
Our study defines the IT Asset Disposition (ITAD) market as all certified services that physically remove, sanitize, refurbish, resell, recycle, or otherwise retire end-of-life enterprise IT hardware, including end-user devices, data-center equipment, and edge networking gear, while maintaining verifiable chain-of-custody and data-destruction records.
Scope exclusion: Consumer drop-off e-waste programs that lack documented data-security processes fall outside Mordor Intelligence's market boundaries.
Segmentation Overview
- By Service
- Data Sanitisation and Destruction
- Resale / Remarketing
- Recycling and Material Recovery
- Reverse Logistics and Warehousing
- Full-Stack Asset Lifecycle Management
- By Asset Type
- Desktop / Laptop
- Mobile Devices
- Servers
- Storage Devices
- Networking and Edge Equipment
- Others
- By Enterprise Size
- Large Enterprises
- Small and Medium Enterprises
- By End-user Industry
- BFSI
- IT and Telecom
- Healthcare
- Government and Public Institutions
- Industrial and Energy
- Education and Others
- By Geography
- North America
- United States
- Canada
- Europe
- Germany
- United Kingdom
- France
- Rest of Europe
- Asia-Pacific
- China
- Japan
- India
- South Korea
- Rest of Asia-Pacific
- South America
- Brazil
- Rest of South America
- Middle East and Africa
- Middle East
- GCC
- Turkey
- Africa
- South Africa
- Rest of Africa
- North America
Detailed Research Methodology and Data Validation
Primary Research
Our team supplements desk findings through structured conversations with certified ITAD providers, data-center integrators, and enterprise asset managers across North America, Europe, and Asia-Pacific. These interviews clarify prevailing asset resale discounts, emerging regulatory pinch points, and the practical share of devices receiving on-site versus off-site destruction, allowing us to tighten uncertain desk-based assumptions.
Desk Research
Mordor analysts begin with published data from authorities such as the United Nations' e-Waste Monitor, the US EPA, Eurostat, and Environment Canada, which outline disposal volumes, recovery rates, and regulatory timelines. Trade groups like the Information Technology Industry Council and the Basel Action Network provide insights on certification uptake, while corporate 10-Ks, sustainability filings, and press coverage supply device refresh cadences and asset pools. Subscription resources, including D&B Hoovers for corporate fleet sizes and Dow Jones Factiva for secure-destruction contract wins, add further context.
A second desk pass benchmarks tonnage flows visible in customs codes against reported recovery output, helping us flag geographic under-reporting. The sources cited are illustrative only; many additional public and paid references support data gathering, validation, and gap resolution.
Market-Sizing & Forecasting
We start with a top-down reconstruction of global retired hardware tonnage using production, import-export, and corporate fleet replacement intervals, which are then converted to value by applying region-specific penetration rates for professional ITAD services and sampled average selling prices. Select bottom-up checks, such as supplier roll-ups and channel invoices, validate and adjust totals. Key variables include device refresh cycles, certified processor penetration, resale discounts, metals recovery yields, regulatory enforcement intensity, and enterprise ESG disclosure adoption. A multivariate regression model, complemented by scenario analysis where legislation is pending, produces the 2025-2030 outlook.
Data Validation & Update Cycle
Outputs face variance checks against external disposal volumes, resale price indices, and insurance claim frequencies before senior analyst sign-off. Reports refresh each year, with interim revisions triggered by material events such as major legislation or hyperscale refresh spikes; a final pre-delivery sweep ensures clients view the latest insight.
Why Mordor's IT Asset Disposition Market Baseline Commands Unmatched Decision-readiness
Published values often diverge because firms pick different service scopes, price erosion curves, and refresh cadences.
Gap drivers typically include counting internal redeployments as 'disposition,' converting refurbished units at book instead of realized prices, or extrapolating global totals from single-region samples. Our model, anchored in certified service penetration and cross-checked resale discounts, avoids these pitfalls.
Benchmark comparison
| Market Size | Anonymized source | Primary gap driver |
|---|---|---|
| USD 24.45 B | Mordor Intelligence | - |
| USD 28.32 B | Global Consultancy A | Includes leased assets returned but not processed by certified ITAD providers |
| USD 18.61 B | Trade Journal B | Uses constant ASPs and omits data-center server streams |
In sum, because our scope mirrors certification boundaries, our variables mirror real contract economics, and our cadence mirrors actual refresh cycles, Mordor Intelligence delivers a balanced, transparent baseline that decision-makers can retrace and replicate with confidence.


Key Questions Answered in the Report
What is the current value of the IT asset disposition market?
The sector stands at USD 26.46 billion in 2026 and is projected to reach USD 39.66 billion by 2031.
Which service category is expanding the fastest?
Full-Stack Asset Lifecycle Management is growing at a 12.25% CAGR as enterprises favor integrated, end-to-end solutions.
Why is server disposition outpacing other asset types?
Hyperscalers are retiring traditional x86 racks in favor of AI-optimized systems, pushing server disposition volumes to a 12% CAGR.
How do SEC and CSRD rules influence ITAD demand?
Both frameworks compel companies to report Scope 3 emissions, prompting greater use of certified ITAD providers that can document carbon impacts.
What regions offer the highest growth potential?
Asia-Pacific is forecast to lead with a 12.8% CAGR thanks to rapid digitalization and evolving e-waste regulations.
How fragmented is the competitive landscape?
The top five players hold less than one-third of global revenue, giving smaller, specialized providers room to expand.
Page last updated on:


