Irrigation Automation Market Size and Share
Market Overview
| Study Period | 2020 - 2030 |
|---|---|
| Market Size (2025) | USD 7.20 Billion |
| Market Size (2030) | USD 12.40 Billion |
| Growth Rate (2025 - 2030) | 11.50% CAGR |
| Fastest Growing Market | Middle East |
| Largest Market | North America |
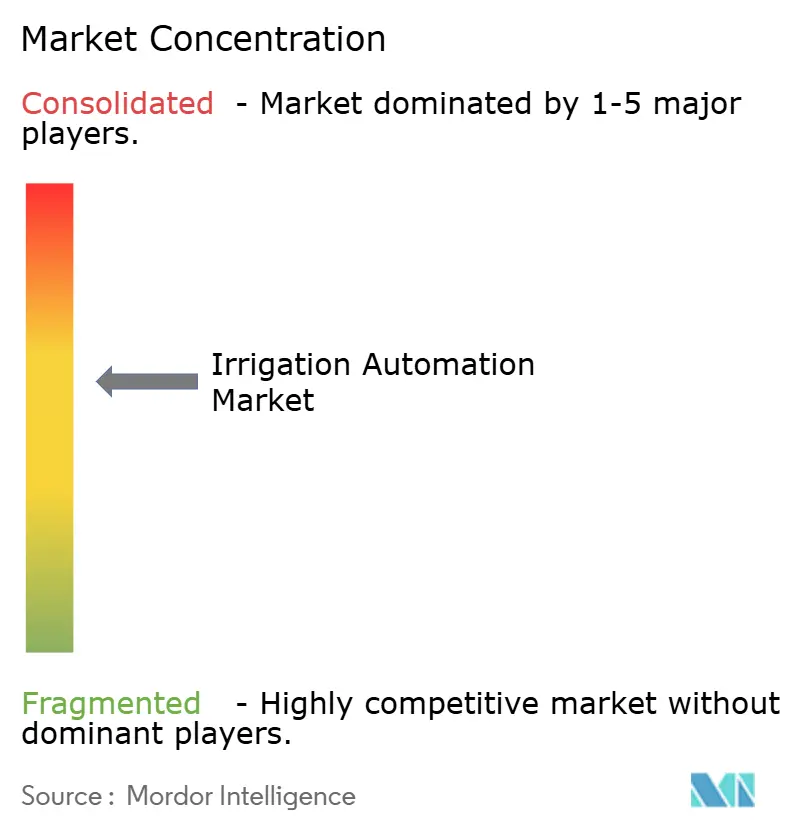
| Market Concentration | Medium |
Major Players *Disclaimer: Major Players sorted in no particular order Image © Mordor Intelligence. Reuse requires attribution under CC BY 4.0. | |

Irrigation Automation Market Analysis by Mordor Intelligence
The irrigation automation market size reached USD 7.2 billion in 2025 and is projected to climb to USD 12.4 billion by 2030, translating into an 11.5% CAGR over the forecast period. This expansion rests on three pillars. The first one is intensifying water-scarcity pressures, the second is accelerating precision-agriculture adoption, and the last one is the rapid maturation of IoT-enabled control platforms. Subsidy programs such as the USDA’s USD 400 million drought-mitigation package announced in August 2024 are lowering upfront costs for growers and expanding the addressable market.[1]United States Department of Agriculture, “Biden-Harris Administration Invests USD 400 Million in Western Drought Response,” usda.gov Real-time sensor networks, predictive analytics, and cloud-based dashboards now enable acre-by-acre water dosing, reducing waste, easing labor shortages, and supporting compliance with tightening conservation mandates. Component suppliers are pairing controllers with machine-learning algorithms that cut water use by up to 30%, while large original-equipment manufacturers (OEMs) pursue consolidation to capture scale benefits in R&D and distribution. Middle East water stress, Asia-Pacific mechanization drives, and the United States' climate-driven policy all reinforce a robust demand outlook across both rain-fed and irrigated production systems.
Key Report Takeaways
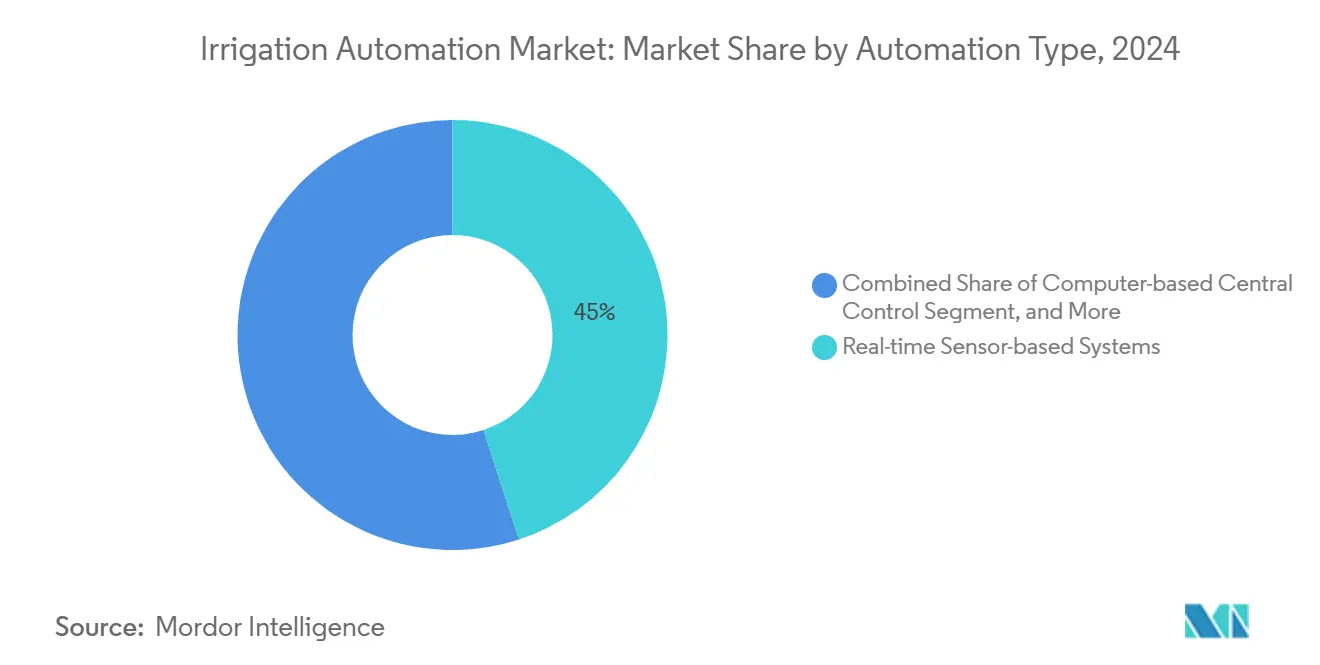
- By automation type, real-time sensor-based systems led with 45% of the irrigation automation market size in 2024, and computer-based central control recorded the fastest 18.5% CAGR through 2030.
- By component, controllers accounted for 35% of 2024 revenues, while sensors advanced at a 17.2% CAGR, reflecting deeper IoT penetration.
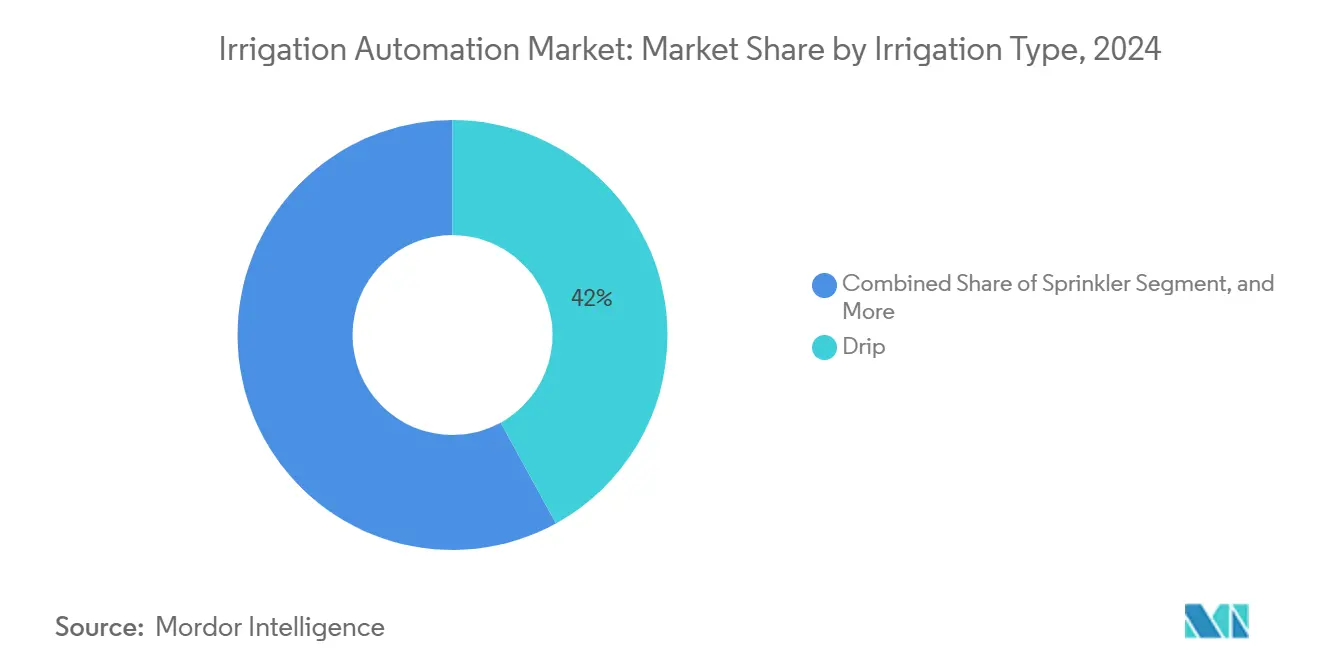
- By irrigation type, drip solutions held 42% of the irrigation automation market size in 2024, and sub-surface drip is forecast to grow at a 16.8% CAGR to 2030.
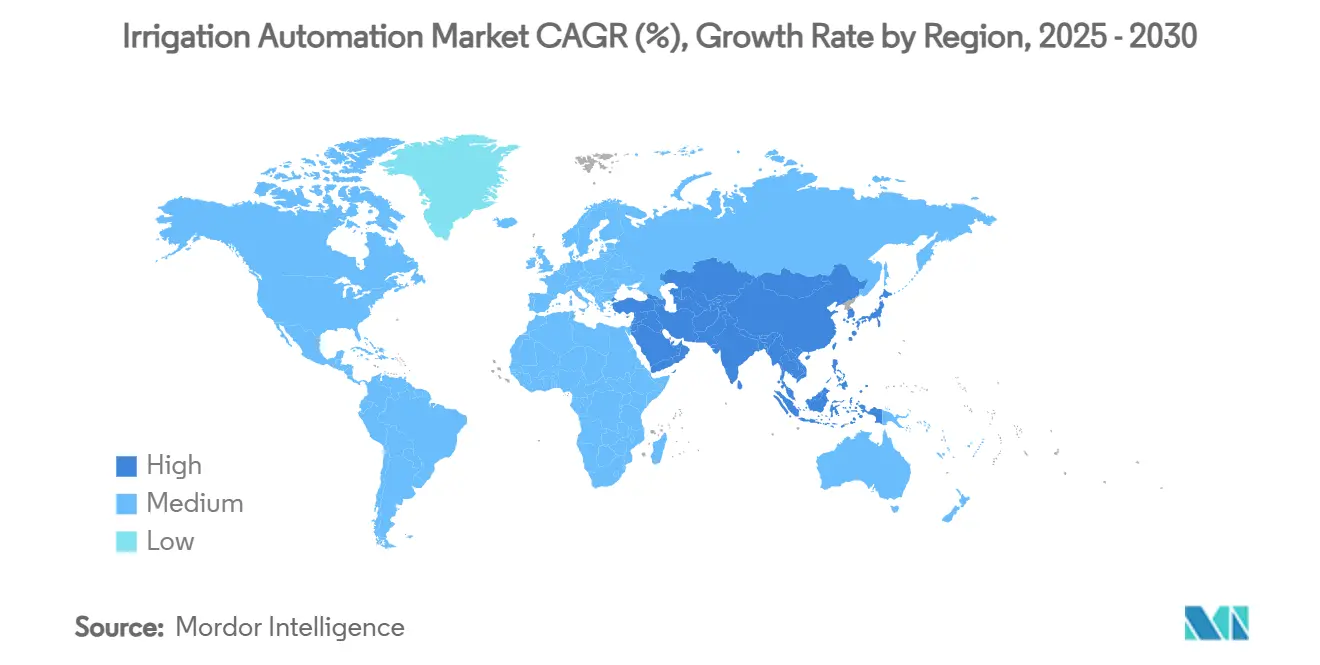
- By geography, North America captured 32% of the 2024 revenue, while the Middle East is projected to register the highest 22.5% CAGR through 2030.
- By company concentration, The Toro Company, Netafim, Valmont Industries, Jain Irrigation Systems, and Lindsay Corporation jointly commanded more than 50% of 2024 revenue, signaling moderate consolidation.
Global Irrigation Automation Market Trends and Insights
Drivers Impact Analysis*
| Driver | (~) % Impact on CAGR Forecast | Geographic Relevance | Impact Timeline |
|---|---|---|---|
| Government subsidies for water-efficient irrigation technologies | +2.1% | North America and EU | Medium term (2-4 years) |
| Rising global water scarcity and conservation mandates | +2.8% | Middle East, Australia, and California | Long term (≥ 4 years) |
| Adoption of precision agriculture and IoT platforms | +2.3% | North America, Europe, and Asia-Pacific | Medium term (2-4 years) |
| Labor shortages accelerating farm mechanization | +1.9% | North America, Europe, and Australia | Short term (≤ 2 years) |
| Carbon-credit monetization for water-saving practices | +1.2% | EU, California, and Asia-Pacific | Long term (≥ 4 years) |
| Insurance discounts linked to automated-irrigation data | +0.8% | North America, and Europe | Medium term (2-4 years) |
| Source: Mordor Intelligence | |||
Government Subsidies for Water-Efficient Irrigation Technologies
Targeted subsidy programs are rapidly lowering adoption barriers across the market. The USDA’s USD 400 million drought-mitigation program subsidizes equipment upgrades on 250,000 acres and could save 50,000 acre-feet of water annually. India’s PM-KUSUM covers up to 60% of solar-pump capital costs, accelerating pump adoption among smallholders. Across the European Union, members that reimburse at least 40% of capital expenditure are recording 15–20% faster uptake. Direct cash rebates have proven more effective than tax credits because they improve growers’ cash flow immediately, a critical factor for small and midsize operations. Collectively, these incentives create an artificial elasticity that brings precision irrigation within reach of smaller farms and accelerates the penetration of sensors, controllers, and connected valves.
Rising Global Water Scarcity and Conservation Mandates
Irrigation now consumes roughly 70% of global freshwater withdrawals, making efficiency a regulatory imperative.[2]Ministry for the Environment New Zealand, “Global Freshwater Use Statistics,” mdpi.com California’s 2024 allocation limits reduced farm allotments to 75% of historical averages, triggering a sharp pivot toward high-frequency, sensor-controlled systems that deliver unit-level water savings. In the Middle East, aquifer depletion and desalination costs are driving adoption of Israeli-engineered drip technologies across Saudi Arabia, the United Arab Emirates, and Jordan. Australia’s Murray-Darling Basin trading scheme rewards growers who can verify water-use reductions through automated monitoring. Because regulatory reporting increasingly mandates real-time data, automated irrigation systems double as compliance tools, further enlarging the market.
Adoption of Precision Agriculture and IoT Platforms
Modern farms are interlinking irrigation, nutrient management, and crop-health analytics on common digital backbones. Trimble and AGCO launched the PTx Trimble venture in 2025 to embed irrigation data into broader agronomic decision-support suites. Edge-powered controllers now ingest soil-moisture readings, satellite imagery, and weather forecasts to produce zone-specific schedules that cut water use while boosting yields. Cloud dashboards accessible via mobile apps enable operators to adjust pumps, valves, and fertigation injectors in real time, shrinking operational downtime and supporting multi-site oversight. As broadband connectivity spreads to rural regions, original-equipment manufacturers (OEMs) are pivoting toward recurring-revenue software models that bundle analytics, support, and over-the-air updates.
Labor Shortages Accelerating Farm Mechanization
Persistent labor gaps, seasonal vacancies reached 30% in many U.S. specialty-crop regions during 2025, making automation a cost-containment priority. Automated irrigation reduces manual scheduling labor by 60–80%, while remote alarms and leak detection further reduce site visits. The Toro Company’s 2025 acquisition of Rain Master expands its central controller portfolio, highlighting the strategic value of labor-saving hardware paired with intuitive software. Short payback periods of two to three years make automated irrigation an attractive hedge against both wage inflation and worker scarcity.
Restraints Impact Analysis*
| Restraint | (~) % Impact on CAGR Forecast | Geographic Relevance | Impact Timeline |
|---|---|---|---|
| High upfront capital expenditure | −1.8% | Emerging markets worldwide | Short term (≤ 2 years) |
| Limited technical expertise among smallholders | −1.3% | Asia-Pacific, Africa, and South America | Medium term (2-4 years) |
| Cyber-security vulnerabilities in connected devices | −0.9% | North America, and Europe | Medium term (2-4 years) |
| Sensor-calibration drift undermining trust | −0.7% | Global | Short term (≤ 2 years) |
| Source: Mordor Intelligence | |||
High Upfront Capital Expenditure
Complete sensor-rich systems cost USD 1,500–4,000 per acre, dwarfing the USD 300–800 required for conventional setups. Access to credit is tight in markets where average farm sizes run 2–5 acres. Manufacturers are responding with lease-to-own and performance-based contracts, but donor-funded concessionary loans remain essential for early adoption in Sub-Saharan Africa. Even in developed economies, automation budgets compete against machinery and input-cost inflation, slowing the conversion of legacy pivots or flood systems.
Limited Technical Expertise Among Smallholders
IoT gateways, firmware updates, and data analytics dashboards require skill sets rare among smallholder communities. Netafim has expanded on-farm clinics and multilingual training portals across India to close this knowledge gap. Simplified user interfaces and AI-guided troubleshooting are emerging, yet a digital divide persists where mobile coverage and electrical grids remain unreliable.
*Our forecasts treat driver/restraint impacts as directional, not additive. The impact forecasts reflect baseline growth, mix effects, and variable interactions.
Segment Analysis
By Automation Type: Sensors Drive Real-Time Precision
Real-time sensor-based systems held a 45% of the irrigation automation market sizein 2024, indicating growers' preference for data-rich scheduling. Computer-based central control, although smaller today, is projected to show an 18.5% CAGR through 2030 as large farms integrate irrigation into their whole-farm management suites. Time-based systems remain popular among cost-sensitive producers, while volume-based deployments serve niche markets in protected agriculture. Continuous monitoring shortens decision cycles, enabling variable-rate fertigation and early leak detection, which further differentiates high-automation installations.
Second-generation sensor networks incorporate multi-depth probes, canopy-temperature cameras, and on-board analytics to issue predictive alerts before plant stress becomes visually apparent. Wireless protocols, ranging from LoRa to private LTE, extend connectivity deep into fields that were previously unreachable by Wi-Fi. Environmental data interoperability with weather forecast APIs enables dashboards to defer irrigation ahead of forecasted rainfall, a capability that can reduce seasonal withdrawals by up to 25%. As the 5G roll-out advances, bandwidth-intensive edge analytics and real-time video further enrich agronomic insights, sustaining growth momentum in this automation tier.


By Component: Controllers Lead While Sensors Surge
Controllers accounted for 35% of the irrigation automation market size in 2024 and remain the core of the hardware segment. These devices have evolved from simple timers into multi-zone hubs that manage pumps, valves, fertigation tanks, and data logging. Sensors, which represent 22% of revenue, recorded the fastest 17.2% CAGR and are on track to narrow the gap as soil moisture, pressure, and weather nodes proliferate. Valves and actuators account for 20%, while communication modules and flow meters each account for around 10%.
Software-subscription revenue now accompanies most new hardware sales. Original-equipment manufacturers (OEMs) bundle predictive algorithms and remote-service packages, generating annual recurring revenue streams that stabilize cash flow. Wireless retrofit kits, offering battery-powered sensors and cellular gateways, unlock new sales among farms unwilling to trench power or data lines. Integration with carbon-tracking dashboards and insurance portals adds still more stickiness to controller- and sensor-centric ecosystems, reinforcing market-share leadership among early digital adopters.
By Irrigation Type: Drip Dominance with Subsurface Innovation
Drip lines delivered 42% of 2024 revenue, underscoring the technology’s efficiency profile and its entrenched position within orchard, vineyard, and vegetable systems. Subsurface drip, although just 10% of installations, is growing at 16.8% CAGR because it reduces evaporation and mitigates disease by keeping foliage dry. Sprinkler systems, spanning fixed-set and center-pivot formats, supply water to large commodity-crop acreages and hold roughly 30% revenue share. Pivot and lateral-move technology maintains relevance in broadacre geographies with uniform topography.
Emerging pressure-compensating emitters improve uniformity on long runs and undulating terrain, while anti-clogging materials extend maintenance intervals. Hybrid systems that pair surface drip on annual crops with subsurface lines on perennials allow growers to tailor capex to cash-flow profiles. Pivot-mounted variable-rate sprinklers now interface with soil-mapping data to deliver zone-specific application rates, narrowing the efficiency gap with drip in regions where large land parcels dominate.
Geography Analysis
North America retained 32% of 2024 revenue, reflecting large commercial acreages, mature dealer networks, and robust public-finance support. The USDA drought-mitigation program, targeting 250,000 acres, catalyzes controller and sensor upgrades, while Californian groundwater restrictions boost demand for high-frequency scheduling tools. Original-equipment manufacturers (OEMs) report that over half of new pivot sales now include telemetry modules, and retrofit demand remains strong as legacy systems age. The market share among hardware suppliers is consolidating as dealers acquire small installers to offer bundled agronomy and service contracts.
The Middle East delivered the fastest 22.5% CAGR through 2030. Israel’s technology exports anchor growth, with Netafim’s drip expertise adopted across Saudi mega-projects and UAE greenhouse clusters. Valmont won a USD 100 million lateral-move contract in the region in 2024, its largest ever, evidencing government preference for proven, scalable solutions. Aquifer depletion and desalination energy costs drive policy incentives that reimburse up to 70% of automation expenditure, narrowing payback periods and accelerating demand.
Asia-Pacific accounted for a significant revenue share in 2024. India’s PM-KUSUM grants have shifted solar-pump uptake into higher gear, coupling energy independence with automated scheduling. Chinese modernization programs incorporate irrigation analytics in “digital village” blueprints, urging local governments to co-fund controller networks on staple crops such as rice and corn. Smallholder fragmentation remains a challenge.

Competitive Landscape
The automated irrigation market is moderately consolidated. The top five suppliers, The Toro Company, Netafim (Orbia Advance Corp.), Valmont Industries, Inc., Jain Irrigation Systems Ltd. (Rivulis Irrigation Ltd.), and Lindsay Corporation, controlled more than 50% of 2024 revenue. Strategic acquisitions accelerated as original-equipment manufacturers (OEMs) sought analytic capabilities: Valmont’s USD 300 million Prospera deal bolstered its machine-vision suite, while Toro’s Rain Master purchase expanded central-controller depth.[3]Valmont Industries, “Valmont to Acquire Prospera for USD 300 Million,” valmont.com Netafim partnered with Phytech to merge plant-stress analytics with drip expertise, creating an end-to-end precision platform.
Platform consolidation is reshaping competitive moats. Valmont unified AgSense, Valley 365, PrecisionKing, and PivoTrac under AgSense 365 in March 2025, promising a single sign-on interface for pumps, pivots, and moisture probes. Toro is experimenting with subscription tiers that bundle weather credits and leak insurance, while Jain Irrigation and Rivulis are integrating drip hardware portfolios following their merger. White-space opportunities remain in low-cost sensor nodes and pay-as-you-go financing models aimed at smallholders. In response, multinationals are piloting micro-leasing schemes and smartphone-only dashboards.
Emerging competition comes from satellite-powered analytics firms that overlay evapotranspiration maps onto controller schedules, potentially disintermediating hardware-centric models. Original-equipment manufacturers (OEMs) are forming API alliances to guard against lock-out and maintain hardware relevance. Cybersecurity investment has surged as ransomware threats grow, and vendors now emphasize encrypted controllers and firmware-over-cellular updates as key differentiators.
Irrigation Automation Industry Leaders
Lindsay Corporation
Valmont Industries, Inc.
The Toro Company
Netafim (Orbia Advance Corp.)
Jain Irrigation Systems Ltd. (Rivulis Irrigation Ltd.)
- *Disclaimer: Major Players sorted in no particular order

Recent Industry Developments
- December 2024: Phytech partnered with Rivulis and Netafim to integrate real-time plant monitoring with drip hardware.
- October 2024: Orbia Netafim and Phytech launched a joint precision-irrigation initiative embedding Phytech analytics into the GrowSphere OS.
- September 2024: Netafim launched GrowSphere, a cloud-based platform designed to automate irrigation and fertigation scheduling. The platform enables precise water and nutrient management by integrating real-time data and advanced analytics. It supports farmers in optimizing crop yields, improving resource efficiency, and reducing operational costs through automated and data-driven decision-making processes.


Global Irrigation Automation Market Report Scope
| Time-based Systems |
| Volume-based Systems |
| Real-time Sensor-based Systems |
| Computer-based Central Control |
| Controllers |
| Sensors |
| Valves and Actuators |
| Flow Meters |
| Communication Modules |
| Software and Services |
| Sprinkler |
| Drip |
| Surface/Furrow |
| Pivot and Lateral-move |
| Subsurface Drip |
| North America | United States |
| Canada | |
| Mexico | |
| Rest of North America | |
| South America | Brazil |
| Argentina | |
| Rest of South America | |
| Europe | Germany |
| United Kingdom | |
| France | |
| Italy | |
| Spain | |
| Russia | |
| Rest of Europe | |
| Asia-Pacific | China |
| India | |
| Japan | |
| South Korea | |
| Australia | |
| New Zealand | |
| Rest of Asia-Pacific | |
| Middle East | Turkey |
| Saudi Arabia | |
| United Arab Emirates | |
| Israel | |
| Rest of Middle East | |
| Africa | South Africa |
| Egypt | |
| Rest of Africa |
| Automation Type | Time-based Systems | |
| Volume-based Systems | ||
| Real-time Sensor-based Systems | ||
| Computer-based Central Control | ||
| Component | Controllers | |
| Sensors | ||
| Valves and Actuators | ||
| Flow Meters | ||
| Communication Modules | ||
| Software and Services | ||
| Irrigation Type | Sprinkler | |
| Drip | ||
| Surface/Furrow | ||
| Pivot and Lateral-move | ||
| Subsurface Drip | ||
| Geography | North America | United States |
| Canada | ||
| Mexico | ||
| Rest of North America | ||
| South America | Brazil | |
| Argentina | ||
| Rest of South America | ||
| Europe | Germany | |
| United Kingdom | ||
| France | ||
| Italy | ||
| Spain | ||
| Russia | ||
| Rest of Europe | ||
| Asia-Pacific | China | |
| India | ||
| Japan | ||
| South Korea | ||
| Australia | ||
| New Zealand | ||
| Rest of Asia-Pacific | ||
| Middle East | Turkey | |
| Saudi Arabia | ||
| United Arab Emirates | ||
| Israel | ||
| Rest of Middle East | ||
| Africa | South Africa | |
| Egypt | ||
| Rest of Africa | ||


Key Questions Answered in the Report
What is the current size of the automated irrigation systems market?
The market is valued at USD 7.2 billion in 2025 and is forecast to reach USD 12.4 billion by 2030 at an 11.5% CAGR.
Which automation type leads global sales?
Real-time sensor-based systems hold 45% of 2024 revenue, reflecting growers’ preference for data-driven scheduling.
Which region is growing the fastest?
The Middle East shows a 22.5% CAGR through 2030 due to extreme water scarcity and strong government incentives.
How are subsidies influencing market penetration?
Programs such as the USDA’s USD 400 million drought-mitigation fund cover a portion of equipment costs, shortening payback periods and expanding access to automation.
Page last updated on:


