Medical Robots Market Size and Share
Market Overview
| Study Period | 2019 - 2030 |
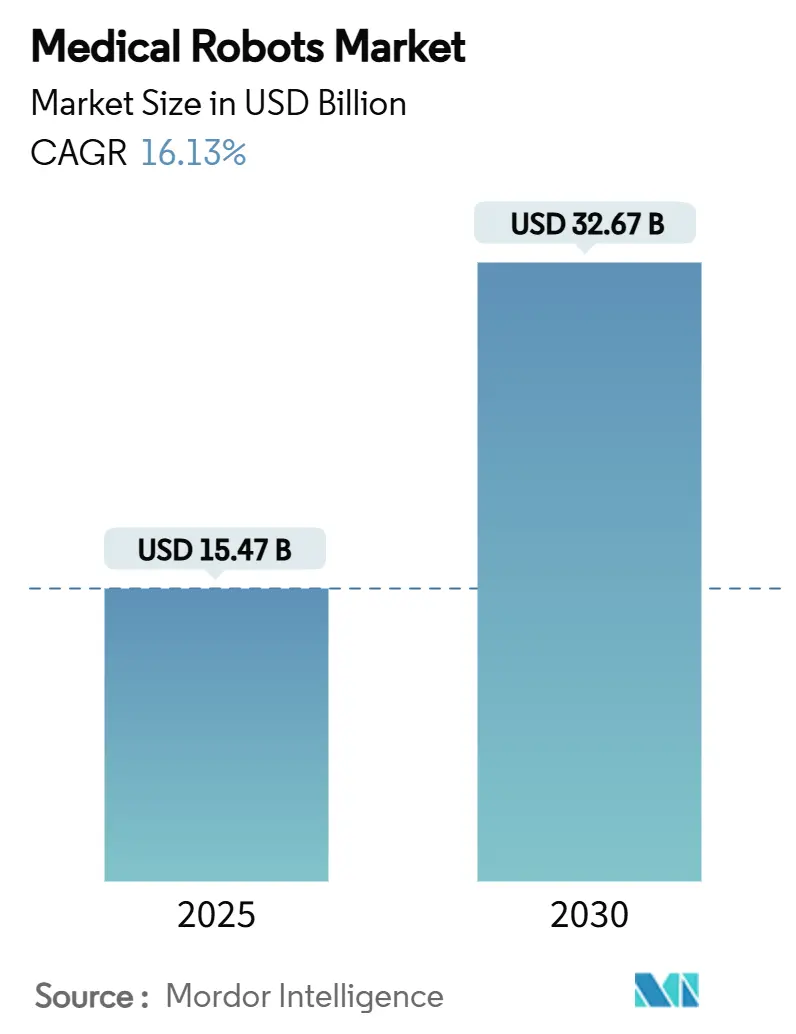
| Market Size (2025) | USD 15.47 Billion |
| Market Size (2030) | USD 32.67 Billion |
| Growth Rate (2025 - 2030) | 16.13% CAGR |
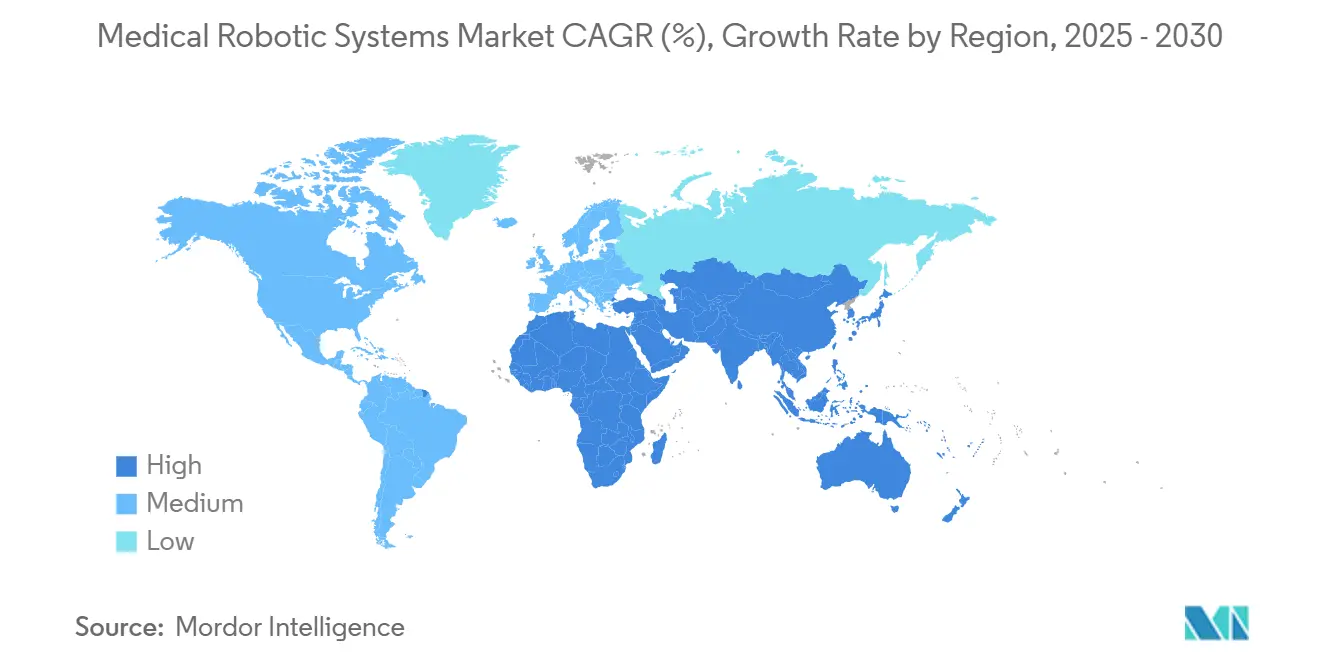
| Fastest Growing Market | Asia Pacific |
| Largest Market | North America |
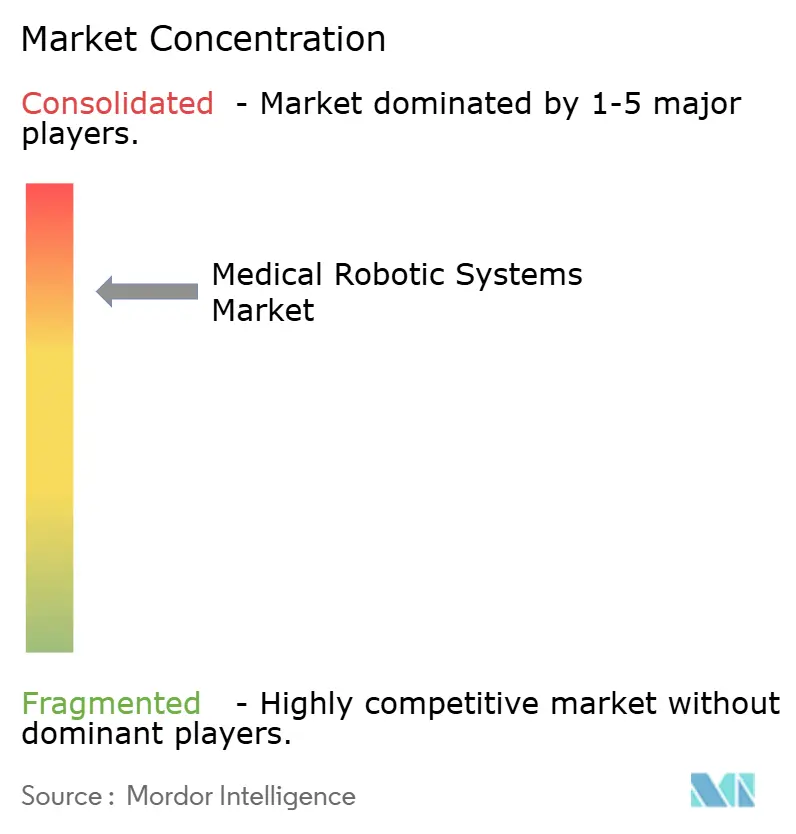
| Market Concentration | High |
Major Players*Disclaimer: Major Players sorted in no particular order Image © Mordor Intelligence. Reuse requires attribution under CC BY 4.0. |
|
Medical Robots Market Analysis by Mordor Intelligence
The medical robots market size is estimated at USD 15.47 billion in 2025 and is forecast to advance to USD 32.67 billion by 2030, translating into a 16.13% CAGR that outpaces overall medical-device growth. Growing convergence between artificial intelligence and precision engineering, subscription-based financing that removes capital barriers, and regulatory policies that favor automated solutions are key accelerants. Procedure volumes are rising fastest in outpatient surgery centers across the United States and Europe, while China’s tier-3 hospitals deploy oncology-focused platforms to shorten cancer treatment queues. North America maintains leadership through favorable reimbursement, yet Asia-Pacific registers the steepest growth curve as government-sponsored rehabilitation programs expand access. Competitive positioning hinges on installed base, clinical evidence, and the ability to wrap hardware in data-driven service contracts that lock in recurring revenue.
Key Report Takeaways
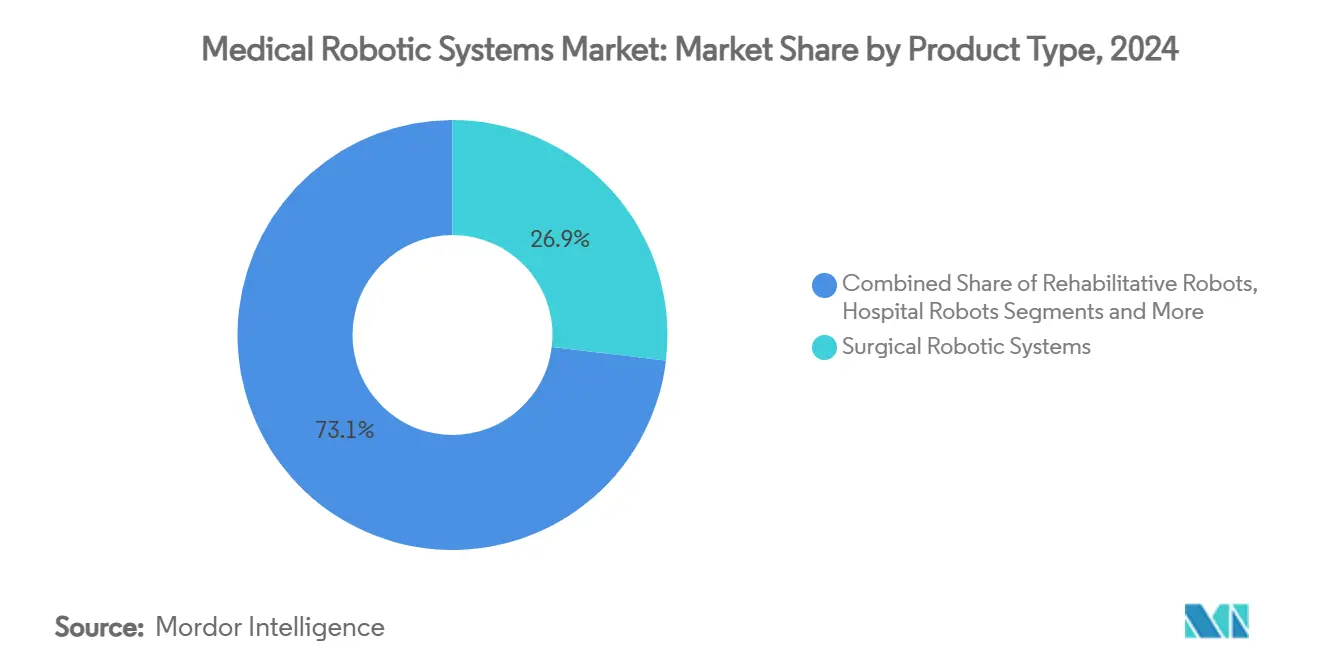
- By product type, surgical robotic systems led with 26.9% of the medical robots market share in 2024; exoskeleton and rehabilitative robots are projected to expand at an 18.2% CAGR to 2030.
- By component, instruments and accessories commanded a 51% share of the medical robots market size in 2024, while the services segment posts the fastest 18.71% CAGR through 2030.
- By application, general surgery accounted for a 29.8% share of the medical robots market size in 2024, yet neurology applications is expected to advance at a 22.7% CAGR through 2030.
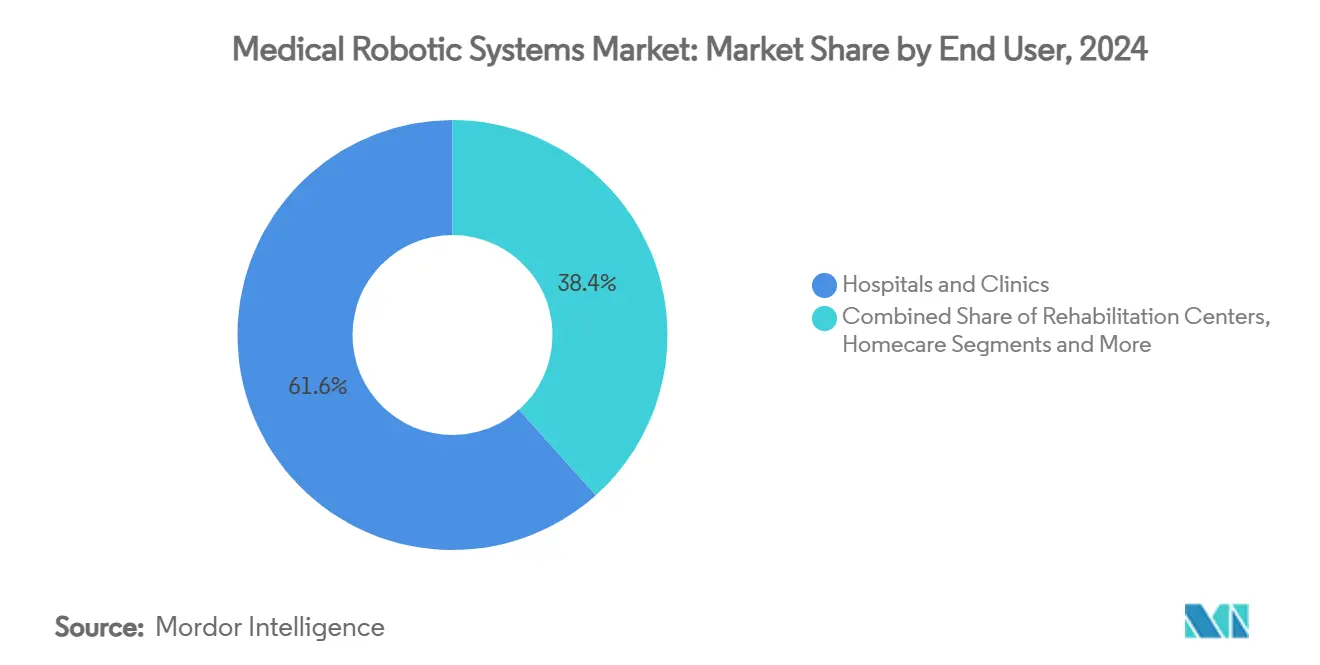
- By end user, hospitals and clinics held 61.05% of the medical robots market share in 2024, whereas ambulatory surgery centers is expected to record the highest 19.1% CAGR through 2030.
- By region, North America seized a 36% revenue share in 2024; Asia-Pacific is forecast to grow at an 18% CAGR to 2030.
Global Medical Robots Market Trends and Insights
Drivers Impact Analysis
| DRIVER | (~) % IMPACT ON CAGR FORECAST | GEOGRAPHIC RELEVANCE | IMPACT TIMELINE |
|---|---|---|---|
| Accelerating Adoption of Outpatient Robotic Surgery Centers in US & Europe | +2.8% | North America & Europe | Medium term (2-4 years) |
| Rapid Surge in Oncology-Focused Robotic Procedures in China's Tier-3 Hospitals | +2.1% | China, spill-over to APAC | Short term (≤ 2 years) |
| Mandatory Minimum-Volume Policies in Germany Pushing Hospitals toward Robotic Systems | +1.4% | Germany, expanding to EU | Long term (≥ 4 years) |
| Emergence of Subscription & Leasing Business Models Reducing Up-front CAPEX | +3.2% | Global, early gains in emerging markets | Medium term (2-4 years) |
| Integration of AI-Powered Intra-operative Imaging Driving Precision Neurosurgery | +2.5% | Global, concentrated in developed markets | Long term (≥ 4 years) |
| Government-Sponsored Rehabilitation Robotics Programs Addressing Stroke Burden | +1.7% | Japan & South Korea, expanding to APAC | Long term (≥ 4 years) |
Source: Mordor Intelligence
Accelerating Adoption of Outpatient Robotic Surgery Centers in the United States & Europe
Ambulatory surgery facilities reduce procedure costs by 30-40% relative to inpatient settings while matching clinical outcomes, a differential that compels payers to steer appropriate cases into same-day pathways. Medicare’s payment updates for 2025 continue to expand the ASC-eligible list, and private insurers deploy bundled payments that reward high-throughput centers. European systems follow suit; Germany links hospital funding to procedure-volume thresholds, prompting regional networks to pool robotic assets to keep complex cases local.[1]Intuitive Surgical, “Intuitive Announces Fourth Quarter and Full Year 2024 Financial Results,” investor.intuitive.com
Rapid Surge in Oncology-Focused Robotic Procedures within China’s Tier-3 Hospitals
China’s National Health Commission increasingly references robot-assisted resection in its oncology protocols, spurring procurement among provincial referral centers that traditionally lacked capital budgets. Hospitals leverage robotics to recruit top surgeons from tier-1 cities and to standardize outcomes across sprawling networks. Domestic vendors enter with lower-priced systems, compressing acquisition costs and accelerating penetration beyond state targets.
Mandatory Minimum-Volume Policies in Germany Pushing Hospitals toward Robotic Systems for Complex Surgeries
Germany requires hospitals to meet annual case minimums for highly complex procedures, a policy that drives investment in robotic platforms capable of elevating throughput without compromising quality. Smaller facilities form hub-and-spoke alliances, sharing capital assets and expertise to comply with rules while keeping patients in local catchment areas.
Emergence of Subscription & Leasing Business Models Reducing Up-front CAPEX in Middle-Income Markets
Robotics-as-a-Service converts large capital purchases into predictable monthly fees that bundle hardware, instruments, maintenance, and training. Med One Group reports a 40% year-over-year rise in surgical-robot leases, a trend especially visible in Latin America and Southeast Asia where hospital borrowing capacity is limited. Manufacturers gain steady annuity streams while hospitals align costs with utilization.[2]Med One Group, “Medical Equipment Leasing—Surgical Robotics,” medonegroup.com
Restraints Impact Analysis
| RESTRAINTS | (~) % IMPACT ON CAGR FORECAST | GEOGRAPHIC RELEVANCE | IMPACT TIMELINE |
|---|---|---|---|
| Rising Back-log of Post-Warranty Service Costs Deterring Smaller Hospitals | -1.8% | Global, concentrated in emerging markets | Medium term (2-4 years) |
| Data-Protection Regulations Limiting Cloud-Connected Robot Analytics | -1.2% | Europe & North America, expanding globally | Long term (≥ 4 years) |
| Shortage of Certified Robotic Surgeons in Latin America Slowing Utilization Rates | -0.9% | Latin America, spill-over to emerging markets | Long term (≥ 4 years) |
| Stringent FDA Cybersecurity Draft Guidance Elevating Compliance Costs for New Entrants | -1.1% | Global, concentrated in US market entry | Medium term (2-4 years) |
Source: Mordor Intelligence
Rising Back-log of Post-Warranty Service Costs Deterring Smaller Hospitals
Annual service contracts can reach 15% of the original purchase price, and out-of-warranty repairs often exceed USD 100,000, a financial hurdle that smaller sites struggle to budget. As first-generation systems installed in the mid-2010s age, maintenance peaks, forcing administrators to defer new purchases or limit utilization to funded cases.
Data-Protection Regulations (GDPR/HIPAA) Limiting Cloud-Connected Robot Analytics
GDPR’s explicit consent rules and HIPAA security provisions require hospitals to overhaul data governance before transmitting intra-operative data to cloud analytics, delaying rollouts of AI decision-support modules. Vendors must spin up region-specific data clouds, raising costs and elongating upgrade cycles.
Segment Analysis
By Product Type: Surgical Dominance Amid Rehabilitation Upswing
Surgical systems retained a 26.9% share of the medical robots market size in 2024, buoyed by mature reimbursement codes and extensive surgeon training pipelines. Utilization spans urology, gynecology, general, and orthopedic procedures, with cumulative da Vinci case volumes surpassing 15 million globally. Oncology applications in radiosurgery, led by platforms such as CyberKnife, demonstrate 89.3% local tumor-control rates, reinforcing clinical acceptance.
Rehabilitative solutions trail in revenue but are scaling quickly on the back of publicly funded stroke programs. Exoskeleton sessions deliver higher therapy intensity, and early health-economic studies show 15% faster functional recovery versus conventional physiotherapy. Combined, these factors push rehabilitation robotics to an 18.2% CAGR, the fastest within the medical robots market.[3]StockTitan, “Breakthrough 25-Year Study Reveals CyberKnife’s 89% Cancer Treatment Success,” stocktitan.net
Note: Segment shares of all individual segments available upon report purchase
By Component: Services Propel Recurring Revenue
Instruments and accessories represented 51% of the medical robots market share in 2024, reflecting the razor-razor blade economics of consumables. Each multi-port procedure consumes USD 800–USD 1,600 in disposable instruments, creating predictable income streams for vendors. Meanwhile, the services line—covering software, analytics, training, and field maintenance—grows at 18.71% CAGR as hospitals pivot to subscription bundles that promise system uptime and periodic upgrades. Vendors regard services as margin-accretive, and investor presentations flag a target mix where recurring contracts exceed hardware sales by 2028 within the medical robots market.
By Application: Neurology Emerges as Growth Engine
General surgery led with 29.8% of the 2024 medical robots market size, driven by high procedure counts in cholecystectomy, hernia repair, and bariatric interventions. Neurology, however, advances at a 22.7% CAGR on the back of AI-guided stereotactic systems capable of pinpointing deep-brain lesions and assisting complex spine alignment. Hospitals report 25% reductions in operative time and 30% cuts in radiation exposure owing to automated trajectory planning. Orthopedics remains a robust adopter, exemplified by the world’s first robotic-assisted shoulder replacement completed with Zimmer Biomet’s ROSA system in 2024.
By End User: Ambulatory Centers Capture Momentum
Hospitals and large clinic networks still account for 61.05% of the medical robots market share, thanks to established operating suites and critical-care support. Yet ambulatory surgery centers clock a 19.1% CAGR as payers incentivize same-day discharge for low-acuity cases. ASC operators negotiate bulk-procedure deals with vendors, leveraging high throughput to secure lower per-click instrument pricing. Rehabilitation clinics also deploy mobile exoskeletons under government subsidy, while early pilots test home-based therapy robots that deliver tele-supervised sessions.
Note: Segment shares of all individual segments available upon report purchase
By Automation Level: Semi-Autonomous Platforms Prevail
Semi-autonomous systems dominate because they enhance, rather than replace, surgeon skill. The architecture balances real-time haptic feedback with AI-driven path planning, a mix that gains regulator and clinician trust ieeexplore.ieee.org. Fully autonomous prototypes exist, but liability concerns and standards gaps push commercialization beyond 2030. Tele-operated models find niche use in military and rural deployments, whereas collaborative arms lighten surgeon fatigue during lengthy oncologic resections.
Geography Analysis
North America captured 36% revenue in 2024, supported by clear FDA pathways, strong venture funding, and payer acceptance of robotic codes. U.S. ambulatory centers increasingly integrate multi-specialty robotic suites, and Canada’s provincial tenders shift toward leasing to manage upfront budgets. Mexico’s private hospitals embrace robotics to service inbound medical tourists seeking cost-effective bariatric and orthopedic procedures.
Asia-Pacific is the fastest-growing geography at an 18% CAGR to 2030, underpinned by public funding, demographic pressure, and rising insured populations. China’s tier-3 hospital procurements accelerate oncology robot volumes, while Japan subsidizes exoskeletons for post-stroke therapy under its national insurance scheme. India’s corporate hospital chains adopt robots to differentiate care and draw diaspora patients, with procedural pricing 40-60% lower than Western counterparts.
Europe shows moderate but steady adoption shaped by heterogeneous payer systems. Germany’s volume-based quality rules force robotic investment, especially in visceral and cardiac surgery. The United Kingdom’s NICE incorporates cost-effectiveness thresholds, stretching adoption timelines yet ensuring sustainable utilization. France, Italy, and Spain pool robotic assets across regional clusters, while the Nordics integrate robotic data feeds into national registries for outcome benchmarking.
Note: Segment shares of all individual segments available upon report purchase
Competitive Landscape
The medical robots market remains moderately fragmented. Intuitive Surgical leverages its 7,500-plus installed da Vinci systems and extensive surgeon-training curricula to safeguard share, but newer entrants erode price points. CMR Surgical’s modular Versius robot, cleared in more than 80 countries, offers smaller footprint and flexible financing, appealing to budget-constrained facilities.
Johnson & Johnson’s Ottava prototype performed its first human surgeries in February 2025, marking the company’s bid to integrate AI vision through its Polyphonic digital ecosystem. Siemens Healthineers broadens its robotics scope by merging imaging, navigation, and automated C-arm positioning to create tightly coupled intra-operative workflows. Stryker maintains leadership in ortho robotics, and Smith+Nephew’s CORI knee platform secures new insert clearances, sustaining application depth.
Strategically, vendors gravitate toward recurring revenue. Hardware innovation alone no longer guarantees differentiation; AI analytics for predictive maintenance, integrated training modules, and cloud-delivered upgrades anchor customer loyalty. Partnerships with semiconductor and cloud providers accelerate algorithm development, while acquisitions in imaging and navigation fill capability gaps.
Medical Robots Industry Leaders
-
Intuitive Surgical Inc.
-
Stryker Corporation
-
Medtronic plc
-
Johnson & Johnson Services, Inc.
-
Siemens Healthineers AG
- *Disclaimer: Major Players sorted in no particular order
Recent Industry Developments
- May 2025: Zimmer Biomet reported Q1 2025 financial results showing continued growth in robotic solutions, highlighting the Z1 Triple-Taper Femoral Hip System and HAMMR Automated Hip Surgical Impactor System as key innovations. The company's acquisition of Paragon 28 for foot and ankle orthopedic technologies strengthens their robotic portfolio and market position in specialized surgical applications.
- April 2025: Smith+Nephew announced Q1 2025 revenue of USD 1,407 million with strong growth in robotics, particularly their CORI Surgical System for knee surgery. The company received FDA clearance for new LEGION Medial Stabilized inserts designed for use with the CORI system, expanding their robotics-enabled procedure capabilities.
- March 2025: Siemens Healthineers introduced the Ciartic Move, an automated self-driving C-arm system for intraoperative imaging that reduces procedure times by up to 50% during spine and pelvic surgeries. This innovation addresses global medical staff shortages while improving workflow efficiency and reducing radiation exposure for surgical teams.
- February 2025: Johnson & Johnson completed first surgeries with their Ottava surgical robot after receiving FDA Investigational Device Exemption approval, marking a significant milestone in their robotic surgery platform development. The company also announced a collaboration with NVIDIA to advance AI integration in surgical robotics through their Polyphonic digital ecosystem.
Global Medical Robots Market Report Scope
Medical robotic systems are fully or partially autonomous robots designed to assist medical personnel and facilities with surgeries, and hospital logistics, enhance patient care, and streamline clinical workflow and workplace safety.
The Medical Robotic Systems Market is segmented by Product Type (Surgical Robotic Systems, Rehabilitative Robotic Systems, Non-invasive Radiosurgery Robots, Hospital, and Pharmacy Robotic Systems) and Geography. The report offers the market size in value terms in USD for all the abovementioned segments.
| By Product Type | Surgical Robotic Systems | ||
| Rehabilitative Robotic Systems | |||
| Non-invasive Radiosurgery Robots | |||
| Hospital and Pharmacy Automation Robots | |||
| Other Medical Robots | |||
| By Component | Robotic Systems | ||
| Instruments and Accessories | |||
| Services (Maintenance, Training, Subscription) | |||
| Software and AI Platforms | |||
| By Application | General Surgery | ||
| Orthopedic Surgery | |||
| Neurosurgery | |||
| Cardiovascular | |||
| Gynecology | |||
| Urology | |||
| Oncology | |||
| Laparoscopy and Thoracoscopy | |||
| Other Applications | |||
| By End User | Hospitals and Clinics | ||
| Ambulatory Surgery Centers | |||
| Rehabilitation Centers | |||
| Homecare Settings | |||
| By Automation Level | Tele-operated | ||
| Semi-autonomous | |||
| Autonomous | |||
| Assistive and Collaborative | |||
| By Geography | North America | United States | |
| Canada | |||
| Mexico | |||
| Europe | United Kingdom | ||
| Germany | |||
| France | |||
| Italy | |||
| Rest of Europe | |||
| Asia-Pacific | China | ||
| Japan | |||
| India | |||
| South Korea | |||
| Rest of Asia | |||
| Middle East | Israel | ||
| Saudi Arabia | |||
| United Arab Emirates | |||
| Turkey | |||
| Rest of Middle East | |||
| Africa | South Africa | ||
| Egypt | |||
| Rest of Africa | |||
| South America | Brazil | ||
| Argentina | |||
| Rest of South America | |||
| Surgical Robotic Systems |
| Rehabilitative Robotic Systems |
| Non-invasive Radiosurgery Robots |
| Hospital and Pharmacy Automation Robots |
| Other Medical Robots |
| Robotic Systems |
| Instruments and Accessories |
| Services (Maintenance, Training, Subscription) |
| Software and AI Platforms |
| General Surgery |
| Orthopedic Surgery |
| Neurosurgery |
| Cardiovascular |
| Gynecology |
| Urology |
| Oncology |
| Laparoscopy and Thoracoscopy |
| Other Applications |
| Hospitals and Clinics |
| Ambulatory Surgery Centers |
| Rehabilitation Centers |
| Homecare Settings |
| Tele-operated |
| Semi-autonomous |
| Autonomous |
| Assistive and Collaborative |
| North America | United States |
| Canada | |
| Mexico | |
| Europe | United Kingdom |
| Germany | |
| France | |
| Italy | |
| Rest of Europe | |
| Asia-Pacific | China |
| Japan | |
| India | |
| South Korea | |
| Rest of Asia | |
| Middle East | Israel |
| Saudi Arabia | |
| United Arab Emirates | |
| Turkey | |
| Rest of Middle East | |
| Africa | South Africa |
| Egypt | |
| Rest of Africa | |
| South America | Brazil |
| Argentina | |
| Rest of South America |
Key Questions Answered in the Report
What is the current value of the medical robotics market?
The medical robotics market is valued at USD 15.47 billion in 2025 and is projected to reach USD 32.67 billion by 2030, reflecting a 16.13% CAGR.
Which product category dominates medical robotics installations?
Surgical robotic systems hold leadership with 26.9% of 2024 revenue, anchored by broad specialty coverage and established reimbursement frameworks.
Why are ambulatory surgery centers important for future growth?
ASCs deliver 30–40% cost savings over inpatient settings and post a 19.1% CAGR through 2030, making them pivotal in expanding robotic procedure volumes.
What regions present the highest growth potential?
Asia-Pacific records the fastest 18% CAGR, driven by public funding in China, Japan, and South Korea as well as rising insurance penetration across emerging economies.
How are vendors addressing high capital costs for hospitals?
Manufacturers and finance companies are rolling out subscription and leasing models that convert upfront CAPEX into predictable operating expenses, accelerating adoption in middle-income markets.
What role does artificial intelligence play in medical robotics?
AI enhances intra-operative imaging, guides instrument trajectories, and supports predictive maintenance, collectively improving surgical precision and system uptime while forming a new layer of differentiation for vendors.

