In Vitro Fertilization Market Size and Share
Market Overview
| Study Period | 2020 - 2031 |
|---|---|
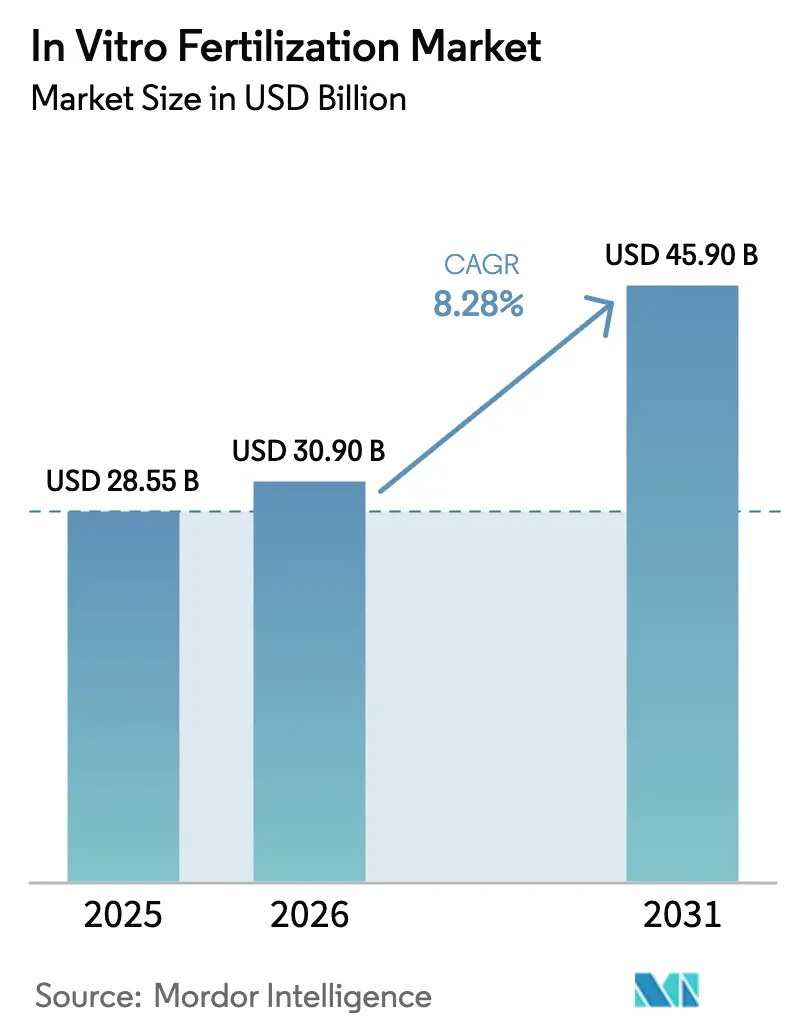
| Market Size (2026) | USD 30.90 Billion |
| Market Size (2031) | USD 45.90 Billion |
| Growth Rate (2026 - 2031) | 8.28% CAGR |
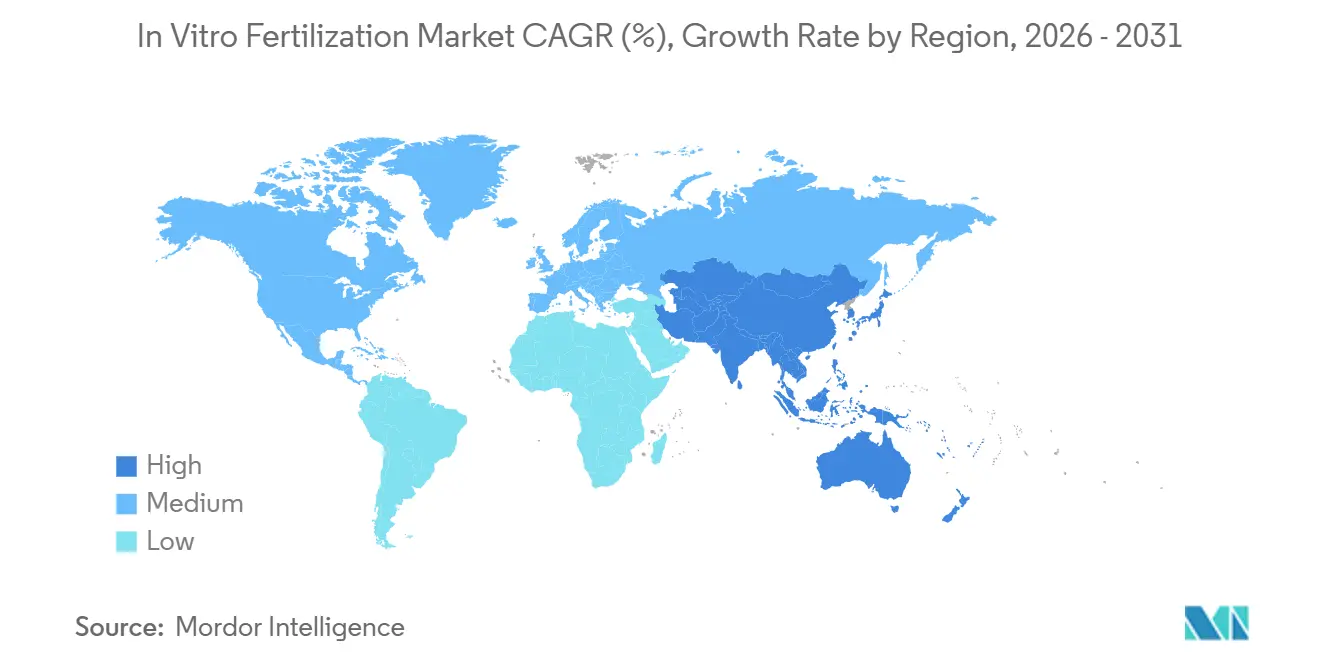
| Fastest Growing Market | Asia Pacific |
| Largest Market | North America |
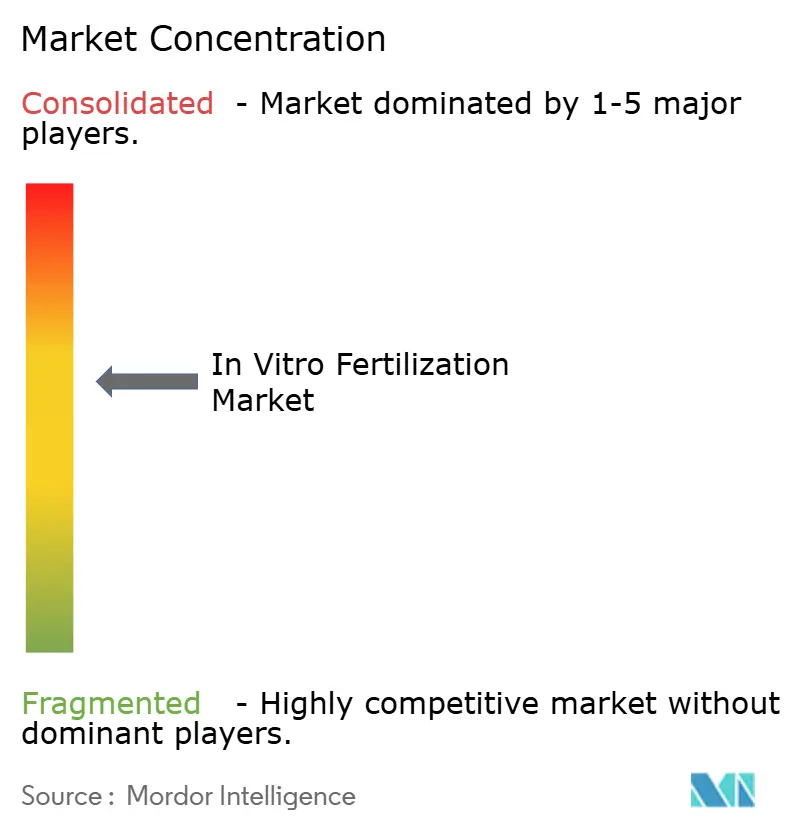
| Market Concentration | Medium |
Major Players *Disclaimer: Major Players sorted in no particular order Image © Mordor Intelligence. Reuse requires attribution under CC BY 4.0. | |
In Vitro Fertilization Market Analysis by Mordor Intelligence
The In Vitro Fertilization Market size is projected to be USD 28.55 billion in 2025, USD 30.90 billion in 2026, and reach USD 45.90 billion by 2031, growing at a CAGR of 8.28% from 2026 to 2031.
Strong demand stems from rising infertility prevalence, rapid adoption of single-use laboratory consumables, and employer-funded insurance packages that reduce out-of-pocket expenses. Advancements in time-lapse incubation, vitrification, and AI-based embryo grading continue to lift per-cycle success rates, nudging hesitant patients toward treatment. Leading suppliers are consolidating instrument, media, and genetic-testing portfolios under one roof, which supports bundled pricing and faster technology diffusion. At the same time, clinics localize supply chains to shield operations from geopolitical shipping disruptions, while regulators tighten evidence requirements for add-on genetic tests, extending the product-approval timeline.
Key Report Takeaways
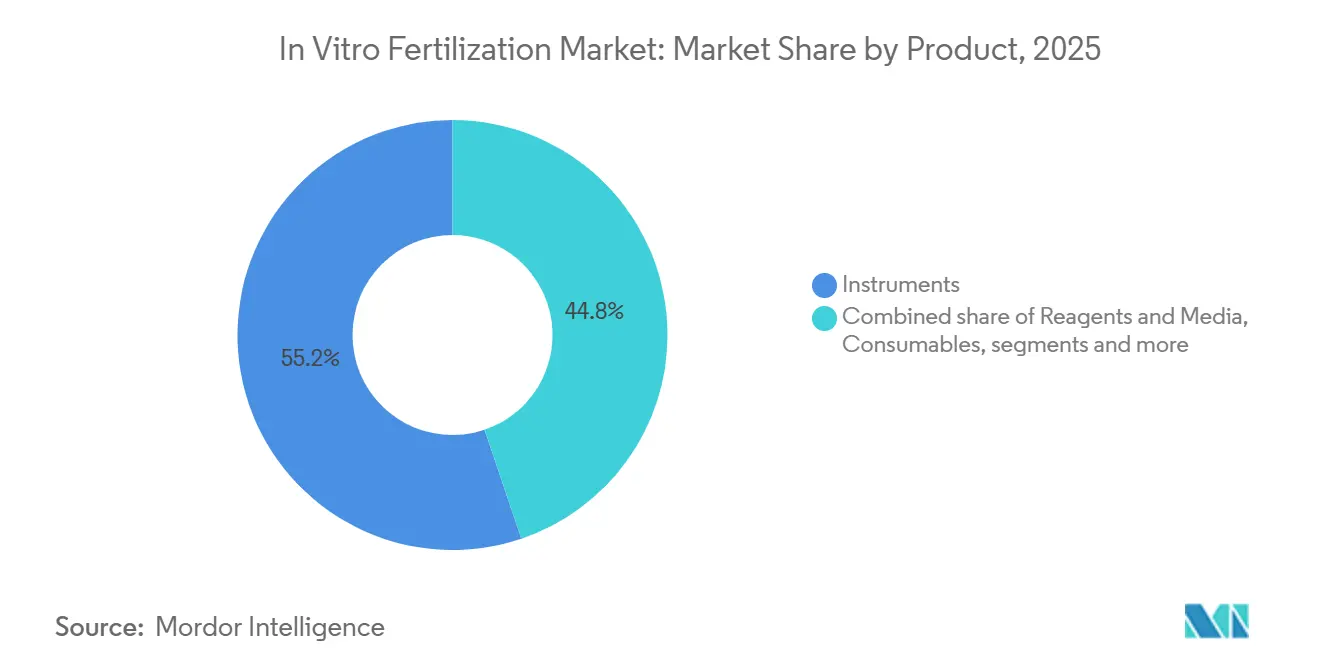
- By product category, instruments led with a 55.2% share of the in vitro fertilization market size in 2025, whereas consumables & disposables are growing at a 10.21% CAGR to 2031.
- By cycle type, fresh non-donor cycles held 34.2% of the in vitro fertilization market share in 2025, while donor egg cycles recorded the fastest 10.98% CAGR through 2031.
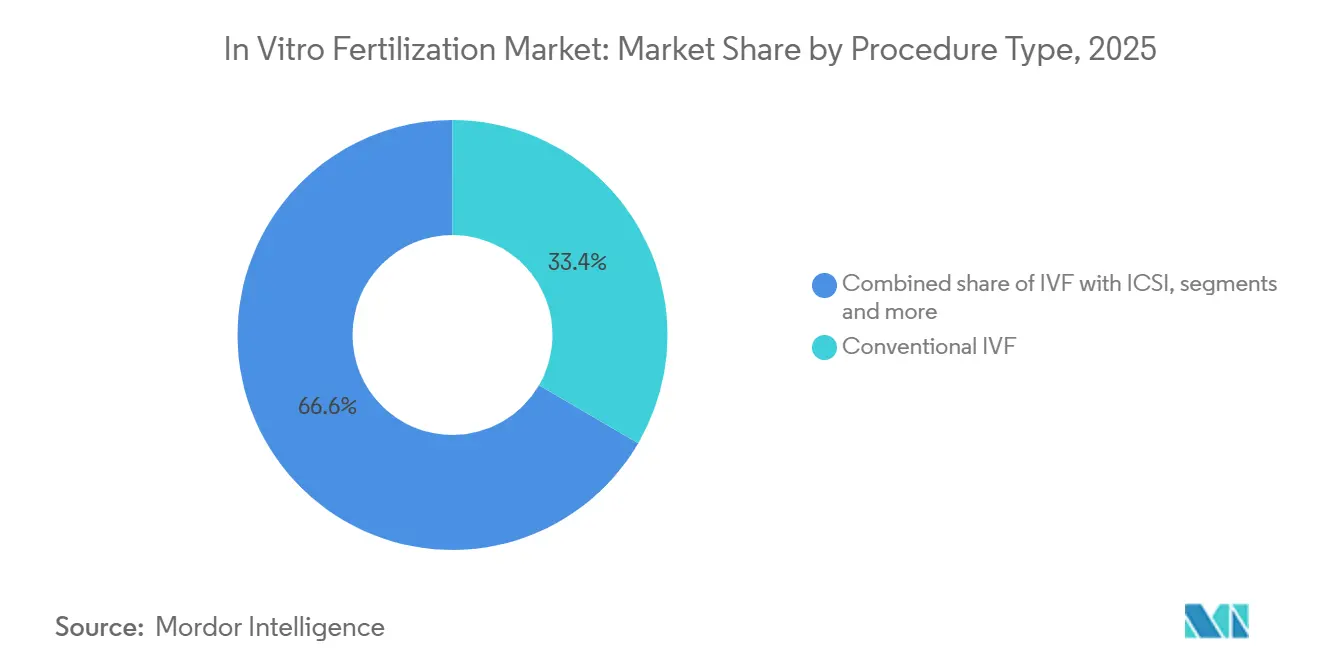
- By procedure, conventional IVF captured 33.4% revenue in 2025; IVF with PGT/PGD is expanding at a 10.11% CAGR over the same period.
- By end user, fertility clinics accounted for 61.45% of revenue in 2025 and are forecast to compound at 11.3% through 2031.
- By geography, North America generated 43.1% of global revenue in 2025, yet Asia-Pacific exhibits the highest 9.32% CAGR to 2031.
Note: Market size and forecast figures in this report are generated using Mordor Intelligence’s proprietary estimation framework, updated with the latest available data and insights as of January 2026.
Global In Vitro Fertilization Market Trends and Insights
Driver Impact Analysis*
| Driver | (~) % Impact on CAGR Forecast | Geographic Relevance | Impact Timeline |
|---|---|---|---|
| Rising infertility prevalence and diagnosis rates | +1.8% | Global, highest in North America, Europe, and urban Asia-Pacific | Medium term (2-4 years) |
| Increasing average maternal age at first birth | +1.5% | North America, Europe, East Asia | Long term (≥ 4 years) |
| Technological leaps in cryopreservation & culture media | +1.2% | Global, early adoption in North America and Western Europe | Short term (≤ 2 years) |
| Expansion of cross-border fertility tourism networks | +0.9% | Europe, Asia-Pacific, Middle East | Medium term (2-4 years) |
| AI-driven embryo-selection platforms boosting success rates | +1.1% | North America, Western Europe, select Asia-Pacific sites | Short term (≤ 2 years) |
| Employer-funded fertility benefits in self-insured plans | +1.3% | North America, emerging in Europe, and the Asia-Pacific | Medium term (2-4 years) |
| Source: Mordor Intelligence | |||
Rising Infertility Prevalence and Diagnosis Rates
Roughly 17.5% of adults now face infertility, a rise from 15% in 2010, according to a 2025 World Health Organization update [1]World Health Organization, “1 in 6 People Globally Affected by Infertility,” who.int. Improved diagnostic coverage uncovers previously hidden cases, especially in India, where district hospitals added infertility screening under the National Health Mission in 2024. In the United States, 13.4% of women aged 15-49 experienced impaired fecundity in 2024, up from 12.1% in 2015, amid higher obesity rates and endocrine-disruptor exposure [2]Centers for Disease Control and Prevention, “Infertility FAQs,” cdc.gov. The in vitro fertilization market benefits because diagnosed patients are more likely to pursue treatment. Clinics respond by scaling laboratory capacity and frozen-storage infrastructure to absorb volume. As stigma eases and subsidies rise, pent-up demand continues to convert into active treatment cycles, lifting procedure counts in developing economies.
Increasing Average Maternal Age at First Birth
Mean maternal age at first birth reached 28.2 years in the United States in 2023 and climbed to nearly 30 years in several OECD members, a demographic tilt that inflates cycle volumes because older patients require more attempts for success. Japan reported that 29.8% of first births occurred to mothers aged 35 or older in 2024, prompting subsidy ceilings to rise to JPY 300,000 (USD 2,000) per cycle. Clinics, therefore, diversify stimulation protocols, offering mini-IVF to manage diminished ovarian reserve while protecting live-birth outcomes. The in vitro fertilization market embeds these age-driven treatments as core growth, particularly in East Asia and Southern Europe, where delayed childbearing is widespread. Equipment makers emphasize gentle stimulation monitoring tools to attract this expanding demographic.
Technological Leaps in Cryopreservation & Culture Media
Vitrification success rates now exceed 95%, allowing elective single-embryo transfer that minimizes multiple-pregnancy risk. FUJIFILM Irvine Scientific launched a culture medium in 2024 featuring hyaluronan and recombinant albumin that improved blastocyst formation by 7% in multi-center trials. Time-lapse incubators give embryologists uninterrupted morphokinetic data, enhancing embryo grading accuracy and standardizing lab outcomes. Rapid tech diffusion narrows performance gaps between academic centers and community clinics, widening the addressable base for premium consumables. As a result, the in vitro fertilization market records consistent cycle success and attracts private-equity investment into scalable clinic chains.
Expansion of Cross-Border Fertility Tourism Networks
An estimated 35,000 European patients traveled for cross-border IVF in 2024, chiefly from Germany, Italy, and France to Spain and the Czech Republic, to secure anonymous donor gametes at lower cost. Thailand saw a sharp increase in fertility-tourism arrivals from Australia and the Middle East, amplifying demand for English-language counselors and tele-consult platforms. Destination clinics invest in remote monitoring so patients can complete preliminary workup at home, reducing travel to two visits. The trend pressures restrictive jurisdictions to liberalize policies to stem outbound spend, illustrated by Germany’s 2025 consultation on legalizing egg donation. These patient flows diversify geographic revenue streams for suppliers, supporting the in vitro fertilization market across multiple hubs.
Restraints Impact Analysis*
| Restraint | (~) % Impact on CAGR Forecast | Geographic Relevance | Impact Timeline |
|---|---|---|---|
| High treatment cost & patchy insurance reimbursement | -1.4% | Global, acute in Latin America, the Middle East, Africa, and parts of the Asia-Pacific | Long term (≥ 4 years) |
| Persistent ethical & religious concerns over embryo handling | -0.7% | Middle East, Latin America, parts of Europe | Long term (≥ 4 years) |
| Regulatory bottlenecks for add-on genetic screening tools | -0.5% | North America, Europe, select Asia-Pacific | Medium term (2-4 years) |
| Supply-chain vulnerability in specialty reagents & plastics | -0.6% | Global, acute during geopolitical disruptions | Short term (≤ 2 years) |
| Source: Mordor Intelligence | |||
High Treatment Cost and Patchy Insurance Reimbursement
A single IVF cycle in the United States costs USD 15,000–30,000, and patients average 2.5 cycles for a live birth, leaving uninsured couples liable for USD 37,500–75,000. Only 21 states mandate partial coverage, often with age caps or cycle limits, which delays treatment start. In India, an INR 150,000 (USD 1,800) price tag equals 4 months of urban household income, making affordability a major barrier. Clinics experiment with mini-IVF protocols that cut medication costs by 40%, yet lower success per cycle may neutralize savings. High prices, therefore, dampen uptake in cash-pay markets and cap the in vitro fertilization market in low-income regions.
Supply-Chain Vulnerability in Specialty Reagents & Plastics
Red Sea disruptions in 2024 delayed media shipments to Asia-Pacific clinics by up to 5 weeks, forcing schedule alterations and fresh-cycle postponements. Culture media depend on purified proteins sourced from a few suppliers, creating a single-point failure risk. Plastics prices swing with crude oil volatility, inflating catheter costs by up to 20% within a year. FUJIFILM Irvine Scientific and Vitrolife are building secondary plants in Singapore and the United States to hedge risk, but capacity will not come online until late 2026 [3]FUJIFILM Irvine Scientific, “Business Continuity Announcements,” irvinesci.com . Supply fragility, therefore, constrains near-term growth for the in vitro fertilization market.
*Our forecasts treat driver/restraint impacts as directional, not additive. The impact forecasts reflect baseline growth, mix effects, and variable interactions.
Segment Analysis
By Product: Instruments Lead, Consumables Accelerate
In 2025, instruments generated 55.2% of revenue, illustrating capital intensity in IVF laboratories where incubators, micromanipulators, and laser systems dominate budgets. Vitrolife’s EmbryoScope time-lapse incubator, priced at USD 80,000–120,000, anchors this premium tier. Consumables & disposables, however, post the fastest 10.21% CAGR to 2031 as clinics shift toward single-use catheters under tighter sterility rules. The in vitro fertilization market size for consumables is projected to account for one-third of incremental revenue gains through 2031. Regulatory pressure to validate cleaning procedures for reusable equipment accelerates the switch to disposables, while private-equity investors favor the predictable reorder cycle attached to consumable sales.
A broader push for contamination control drives demand for closed vitrification devices and pre-sterilized culture dishes. Hamilton Thorne integrates laser-assisted hatching into catheter tips, blending instrument functionality with recurring disposable income. Suppliers bundle service contracts and replacement parts to lock in clinics for five-year terms, creating high switching costs. As manufacturing scales, unit prices fall, enlarging adoption among mid-volume centers and sustaining the in vitro fertilization market.


By Cycle Type: Fresh Dominates, Donor Egg Surges
Fresh non-donor cycles retained 34.2% revenue in 2025 owing to patient preference for autologous gametes and lower lab fees versus donor options. Yet donor egg cycles rise at a 10.98% CAGR, the highest within this category, benefiting from legal liberalization in Japan and persistent demand among women over 40. In Spain, donor egg revenues hit EUR 180 million (USD 195 million) in 2024, fueled by cross-border inflows. The in vitro fertilization market share for donor eggs is projected to reach double-digits by 2031.
Thawed-embryo cycles benefit from 95% post-vitrification survival, letting clinics adopt segmented stimulation strategies that minimize ovarian hyperstimulation risk. Cryobanks invest in genetic panels covering 300 inherited conditions, raising perceived quality and allowing premium pricing. Clinics that build or partner with egg banks secure supply and margin, while regulation remains a wild card as anonymity rules evolve across Europe and Asia-Pacific.
By Procedure Type: Conventional IVF Anchors, PGT/PGD Climbs
Conventional IVF delivered 33.4% of revenue in 2025, cementing its role for tubal-factor and unexplained infertility. Intracytoplasmic sperm injection (ICSI) now features in 70% of cycles globally, reflecting clinician preference for predictable fertilization rates despite higher consumable costs. IVF with PGT/PGD accelerates at a 10.11% CAGR, supported by Illumina’s sequencers that halve per-embryo testing cost to USD 200 in 2024. The in vitro fertilization market size attached to PGT could approach USD 5 billion by 2031 if reimbursement expands.
Professional societies caution that PGT-A offers limited benefit in women under 35, prompting selective payer coverage. Still, older patients and couples with recurrent loss maintain a strong demand. Natera’s carrier screening routes at-risk couples into downstream PGT-M testing, reinforcing the revenue loop. Clinics differentiate by offering same-day biopsy turnaround, leveraging newer bench-top sequencers.
By End User: Fertility Clinics Dominate and Accelerate
Fertility clinics captured 61.45% revenue in 2025 and are on track to grow 11.3% yearly, the fastest among end users. Their focused operating model supports investment in AI grading, rapid genetic testing, and patient-experience apps. Hospitals remain important for complex surgical adjuncts but grow more slowly as administrators juggle broader service lines. Cryobanks and research labs, though smaller, underpin donor-gamete and innovation pipelines for the in vitro fertilization industry.
Chain operators wield scale to negotiate consumable discounts and integrate back-office systems, while independents compete on concierge scheduling. IVI RMA Global reported 19% volume growth in 2024, driven by Latin-American expansion. Boston IVF adopted iDAScore network-wide in 2025, aiming to standardize outcomes. This consolidation raises entry barriers for new clinics but presents acquisition opportunities for investors seeking regional density.
Geography Analysis
North America delivered 43.1% of revenue in 2025, buoyed by 330,000 U.S. cycles performed in 2024 and expanding state mandates in California, Colorado, and New York. Employer-funded benefits and high disposable income sustain premium add-on adoption, including PGT and AI grading. Canada’s single-cycle provincial coverage drives early uptake, though many patients pay for subsequent attempts, supporting the in vitro fertilization market. Suppliers focus on regulatory compliance and bundled service contracts to protect their share amid competition from lower-priced imports.
Europe maintains steady growth as national health systems subsidize treatment and liberal gamete-donor laws attract cross-border patients. Spain and the Czech Republic serve as donor-egg hubs, and clinics leverage multilingual staff to capture demand. Germany’s 2025 consultation on legalizing egg donation could repatriate outbound spend. Regulatory alignment under the IVDR lengthens approval cycles for genetic-testing add-ons, yet once cleared, uniform rules simplify rollout across member states.
Asia-Pacific posts the highest 9.32% CAGR to 2031. China completed 530,000 cycles in 2024, up 22% year on year, after easing private-clinic licensing and broadening insurance coverage under urban employee plans. Japan’s JPY 300,000 (USD 2,000) subsidy stimulates uptake among women under 43, while India’s tier-2 cities witness rapid chain expansion targeting the middle class. Localization of culture-media production in Singapore and domestic catheter molding plants in China mitigates shipping delays and import duties, further energizing the in vitro fertilization market.
Mordor Intelligence provides coverage of the in vitro fertilization market across other key regional markets. Detailed country-level analysis extends to United Kingdom incorporating local coverage and market participation, as required.

Competitive Landscape
The top five suppliers, CooperSurgical, Vitrolife, Thermo Fisher Scientific, FUJIFILM Irvine Scientific, and Cook Group, collectively hold the majority share of instruments and consumables, signaling moderate concentration. The 2023 CooperSurgical-Vitrolife merger created a one-stop portfolio covering media, incubators, genetic testing, and surgical devices, enabling bundled discounts that smaller firms struggle to match. Thermo Fisher’s 2024 minority stake in AI startup Fairtility embeds predictive analytics into its EmbryoScope incubator, elevating switching costs for clinics already using its hardware.
Disruptors leverage cloud-based AI platforms that run on existing incubators, lowering capital hurdles for adoption. Harrison.ai’s BELA, licensed to 50 clinics worldwide, demonstrated non-inferiority to manual grading in a randomized trial. Hamilton Thorne strengthens its niche in laser micromanipulation with 12 patent filings in 2024, while Kitazato targets regulatory pain points with a closed-vitrification system that avoids direct liquid-nitrogen contact.
Regulatory compliance becomes a key differentiator as the FDA and Europe’s IVDR tighten evidentiary demands. Companies able to finance multi-center trials and secure clearances gain priority in hospital procurement. Clinics favor suppliers offering outcome-based pricing or live-birth guarantees, transferring part of the procedure risk upstream. Overall, the in vitro fertilization market rewards vertically integrated firms that blend hardware, consumables, and data analytics into cohesive packages.
In Vitro Fertilization Industry Leaders
Vitrolife AB
CooperSurgical Inc.
Merck KGaA
Genea Biomedx Pty Ltd
Cook Group Incorporated
- *Disclaimer: Major Players sorted in no particular order

Recent Industry Developments
- July 2025: NewGenIvf Group Limited acquired 26 cell-sorting systems and six microfluidic patents to bolster its technological capabilities. This acquisition of machinery and intellectual property is intended to strengthen its market position and facilitate a planned U.S. expansion of its NewGenSort services.
- June 2025: Gameto secured FDA clearance to begin Phase III trials of its iPSC-derived Fertilo protocol aimed at reducing hormone loads and shortening cycle length to less than 3 days.
- February 2025: NewGenIvf Group Limited has acquired MicroSort, a revolutionary sperm-sorting technology that plays a significant role in assisted reproductive services. MicroSort is an advanced technology that separates X and Y chromosome-bearing sperm cells before in vitro fertilization (IVF).
- January 2025: Astorg finalized the USD 228 million acquisition of Hamilton Thorne and Cook Medical’s IVF unit, creating a combined equipment–consumables platform.


Research Methodology Framework and Report Scope
Market Definitions and Key Coverage
Our study views the in-vitro fertilization market as every commercial good or paid service directly enabling human IVF cycles, such as culture media, disposable labware, capital equipment, genetic testing add-ons, cycle fees, and post-transfer clinical visits, delivered through clinics, hospitals, and cryobank networks worldwide. According to Mordor Intelligence, valuation begins once ovarian stimulation medications are dispensed and ends with the embryo-transfer visit; follow-up pregnancy care lies outside this boundary.
Scope exclusion: veterinary reproductive services, hormonal contraceptives, and home-use fertility trackers are not counted.
Segmentation Overview
- By Product
- Reagents & Media
- Culture Media
- Cryopreservation Media
- Semen Processing Media
- Instruments
- Imaging Systems
- Incubators & Time-Lapse Chambers
- Cryosystems (LN₂ Tanks, Freezers)
- IVF Workstations & Clean-Air Cabinets
- Ovum Aspiration Pumps
- Sperm Separation Systems
- Micromanipulator Systems
- Other Instruments
- Consumables & Disposables
- Pipettes & Tips
- Catheters & Needles
- Culture Dishes & Slides
- Embryo Transfer Sets
- Reagents & Media
- By Cycle Type
- Fresh IVF Cycles – Non-Donor
- Thawed / Frozen IVF Cycles – Non-Donor
- Donor Egg IVF Cycles
- Donor Sperm IVF Cycles
- By Procedure Type
- Conventional IVF
- IVF with ICSI
- IVF with PGT/PGD
- Mini-IVF & Natural-Cycle IVF
- By End User
- Fertility Clinics
- Hospitals & Surgical Centers
- Cryobanks & Research Laboratories
- By Geography
- North America
- United States
- Canada
- Mexico
- Europe
- Germany
- United Kingdom
- France
- Italy
- Spain
- Rest of Europe
- Asia-Pacific
- China
- Japan
- India
- Australia
- South Korea
- Rest of Asia-Pacific
- Middle East and Africa
- GCC
- South Africa
- Rest of Middle East and Africa
- South America
- Brazil
- Argentina
- Rest of South America
- North America
Detailed Research Methodology and Data Validation
Primary Research
Mordor analysts interview embryologists, reproductive endocrinologists, cryobank managers, and payor medical-policy leads across North America, Europe, Asia-Pacific, and the GCC region. Discussions clarify cycle-mix shifts, such as fresh versus frozen, average selling prices for media and disposables, and patient-financing uptake, which we then use to challenge secondary numbers and refine assumptions.
Desk Research
We begin by mapping national IVF cycle volumes, reimbursement rules, and equipment sales using open datasets from bodies such as the WHO infertility portal, CDC ART Registry, Eurostat, Japan's ART Council, and India's NARI dashboard. Trade groups, including the European Society of Human Reproduction and Embryology and the Asian Pacific Initiative on Reproduction, supply conference abstracts on success rates and lab practice trends. Public filings from listed clinic chains, patent analytics from Questel, and news archives in Dow Jones Factiva enrich cost and technology adoption benchmarks. The sources cited above are illustrative, not exhaustive; many additional references underpin each data point.
Market-Sizing & Forecasting
A top-down build starts with recorded IVF cycles by country and multiplies them by validated average revenue per cycle, which is then reconciled with bottom-up cross-checks, such as sampled equipment shipments and culture-media volumes. Key variables tracked include maternal age distribution, infertility prevalence, elective egg-freezing demand, reimbursement penetration, and average media price erosion. Forecasts for 2025 to 2030 are produced through multivariate regression blended with scenario analysis to accommodate policy or technological shocks; coefficients are stress-tested with clinicians before finalization. Data gaps in smaller economies are bridged using regional adoption ratios anchored to GDP per capita and insurance coverage.
Data Validation & Update Cycle
Outputs pass a four-layer review: analyst self-audit, senior peer check, sector lead approval, and final QA before sign-off. We refresh every twelve months, while material changes, for example, new national insurance mandates, trigger interim revisions and rapid stakeholder callbacks.
Credibility Anchor: Why Our In Vitro Fertilization Baseline Earns Trust
Published estimates often diverge because firms choose different product baskets, year anchors, and refresh speeds.
Below, we benchmark Mordor's 2025 value against external figures and note the research gaps that create variance.
Benchmark comparison
| Market Size | Anonymized source | Primary gap driver |
|---|---|---|
| USD 28.64 bn (2025) | Mordor Intelligence | - |
| USD 27.10 bn (2024) | Regional Consultancy A | Excludes cryopreservation accessories and relies on 2022 clinic volumes, so growth uplift is understated. |
| USD 29.51 bn (2024) | Trade Journal B | Combines surrogacy and fertility preservation revenues, inflating base; limited primary validation reported. |
These contrasts show that when scope creep or dated inputs slip in, totals drift quickly. By tying every dollar to transparent cycle counts, current ASPs, and yearly expert reviews, Mordor Intelligence delivers a balanced, reproducible baseline executives can rely on for investment and capacity decisions.


Key Questions Answered in the Report
What is the estimated size of in vitro fertilization market in 2026
The market is expected to reached USD 30.9 billion in 2026 and is forecast to climb to USD 45.9 billion by 2031.
What CAGR is expected for the in vitro fertilization market through 2031?
The market is projected to grow at an 8.28% CAGR over the forecast period.
Which segment shows the fastest growth in product categories?
Consumables & disposables post a 10.21% CAGR as clinics adopt single-use devices.
Which region is expanding the quickest?
Asia-Pacific records the highest 9.32% CAGR, driven by policy shifts in China, Japan, and India.
How is AI influencing clinical practice?
FDA-cleared AI platforms such as iDAScore cut embryo-selection time and have shown comparable pregnancy rates to manual grading, encouraging wider adoption.
What drives the surge in donor egg cycles?
Liberalized regulations and rising maternal age push donor egg cycles to a 10.98% CAGR, the fastest within cycle types.
Page last updated on:


