Paper Dyes Market Size and Share
Market Overview
| Study Period | 2020 - 2031 |
|---|---|
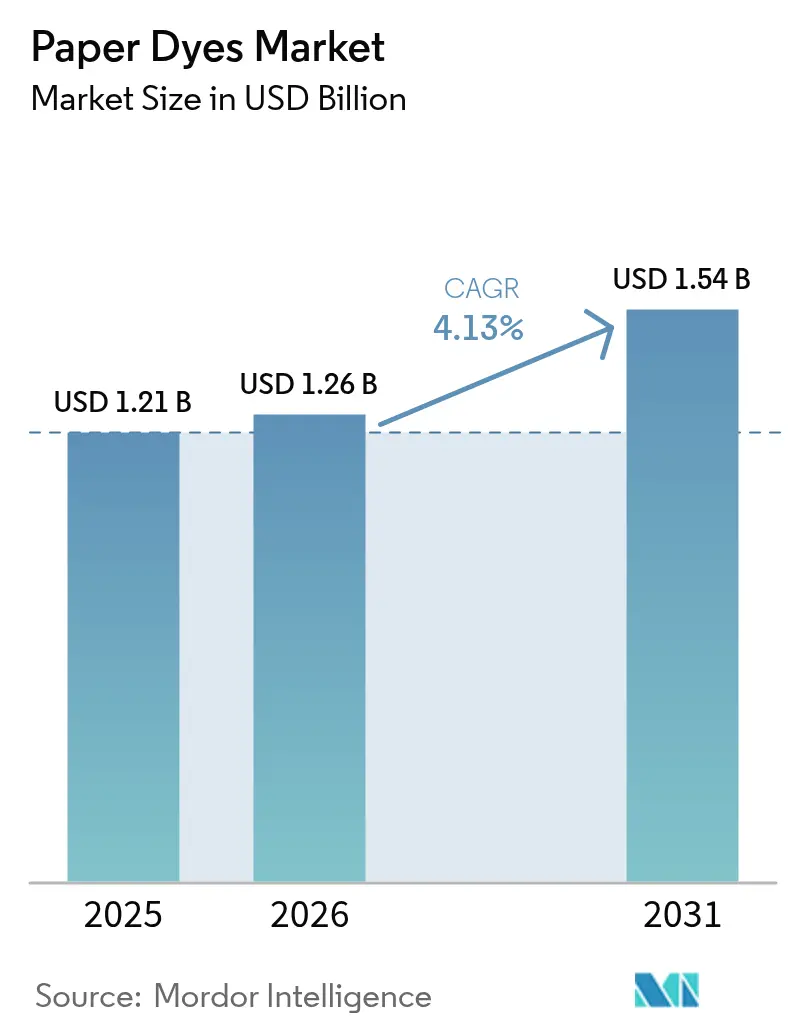
| Market Size (2026) | USD 1.26 Billion |
| Market Size (2031) | USD 1.54 Billion |
| Growth Rate (2026 - 2031) | 4.13% CAGR |
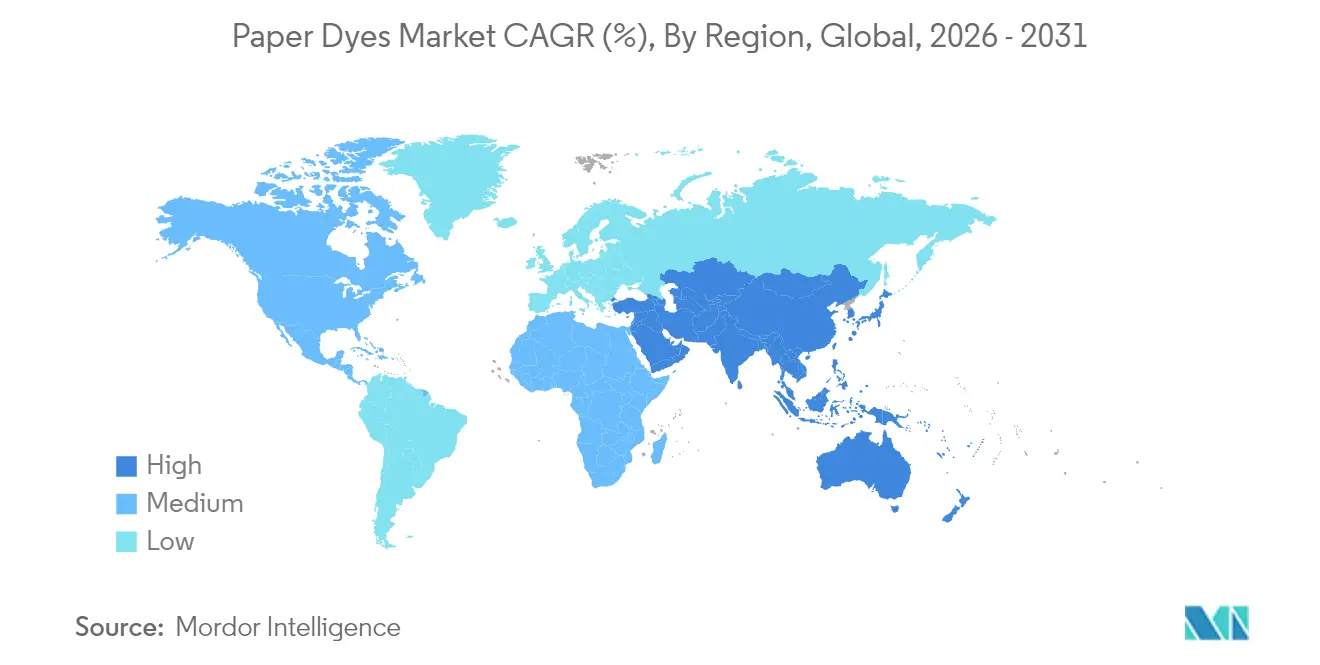
| Fastest Growing Market | Asia Pacific |
| Largest Market | Asia Pacific |
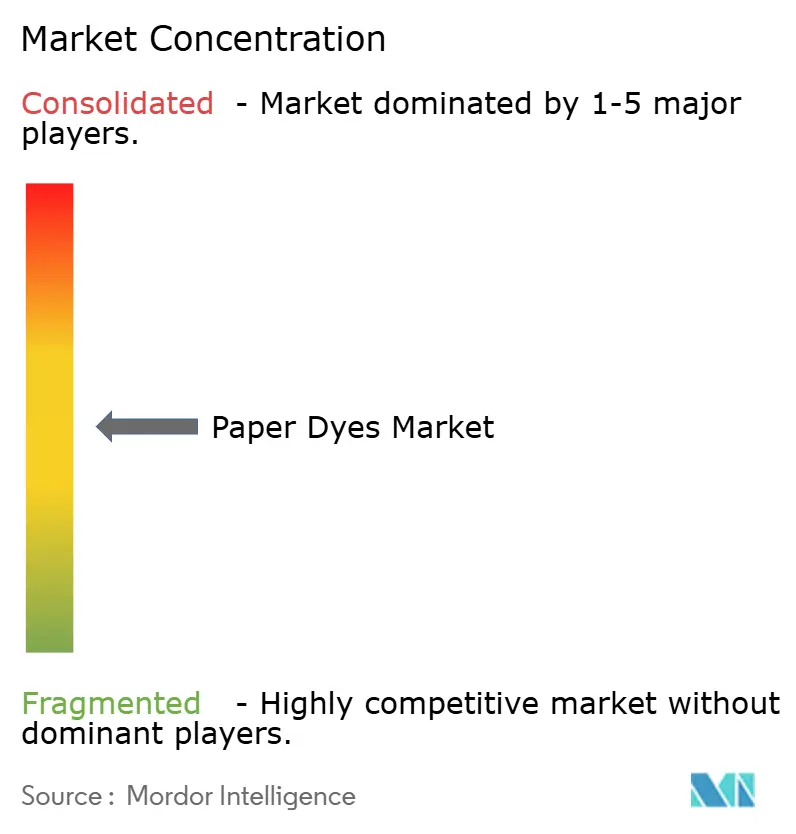
| Market Concentration | Medium |
Major Players *Disclaimer: Major Players sorted in no particular order Image © Mordor Intelligence. Reuse requires attribution under CC BY 4.0. | |
Paper Dyes Market Analysis by Mordor Intelligence
The Paper Dyes Market size was valued at USD 1.21 billion in 2025 and estimated to grow from USD 1.26 billion in 2026 to reach USD 1.54 billion by 2031, at a CAGR of 4.13% during the forecast period (2026-2031). This steady trajectory reflects the market’s resilience in digital-document substitution, supported by the structural migration from plastic to paper-based packaging and rising demand for vivid, brand-consistent graphics in e-commerce shipments. Liquid formulations that integrate seamlessly with modern inkjet lines are helping converters reduce downtime, while capacity additions by major dye makers keep raw material supply balanced. Regulatory tailwinds that restrict single-use plastics and brand owners’ preference for renewable substrates underpin an expansionary outlook even as graphic-paper volumes contract. Investments in lignin-compatible and nano-encapsulated chemistries further differentiate suppliers, positioning them to capture premium orders in food-contact and high-speed digital applications.
Key Report Takeaways
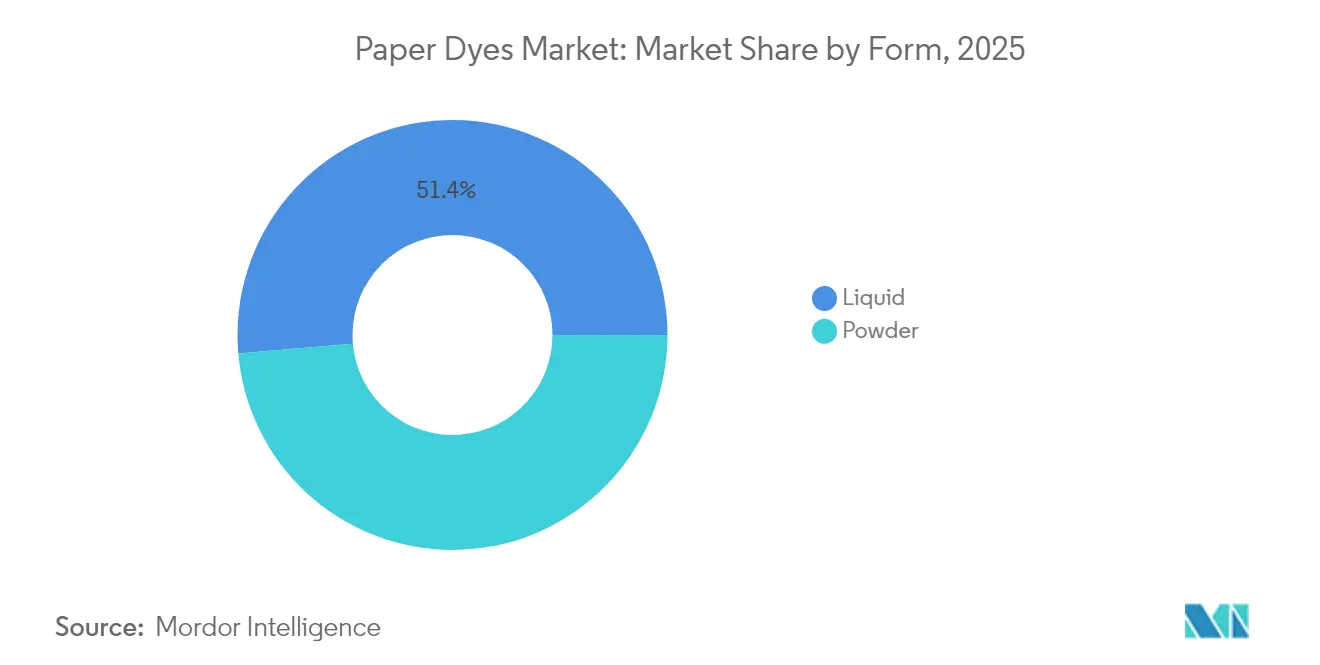
- By form, liquid products led with 51.38% of paper dyes market share in 2025 and are advancing at a 6.31% CAGR through 2031.
- By type, direct dyes captured 28.02% revenue share in 2025, while reactive dyes are projected to post the fastest 5.78% CAGR to 2031.
- By origin, synthetic grades controlled 69.64% share of the paper dyes market size in 2025; organic alternatives are expanding at a 6.96% CAGR.
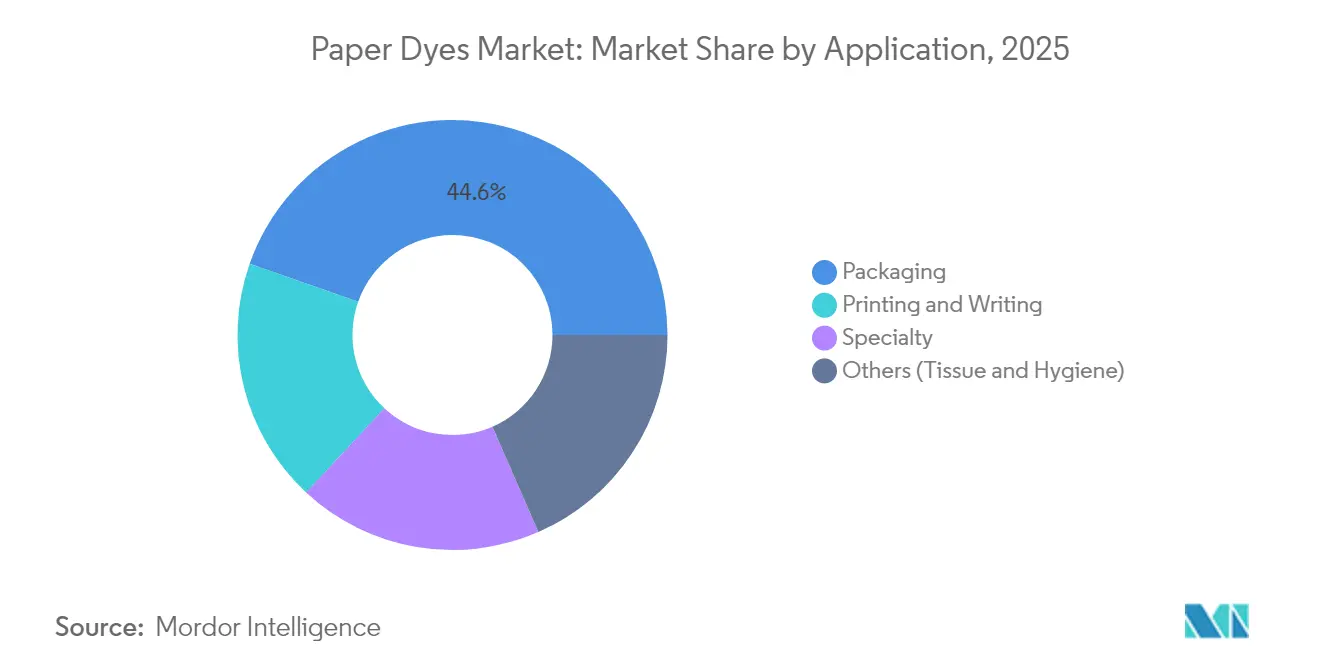
- By application, packaging accounted for 44.62% of 2025 revenue and is growing at a 6.62% CAGR to 2031.
- By region, Asia-Pacific dominated with 44.25% of 2025 revenue, outpacing all regions at a 5.56% CAGR.
Note: Market size and forecast figures in this report are generated using Mordor Intelligence’s proprietary estimation framework, updated with the latest available data and insights as of 2026.
Global Paper Dyes Market Trends and Insights
Driver Impact Analysis*
| Driver | (~) % Impact on CAGR Forecast | Geographic Relevance | Impact Timeline |
|---|---|---|---|
| Shift from plastic to paper-based packaging | +1.2% | Global, with strongest impact in North America & EU | Medium term (2-4 years) |
| E-commerce–fuelled boom in corrugated & mailer demand | +0.9% | Global, led by APAC and North America | Short term (≤ 2 years) |
| Capacity expansions by major dye manufacturers | +0.6% | APAC core, spill-over to North America | Medium term (2-4 years) |
| Breakthroughs in bio-based lignin-compatible dyes | +0.4% | EU and North America, expanding to APAC | Long term (≥ 4 years) |
| Nano-encapsulated dyes enabling digital inkjet printing on paper | +0.3% | Global, technology-driven adoption | Medium term (2-4 years) |
| Source: Mordor Intelligence | |||
Shift from Plastic to Paper-Based Packaging
Retail brands continue to replace petroleum-based substrates with recyclable, fiber-based formats to comply with single-use plastic bans and to meet consumer preference for paper. Nestlé, Unilever, and other multinationals now eliminate up to 97% of plastic from certain SKUs, accelerating orders for high-performance dyes that remain stable through multiple recycling loops[1]Two Sides North America, “Why Well-Designed Paper Packaging Is Replacing Plastic,” twosidesna.org. Regulatory certainty created by the European Union’s Single-Use Plastics Directive supports capital investment in converters that require food-contact-compliant, migration-safe colorants. Consumer willingness to pay premiums for sustainable packaging has held steady, allowing dye producers to defend pricing for novel, colorfast formulations that tolerate alkaline de-inking and oxidative bleaching in recovered-fiber systems.
E-commerce–Fueled Boom in Corrugated & Mailer Demand
Over 80% of online orders ship in corrugated formats, and parcel volumes continue to rise—particularly in Asia-Pacific and North America—creating concentrated demand for vivid graphics that elevate the unboxing experience. Fulfillment centers require rapid-turn inkjet lines that run on liquid dyes engineered for low-maintenance printheads, enabling same-day personalization at scale. Building leases for packaging plants rose 45% above the 20-year average in 2024, a clear signal of structural capacity expansion that will sustain the paper dyes market over the forecast horizon.
Capacity Expansions by Major Dye Manufacturers
Archroma’s USD 750,000 upgrade in South Carolina targets paper-packaging clients with faster lead times and localized technical support. BASF commissioned a 260,000-metric-ton hexamethylenediamine complex in France that feeds intermediates for specialty colorants. Solenis inaugurated a USD 193 million polyvinylamine plant in Virginia, enabling captive supply of key wet-strength resins that synergize with dyes for label and board grades[2]Water Tech Online, “Solenis Opens USD 193 Million Production Site in Virginia,” watertechonline.com. These investments anchor regional supply chains, shorten transit times, and open capacity for higher-margin, bio-based innovations.
Breakthroughs in Bio-Based Lignin-Compatible Dyes
European consortia are scaling lignin-derived colorants that match the hue strength of synthetic analogues while lowering cradle-to-gate CO2 footprints. Researchers at the University of Borås improved lignin modification pathways, unlocking pH-stable pigments suitable for alkaline papermaking lines. Horizon Europe’s HORIZON-JU-CBE-2024-IA-05 project co-produces lignin aromatics, signaling institutional confidence in commercial viability[3]Celignis, “HORIZON-JU-CBE-2024-IA-05: Selective and Sustainable Co-Production of Lignin Derived Aromatics,” celignis.com. Laboratory trials demonstrate that lignin nanoparticles adsorb and re-release dyes 14 times more efficiently than untreated lignin, a breakthrough that could simplify effluent treatment while valorizing biomass waste.
Restraint Impact Analysis*
| Restraint | (~) % Impact on CAGR Forecast | Geographic Relevance | Impact Timeline |
|---|---|---|---|
| Paperless office & digital documents adoption | -0.8% | Global, strongest in developed markets | Short term (≤ 2 years) |
| Toxic amines & rising REACH compliance costs | -0.5% | EU primary, expanding globally | Medium term (2-4 years) |
| Volatility in wood-pulp availability & pricing | -0.3% | Global, acute in Europe and North America | Short term (≤ 2 years) |
| Source: Mordor Intelligence | |||
Paperless Office & Digital Documents Adoption
Graphic-paper demand contracted sharply after corporate and educational users accelerated digital workflows. The Confederation of European Paper Industries recorded a 13% fall in paper and board production in 2023, with graphic grades alone down 28%. Remote-work protocols that cut printing volumes by 50-70% remain in force, while e-signature platforms reduce the need for hard copies. Although packaging dyes offset some losses, graphic-paper contraction limits overall tonnage growth, particularly in mature regions.
Toxic Amines & Rising REACH Compliance Costs
The 2025 REACH revision imposes essential-use criteria for high-risk chemistries, including broader PFAS restrictions and enhanced data requirements for endocrine disruptors. Annual compliance outlays for polycyclic aromatic hydrocarbon limits alone approach EUR 3.4 million, disproportionately burdening small dye producers. Ten-year registration validity and new polymer filing mandates compel companies to scale or exit, hastening consolidation and channeling R&D toward inherently safer molecules.
*Our forecasts treat driver/restraint impacts as directional, not additive. The impact forecasts reflect baseline growth, mix effects, and variable interactions.
Segment Analysis
By Form: Liquid Dominance Drives Digital Innovation
Liquid offerings held 51.38% of 2025 revenue and are projected to expand at a 6.31% CAGR, reinforcing their pivotal role in high-speed inkjet lines that power versioned e-commerce packaging. Powder grades, although easier to transport in bulk, must contend with dust-exposure rules and slower dispersion times. Nano-encapsulated liquid systems now enable print-head duty cycles exceeding 1,000 hours, minimizing maintenance shutdowns and improving OEE for converters. Stable viscosity across temperature swings supports automated dosing, aligning with just-in-time production targets.
Ongoing advances in mini-emulsion and microfluidic encapsulation increase shelf life, preserving hue intensity for over 12 months when stored at 25 °C, compared with six months for standard formulations. As a result, converters see reduced write-offs from expired stocks. Powder suppliers respond with compaction and dust-suppressant technologies but still trail liquid rivals in digitally enabled plants.


By Type: Direct Dyes Lead Despite Reactive Innovation
Direct dyes, favored for cost-efficient exhaust processes, commanded 28.02% of 2025 sales, maintaining dominance in high-volume linerboard mills. Yet the reactive segment is advancing at a 5.78% CAGR on the strength of superior wash-fastness, an attribute prized by premium folding-carton users who require graphics to survive recycling. According to fiber-specific trials, cotton-fiber-rich specialty grades register dye uptake of 41.45% with reactivatives versus 35.68% for other chemistries.
Suppliers reduce typical reactive-bath temperatures from 90 °C to 60 °C without sacrificing fixation, lowering energy loads, and broadening adoption in mills constrained by decarbonization targets. Direct dyes remain a staple because they attach readily under neutral pH, but their market share is gradually ceded to higher-value chemistries that align with circular-economy mandates.
By Origin: Synthetic Dominance Faces Organic Challenge
Synthetic molecules still generated 69.64% of 2025 revenue, a testament to their broad chromatic range and competitive cost profile. Petroleum-derived intermediates benefit from global, integrated supply chains that stabilize pricing. However, organic entrants grow 6.96% annually as carbon-reduction commitments cascade across the FMCG and retail sectors. Pine-cone extracts rich in tannins now yield stable beige and brown shades suitable for tissue and kraft linings, offering biogenic carbon credits to converters.
Early-stage hybrid routes that blend lignin fractions with synthetic anchors deliver the color strength of azo dyes while cutting fossil feedstock intensity by 30%, aligning with scope-3 reduction targets of major packaging buyers. As supply scales, cost parity is expected within the decade, narrowing the premium gap currently limiting penetration.
By Application: Packaging Segment Drives Dual Leadership
Packaging captured 44.62% of 2025 revenue and is projected to post the fastest 6.62% CAGR, underscoring its central role in absorbing production from mills that retool away from declining graphic papers. Brand owners require shelf-ready displays and corrugated mailers with photorealistic imagery, a specification that favors high-gamut liquid systems. Graphic-paper volumes remain significant but continue their secular downtrend, while specialty niches such as moisture-indicator labels secure higher unit values but limited tonnage.
Tissue and hygiene papers in the “others” bucket gain from demographic expansion in South-East Asia and Africa, yet CAGR remains modest relative to the e-commerce packaging boom. Functional dyes that confer antimicrobial or odor-control benefits are gaining traction in tissue, creating incremental, innovation-driven demand within this segment.
Geography Analysis
Asia-Pacific retained leadership with 44.25% of 2025 revenue and is forecast to rise at a 5.56% CAGR to 2031, reflecting its status as a global manufacturing nucleus and fast-expanding consumer market. China’s chemical champions—Hengli, Wanhua, and peers—channel government incentives into fine-chemical projects that lift regional self-sufficiency. Vietnam, hosting 7,500 textile enterprises employing 4.3 million workers, boosts regional consumption of corrugated and specialty papers, translating into higher local dye usage.
North America ranks second by value, propelled by e-commerce fulfillment growth and aggressive plastic-reduction pledges from food and beverage multinationals. Archroma’s South Carolina site and Solenis’s Virginia complex provide localized supply, while regulatory clarity on PFAS pushes converters to adopt compliant, water-based systems. Although graphic-paper contraction tempers total tonnage, premium-grade orders that favor environmentally optimized dyes support above-inflation price realization.
Europe grapples with stringent REACH amendments and pulp-price volatility—Northern Bleached Softwood Kraft touched EUR 1,380 / t in April 2024—pressuring operating margins. Yet the bloc’s leadership in circular-economy regulation and R&D funding for lignin-derived colorants positions local suppliers at the forefront of high-value, eco-optimized offerings. Converters invest in closed-loop water treatment to meet discharge permits, raising demand for low-salt, high-exhaustion dyes that align with zero-liquid-discharge ambitions.

Competitive Landscape
The paper dyes market remains moderately fragmented. Archroma fortified its position by acquiring Huntsman Textile Effects, gaining technology synergies and a broader customer base in textile and paper circuits. European incumbents have consolidated to counter volume pressure from Asian suppliers, while mid-tier specialists carve niches in food-grade and security-print formulations.
Technology is a key differentiator: firms that commercialize nano-encapsulated and lignin-based systems win contracts with brand owners seeking circular credentials. Investments in regional technical-service labs help deepen mill relationships, reducing churn and enabling co-development of customized shades. Start-ups leverage computational-chemistry platforms to shorten development cycles and to model hue stability under alkaline recycling conditions, giving them latitude to compete despite limited scale.
Paper Dyes Industry Leaders
Archroma
BASF
Kemira Oyj
Atul Ltd.
DyStar Singapore Pte Ltd
- *Disclaimer: Major Players sorted in no particular order

Recent Industry Developments
- August 2023: Archroma has certified a range of dyes for compostable paper. Selected colorants from the Carta, Cartasol F, and Cartafix lines address the increasing demand for environmentally friendly coloration in the paper industry.
- August 2023: Vipul Organics Limited launched a range of dispersions and dyes for the paper industry. The company also established a state-of-the-art R&D laboratory for the paper segment at its Ambernath facility.


Research Methodology Framework and Report Scope
Market Definitions and Key Coverage
Our study defines the paper dyes market as all synthetic and naturally derived colorants intentionally introduced into the wet-end stock or size press of paper and paperboard so the final sheet attains uniform shade, strength, and fastness. The assessment spans liquid and powder formulations across acidic, basic, direct, sulfur, and specialty chemistries, valued at end-manufacturer transfer price.
Scope exclusion: pigments, optical brightening agents, and dyes sold solely for non-paper substrates are outside the boundary.
Segmentation Overview
- By Form
- Powder
- Liquid
- By Type
- Acidic
- Basic
- Direct
- By Origin
- Organic
- Synthetic
- By Application
- Printing and Writing
- Packaging
- Specialty
- Others (Tissue and Hygiene)
- By Geography
- Asia-Pacific
- China
- India
- Japan
- South Korea
- Rest of Asia-Pacific
- North America
- United States
- Canada
- Mexico
- Europe
- Germany
- United Kingdom
- France
- Italy
- Rest of Europe
- South America
- Brazil
- Argentina
- Rest of South America
- Middle East and Africa
- Saudi Arabia
- South Africa
- Rest of Middle East and Africa
- Asia-Pacific
Detailed Research Methodology and Data Validation
Primary Research
Interviews and structured questionnaires with production managers at mills in China, Finland, Brazil, and the United States, alongside distributors and technology chemists, helped us verify dosage norms, liquid-to-powder substitution, and emerging bio-based demand. These conversations closed data gaps from desk work and let us refine assumptions on application mix and average selling prices.
Desk Research
Mordor analysts began with public datasets such as FAOSTAT pulp output, CEPI annual statistics, Eurostat PRODCOM paper tables, the American Forest & Paper Association mill survey, and UN Comtrade HS-3204 shipment trails. These series outline tonnage flows, trade lanes, and price shifts, which we then mapped to typical shade-on-tone loading factors. We enriched fundamentals with corporate filings, investor decks, and trade journals like Pulp & Paper International, while D&B Hoovers, Dow Jones Factiva, and Volza supplied hard numbers on supplier revenues, mill expansions, and cross-border dye consignments. The examples above are illustrative; many additional sources were consulted for completeness and cross-checks.
Market-Sizing & Forecasting
We applied a top-down construct. Global production of printing and writing, packaging, tissue, and specialty grades in 2024 was paired with region-specific shade penetration and dye loading rates, generating an addressable volume pool that was multiplied by verified ASPs to reach the 2025 value. Bottom-up sense-checks rolled up sampled sales of leading suppliers, distributor channel checks, and packaging converter usage audits, allowing calibrated adjustments where variances exceeded ±7 percent. Key model drivers include paper tonnage growth, e-commerce parcel expansion, average dye dosage per tonne, ASP trajectories by chemistry, regulatory shifts on plastic bans, and mill capacity utilization. A multivariate regression framework, supplemented by scenario analysis for pulp-price shocks, projects the market through 2030.
Data Validation & Update Cycle
Outputs undergo anomaly screening, senior analyst peer review, and variance reconciliation against independent signals before sign-off. Reports refresh once each year, with interim revisions triggered by material events; a final pre-publication check assures clients receive the latest view.
Why Mordor's Paper Dyes Baseline Inspires Confidence
Published figures often vary because firms adopt different scope lines, refresh cadences, and dye loading assumptions.
By anchoring totals to verified pulp tonnage, region-specific penetration, and live ASP feedback, Mordor provides a balanced, transparent baseline.
Benchmark comparison
| Market Size | Anonymized source | Primary gap driver |
|---|---|---|
| USD 1.21 B (2025) | Mordor Intelligence | - |
| USD 1.16 B (2024) | Regional Consultancy A | Relies mainly on secondary desk sources and updates biennially |
| USD 1.10 B (2023) | Global Consultancy A | Excludes liquid concentrates and applies constant ASP across regions |
| USD 1.28 B (2025) | Trade Journal B | Bundles basic dyes with other colorants; forecasts via straight-line growth |
The comparison shows that differences arise chiefly from product boundary choices, update frequency, and price treatment.
By combining current primary insights with consistent top-down logic, Mordor delivers a dependable starting point for strategic decisions.


Key Questions Answered in the Report
What is the current Paper Dyes Market size?
The paper dyes market stands at USD 1.26 billion in 2026 and is projected to reach USD 1.54 billion by 2031.
Which segment leads the paper dyes market by application?
Packaging dominates with 44.62% revenue share in 2025 and is expanding at a 6.62% CAGR through 2031.
Why are liquid dyes gaining traction in papermaking?
Liquid formulations offer dust-free handling, compatibility with high-speed digital printers, and stable viscosity, enabling converters to reduce downtime and waste.
Which region shows the fastest growth in the paper dyes market?
Asia-Pacific leads with a 5.56% CAGR, driven by its manufacturing base, rising e-commerce volumes, and supportive government policies.
Page last updated on:


