
Infusion Management Market Size and Share
Market Overview
| Study Period | 2020 - 2031 |
|---|---|
| Market Size (2026) | USD 51.44 Billion |
| Market Size (2031) | USD 75.74 Billion |
| Growth Rate (2026 - 2031) | 8.05 % |
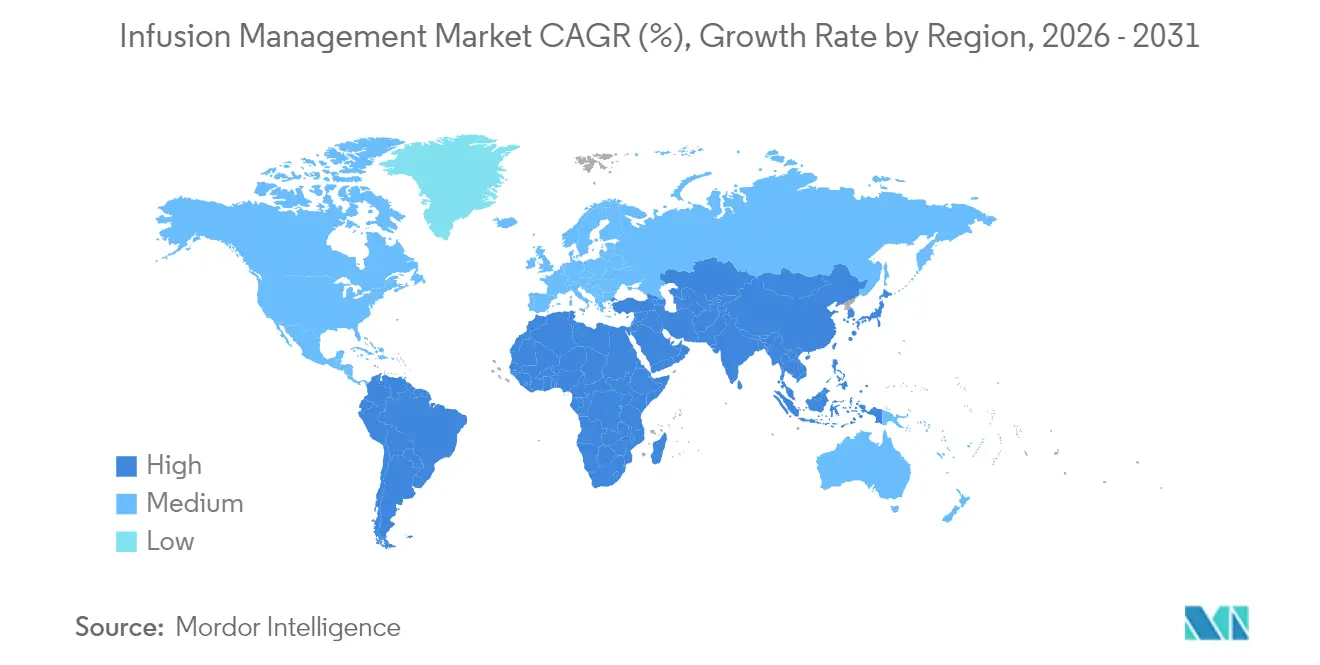
| Fastest Growing Market | Asia Pacific |
| Largest Market | North America |
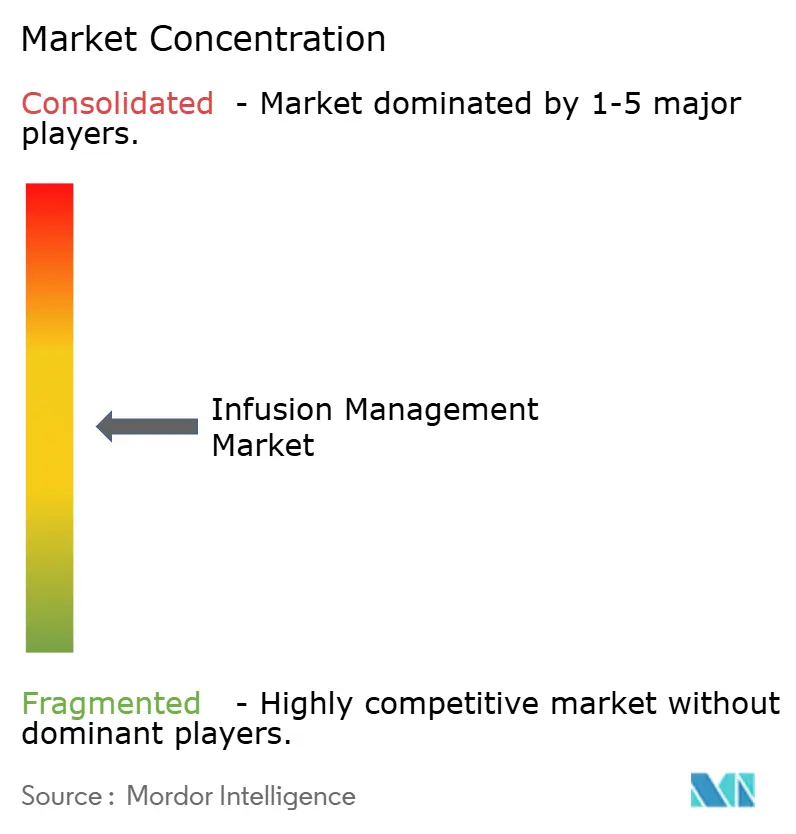
| Market Concentration | Medium |
Major Players *Disclaimer: Major Players sorted in no particular order Image © Mordor Intelligence. Reuse requires attribution under CC BY 4.0. | |
Infusion Management Market Analysis by Mordor Intelligence
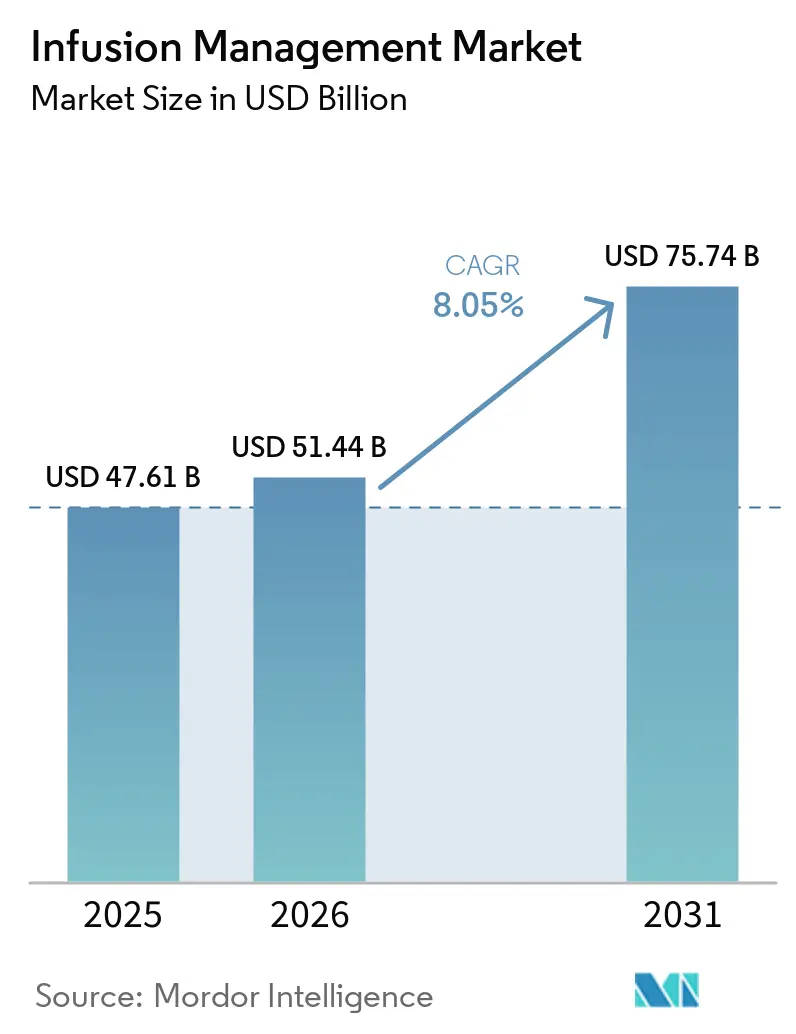
The Infusion Management market size is expected to grow from USD 47.61 billion in 2025 to USD 51.44 billion in 2026 and is forecast to reach USD 75.74 billion by 2031 at 8.05% CAGR over 2026-2031.
Growth is anchored in the rapid roll-out of smart, connected pumps that cut medication errors, support chronic-disease care, and conform to interoperability mandates. Hospital workforce shortages, payer push-backs on inpatient costs, and stricter cybersecurity rules further accelerate adoption. Connected devices already lower high-risk medication errors by 16% in real-world studies, spurring volume growth across antibiotics, oncology, and diabetes therapies. Competitive strategies focus on artificial-intelligence algorithms, cloud-ready interfaces, and accessory ecosystems that lock in recurring revenue. Simultaneously, supply-chain fragility and semiconductor shortages threaten delivery schedules, forcing vendors to localize production and invest in dual-sourcing programs.
Key Report Takeaways
- By product type, volumetric pumps led with 39.02% of the Infusion management market share in 2025, while implantable pumps are advancing at a 10.12% CAGR through 2031.
- By therapy type, antibiotics accounted for 22.12% of the Infusion management market size in 2025; chemotherapy/oncology is forecast to expand at a 13.24% CAGR to 2031.
- By application, oncology held 36.21% of the Infusion management market size in 2025, yet diabetes management is set to grow at 14.83% CAGR between 2026-2031.
- By end user, hospitals and clinics captured 58.22% revenue share in 2025; homecare settings record the highest projected CAGR at 11.56% through 2031 .
- By geography, North America dominated with 39.11% share in 2025, whereas Asia-Pacific is climbing fastest at 9.42% CAGR to 2031.
Note: Market size and forecast figures in this report are generated using Mordor Intelligence’s proprietary estimation framework, updated with the latest available data and insights as of 2026.
Market Trends and Insights
Drivers Impact Analysis of Infusion Management Market*
| Driver | (~) % Impact on CAGR Forecast | Geographic Relevance | Impact Timeline |
|---|---|---|---|
| Rising prevalence of chronic diseases | +1.8% | North America, Europe, global spill-over | Long term (≥ 4 years) |
| Growing demand for ambulatory & home infusion | +2.1% | North America, EU, expanding into Asia-Pacific | Medium term (2-4 years) |
| Shift toward smart-connected pumps | +1.5% | Global, led by developed markets | Medium term (2-4 years) |
| Expansion of outpatient centers in emerging markets | +1.2% | Asia-Pacific core, Middle East & Africa spill-over | Long term (≥ 4 years) |
| Pump-EMR interoperability mandates | +0.9% | North America, EU | Short term (≤ 2 years) |
| Drug-device kits for biologics | +1.0% | Developed markets | Medium term (2-4 years) |
| Source: Mordor Intelligence | |||
Rising Prevalence of Chronic Diseases
Chronic illnesses such as diabetes, cancer, and Parkinson’s disease are expanding the candidate pool for continuous and programmable infusion therapy. Diabetes alone affects 537 million adults and necessitates precise insulin and GLP-1 biologic delivery. Smart infusion platforms integrate dose-error-reduction software, cutting high-risk medication errors from 45 to 25 per 100 infusions, a 44% improvement that meets tighter safety benchmarks.[1]Mary A. Dolansky, “Reduction in High-Risk Medication Errors After Smart Pump Adoption,” Journal of Patient Safety, journals.lww.comThe FDA clearance of a wearable apomorphine pump for Parkinson’s disease shows the appetite for patient-controlled devices that enable mobility and reduce clinic visits. Demand is especially strong in aging populations across the United States, Germany, and Japan, while lifestyle-related conditions spur uptake in India and Brazil. As a result, health systems are standardizing on enterprise-wide pump fleets that share drug libraries and analytics dashboards. Over the long term, chronic-disease dynamics are expected to add 1.8 percentage points to the Infusion management market CAGR.
Growing Demand for Ambulatory & Home-Based Infusion Therapy
Site-of-care migration is moving therapies from hospital outpatient departments to stand-alone centers and living rooms. Ambulatory infusion centers reported 48% year-on-year growth in rheumatology treatments, achieving per-episode savings of 30-50% versus inpatient administration. Technology is reshaping workflows: portable pumps with 12-hour batteries, LTE connectivity, and simplified touch screens reduce patient training to minutes. Baxter’s elastomeric portfolio already delivers 4.5 million infusions per year outside hospitals, underscoring scale. Medicare’s expanded home-infusion benefit further accelerates adoption, though payment updates lag specialty-drug price climbs. COVID-19 validated remote monitoring, with nurses shortening handling time by 4.06 minutes per infusion thanks to connected dashboards. Mid-term impact adds 2.1 percentage points to growth as payers intensify cost-reduction programs.
Technological Shift Toward Smart-Connected Pumps
Hospitals are replacing legacy gravity sets with infusion systems that combine IoT modules, RFID drug recognition, and AI-driven decision support. Drug-library compliance rose from 33% to 98% after implementation, while programming corrections fell from 0.36% to 0.06%. Sensors capture heart-rate signals with 94% accuracy and auto-regulate drip speed at 98% precision, enhancing real-time titration. BD’s HemoSphere Alta monitors cerebral autoregulation and predicts hypotension events using machine-learning algorithms, positioning the firm for high-acuity settings.[2]BD Investor Relations, “BD Q2 2025 Earnings Release,” bd.com Draft FDA guidance on AI in medical devices, published 2025, clarifies validation pathways and is expected to shorten approval cycles. Smart-pump penetration boosts efficiency, supports remote updates, and is forecast to contribute 1.5% points to the Infusion management market CAGR over the next four years.
Rapid Expansion of Outpatient Infusion Centers in Emerging Markets
Asia-Pacific hospitals face rising demand for biologics and specialty drugs absent adequate inpatient capacity. Purpose-built centers slash medication-prep errors by 54% using barcode verification and standardized protocols.[3]B. Braun Medical Inc., “DUPLEX — Ready-to-Use Drug Delivery,” bbraunusa.com Global pharma firms are co-locating distribution hubs to support just-in-time biologics supply, easing cold-chain constraints. Over the long term, these factors add 1.2 percentage points to growth, particularly in India, Indonesia, and the Gulf states.
Restraints Impact Analysis of Infusion Management Market*
| Restraint | (~) % Impact on CAGR Forecast | Geographic Relevance | Impact Timeline |
|---|---|---|---|
| High capital & maintenance cost of smart pumps | -1.4% | Global, greater in small and mid-size facilities | Medium term (2-4 years) |
| Regulatory recalls & cybersecurity risks | -0.8% | Global, stringent in US and EU | Short term (≤ 2 years) |
| Semiconductor shortages | -1.1% | North America, Europe | Short term (≤ 2 years) |
| Sustainability pressure on single-use PVC | -0.6% | EU, North America, expanding worldwide | Long term (≥ 4 years) |
| Source: Mordor Intelligence | |||
High Capital & Maintenance Cost of Next-Generation Pumps
Enterprise roll-outs can top USD 2.5 million, factoring in Wi-Fi upgrades, cybersecurity software, and staff accreditation. Annual maintenance contracts add 8-10% of capital cost, straining community hospitals and providers in middle-income economies. FDA cybersecurity rules compel secure software development life-cycles and vulnerability patching, embedding further cost. Leasing programs from InfuSystem and others reduce upfront spend but lift lifetime expenditure. The net effect subtracts 1.4% points from the CAGR as smaller buyers delay refresh cycles.
Regulatory Recalls & Cybersecurity Vulnerabilities
In 2025 the FDA flagged 3,698 Nimbus ambulatory pumps for battery failures and flow inaccuracies, disrupting clinical schedules and denting buyer confidence. Smartphone-linked diabetes pumps missed critical alerts, raising hypoglycemia risk. Such events trigger fleet quarantine, replacement freight, and retraining, with downstream liability exposure. Vendors must therefore beef up quality-management systems and real-time threat monitoring. These pressures shave 0.8 percentage points from the Infusion management market growth over the short term.
*Our forecasts treat driver/restraint impacts as directional, not additive. The impact forecasts reflect baseline growth, mix effects, and variable interactions.
Infusion Management Market Segment Analysis
By Product Type:
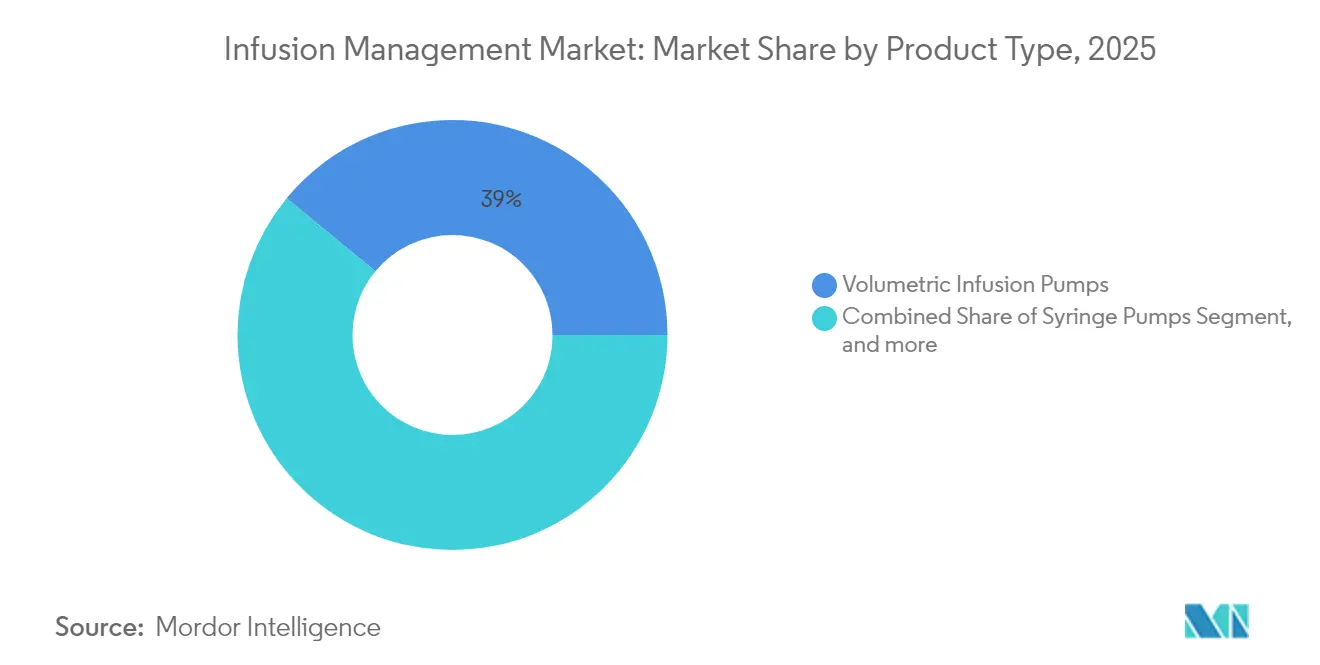
Volumetric Pumps Drive Market While Implantables Lead InnovationVolumetric pumps represented 39.02% of the Infusion management market size in 2025, underpinned by universal compatibility with high-flow therapies in emergency and critical-care units. Hospitals favor these devices for integrated drug libraries, large LCD interfaces, and proven reliability. Syringe pumps remain indispensable in neonatal and oncology wards where milliliter-level precision is vital. Disposable sets, pressure sleeves, and filter accessories form a stable annuity stream, often bundled in multi-year service contracts.
Implantable pumps, though niche in unit terms, post a robust 10.12% CAGR and are reshaping pain management, oncolytic therapy, and spasticity treatment. Programmable reservoirs allow month-long dosing schedules, driving patient adherence and cutting clinic visits by 60%. Vendors co-design drug-device combos with pharma partners, embedding telemetry that reports reservoir levels to cloud dashboards. The shift toward fully internalized systems aligns with payer goals to curb readmissions and with patient preference for unobtrusive treatment. Collectively, these forces keep the Infusion management market deployment roadmap centered on modular, software-defined hardware that scales across acuity levels.



By Therapy Type:
Antibiotics Lead Volume While Oncology Drives GrowthAntibiotics account for 22.12% of the Infusion management market share in 2025 as hospitals combat resistant organisms and sepsis cases. Smart pumps enforce extended-infusion protocols, optimizing pharmacodynamics and shortening length of stay. Dose-error-reduction software cut incorrect vancomycin rates by 38%, according to multi-center audits.
Looking ahead, oncology therapies claim the steepest value upside with a 13.24% CAGR. Biologic monoclonal antibodies require controlled flow and inline temperature conditioning, capabilities delivered by next-gen peristaltic modules. In the infusion pumps and accessories market, the area benefits from robust reimbursement policies, an increasing prevalence of chronic diseases that require infusion therapy, and a growing demand for home healthcare solutions. Oncology centers are standardizing closed-system transfer devices to guard staff from cytotoxic exposure, boosting accessory sales. Meanwhile, diabetes therapies blend insulin infusion with continuous glucose data streams and closed-loop algorithms, expanding the Infusion management market to the overlapping digital-health universe. Combined, these trends broaden the therapy mix, reduce idle pump time, and diversify revenue away from a single source.
By Application:
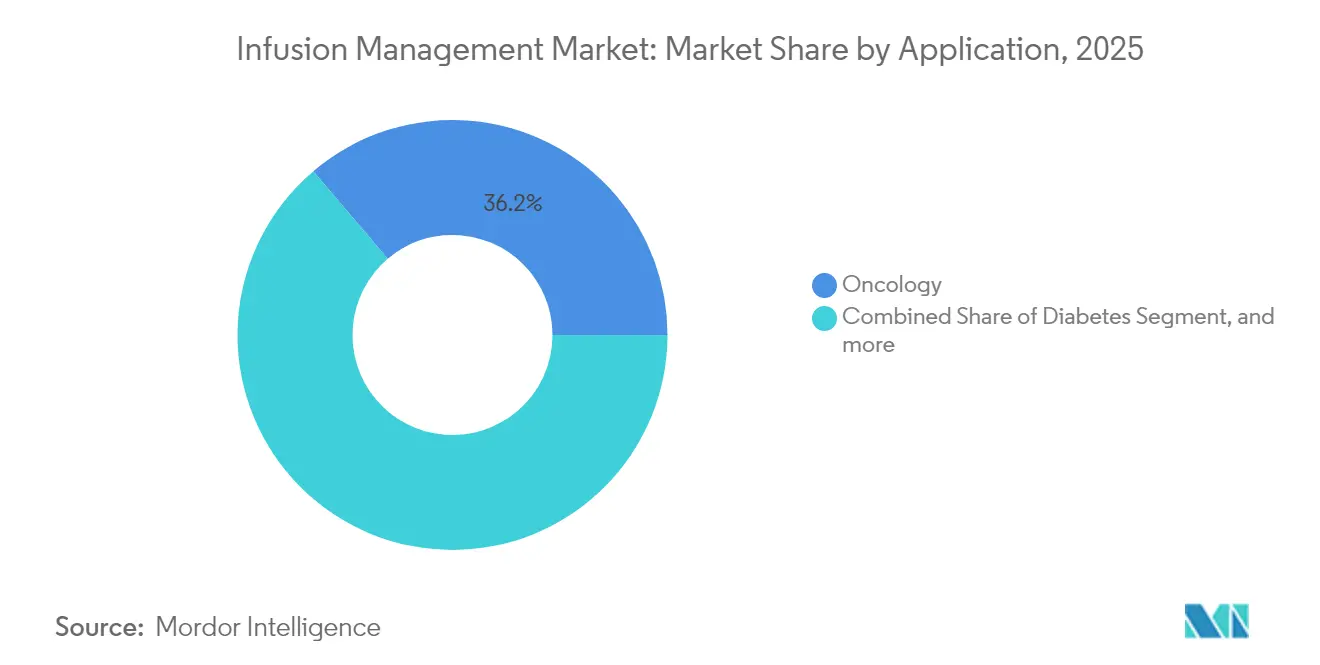
Oncology Dominance Faces Diabetes DisruptionOncology held 36.21% of the Infusion management market size in 2025. Multi-drug regimens often run sequentially over several hours, requiring safety interlocks that only connected systems provide. Dedicated cancer centers use analytics dashboards to flag occlusions and air-in-line events, trimming nurse response time by 22% in pilot studies.
Diabetes management, projected at 14.83% CAGR, sits at the convergence point of infusion therapy and wearable sensors. Closed-loop insulin pumps adapt flow rates every five minutes, feeding anonymized datasets into cloud AI engines for pattern recognition. FDA approval cycles have shortened thanks to predicate devices and real-world evidence, inviting consumer-electronics entrants and raising competitive intensity. Pain management and gastroenterology inject steady volume, but big gains lie in combo products for Parkinson’s, multiple sclerosis, and rare diseases, creating a long runway for the Infusion management market.
By End User:
Hospital Dominance Erodes as Homecare AcceleratesHospitals and clinics control 58.22% of revenue because they house the sickest patients, manage complex pharmacotherapy, and must meet Joint Commission safety metrics. Purchasing consortia lock in three- to five-year agreements that include staff certification, software updates, and spare-part pools. However, reimbursement reforms are capping inpatient infusion margins, nudging providers to shift low-acuity treatments offsite.
Homecare is rising at 11.56% CAGR as IoT-enabled pumps report vitals, reservoir levels, and adherence to cloud portals viewed by clinicians. Pilot programs reduced unplanned hospital readmissions by 17%, satisfying value-based purchasing criteria. Technology vendors are embedding voice-guided setup and color-coded lines to cut caregiver error. Pharmacies are positioning as logistics hubs, assembling kits and dispatching last-mile couriers under cold-chain compliance. This hybrid ecosystem is expanding total addressable demand and stretching the definition of the Infusion management market well beyond hospital walls.
Geography Analysis
North America Infusion Management Market
North America generated the largest revenue slice in 2025, claiming 39.11% of the Infusion management market. Health systems benefit from commercial insurance that reimburses smart-pump premiums, while federal agencies push for cybersecurity compliance and EHR integration. Major integrated-delivery networks have already refreshed 70% of fleets to interoperable platforms, creating a replacement cycle every 7-8 years. The US also leads in AI algorithm validation, aided by FDA’s pre-cert programs that expedite software updates.
Europe Infusion Management Market
Europe ranks second, supported by universal coverage and procurement frameworks that emphasize value and post-market surveillance. Germany, France, and the Nordics favor vendor-neutral interoperability, spurring open-API pump designs. EU regulations on DEHP and single-use plastics fast-track green product variants, influencing global design roadmaps. Brexit-related divergence in UK approvals introduces modest complexity yet does not slow overall adoption.
APAC, LATAM and Middle East Infusion Management Market
Asia-Pacific drives the fastest expansion at 9.42% CAGR. China’s tier-2 cities, the Indian private hospital segment, and ASEAN medical hubs are modernizing infusion infrastructure, aided by government incentives for digital health. Domestic manufacturers in China and South Korea are entering mid-tier price bands, raising competitive stakes. Australia and Japan, classified as mature markets, pivot to home-care models that mirror US site-of-care shifts. Regional variance in reimbursement and cyber rules requires vendors to tailor SKUs and software modules, but the upside far exceeds these hurdles. Latin America and the Middle East trail yet offer pockets of double-digit growth in private oncology and transplant centers, rounding out the global footprint of the Infusion management market.

Regulatory Landscape
Infusion pumps are regulated as medical devices with heightened scrutiny tied to safety, software, and post-market surveillance. In the United States, infusion pumps fall under FDA Class II (21 CFR 880.5725), and the agency maintains an Infusion Pumps Total Product Life Cycle guidance that shapes premarket submission expectations and lifecycle controls for these systems.
In Europe, market access is governed by the EU Medical Devices Regulation (MDR), where conformity is supported by adherence to harmonised standards and updated listings published through Commission Implementing Decisions. In June 2026, the European Commission issued Implementing Decision (EU) 2026/1231, amending the MDR harmonised standards list and reinforcing the need for manufacturers to keep technical documentation aligned for presumption of conformity. Product-level access signals also matter in this environment, including KORU Medical receiving EU MDR certification in March 2026 for its Freedom60 and FreedomEDGE infusion systems. Safety and performance requirements continue to be anchored by standards such as IEC 60601-2-24:2021 for infusion pumps and controllers.
Competitive Landscape
The Infusion management market shows moderate concentration, with the top five players controlling significant share in the global revenue. Becton Dickinson, Baxter International, and ICU Medical dominate large-volume pumps, leveraging decades-long installed bases and multi-layer customer-support networks. Their R&D budgets prioritize AI modules, drug-recognition scanners, and secure firmware that meets forthcoming regulations. BD’s Q2 2025 earnings revealed double-digit Alaris growth and USD 2.5 billion earmarked for US manufacturing that hedges geopolitical risk.
Midsize innovators such as ICU Medical are carving niches via Plum Solo and Plum Duo precision pumps cleared by the FDA in April 2025. These devices target ambulatory and specialty-drug settings with modular connectivity and high drug-library capacity. B. Braun and Fresenius Kabi compete on closed-system transfer devices and DEHP-free disposables, aligning portfolios with sustainability mandates. Emerging Asian vendors leverage cost advantages but must clear high cybersecurity and interoperability bars to win Tier-1 hospital deals.
M&A activity intensifies as adjacent med-tech firms seek infusion capabilities. Nordson’s USD 460-per-share buyout of Atrion introduces fluid-delivery know-how to its components lineup. Boston Scientific’s purchase of Intera Oncology gives it a foothold in hepatic artery infusion, expanding cross-sell opportunities. Stryker’s USD 4.9 billion acquisition of Inari Medical in January 2025 extends its vascular armamentarium into thrombus management, complementing infusion thrombolytics. Cyber resilience becomes a key differentiator, prompting alliances with cybersecurity firms for continuous penetration testing and over-air patch deployment. Collectively, these dynamics cement a competitive field where scale, software prowess, and regulatory foresight determine long-term survivability.
Infusion Management Industry Leaders
McKesson Corporation
Becton, Dickinson and Company
Terumo Medical Corporation
Medtronic
Polymedicure Ltd.
- *Disclaimer: Major Players sorted in no particular order
Infusion Management Market Companies Covered in this Report
- Beckton Dickinson
- Baxter
- B. Braun
- ICU Medical
- Fresenius
- Terumo
- Medtronic
- Mindray
- Moog
- Insulet
- Tandem Diabetes Care
- Nipro
- Micrel Medical Devices
- Ypsomed
- Codan Medical
- WalkMed Infusion LLC
- Mckesson
- Roche
- Smiths Group
- Polymedicure Ltd.

Market Opportunities and Future Outlook
Interoperability and enterprise workflow integration are becoming a practical differentiator, since pump-EMR connectivity requires both technical integration and hospital resource commitment, while also showing measurable operational and safety impact. In June 2026, a large academic health system reported that smart infusion pump-EMR interoperability reduced medication safety alerts across multiple categories (hard limit, soft limit, and SSRC alerts), which supports bidirectional integration decisions, centralized drug library governance, and analytics-driven fleet standardization.
Manufacturing resiliency and consumables availability also present a recurring commercial opportunity as providers and vendors respond to supply fragility and sustainability-related material changes, including non-DEHP direction. In July 2026, Otsuka ICU Medical LLC announced a USD 500 million expansion of U.S. IV solutions manufacturing, including a new 500,000-square-foot facility in Austin, Texas, aimed at improving higher availability and product mix shifts. On the device side, added capacity can support growth in home and ambulatory care models, as illustrated by ViCentra beginning commercial-scale production of Kaleido insulin patch pump consumables in May 2026 and tripling capacity to serve an established user base.
Recent Industry Developments in Infusion Management Market
- April 2026: BD announced the U.S. commercial launch of the BD CentroVena One Insertion System for central venous catheter insertion after receiving FDA 510(k) clearance. The system was also accepted into the FDA Safer Technologies Program (STeP), reinforcing BD's positioning around safer vascular access workflows that sit upstream of infusion therapy delivery.
- May 2025: BD confirmed a USD 2.5 billion U.S. manufacturing investment while reporting double-digit growth for the Alaris infusion system within its Q2 FY2025 update. The manufacturing commitment supports supply resilience for installed-base refresh cycles and helps reduce delivery risk amid component constraints affecting connected pump fleets.
- April 2025: ICU Medical received FDA clearance for the Plum Solo and Plum Duo precision IV pumps. The clearances strengthen ICU Medical's competitive stance in safety-focused, connectivity-ready pump platforms targeting ambulatory and specialty infusion settings.


Infusion Management Market Report Scope and Research Methodology
Market Definition and Coverage
For this study, the infusion management market covers the tools and software used to deliver and control IV infusions, mainly infusion pump systems, related disposables, and connected dose safety and monitoring functions across care settings.
Scope exclusions: Standalone injectable drugs, elastomeric single use balloon infusers, and pure home infusion nursing services are not counted in this market value.
Segments Covered in This Report
- By Product Type
- Volumetric Infusion Pumps
- Syringe Pumps
- Ambulatory Infusion Pumps
- Insulin Pumps
- Enteral Infusion Pumps
- Implantable Infusion Pumps
- Patient-Controlled Analgesia Pumps
- Accessories & Disposables
- By Therapy Type
- Antibiotics
- Antimicrobial
- Pain Management
- Enteral Nutrition
- Chemotherapy / Oncology
- Parenteral Nutrition
- Diabetes Management
- Other Therapies
- By Application
- Oncology
- Diabetes
- Gastroenterology
- Pain Management
- Pediatrics & Neonatology
- Hematology
- Critical Care
- Others
- By End User
- Hospitals & Clinics
- Ambulatory Surgical Centers
- Homecare Settings
- Specialized Infusion Centers
- Others
- By Geography
- North America
- United States
- Canada
- Mexico
- Europe
- Germany
- United Kingdom
- France
- Italy
- Spain
- Rest of Europe
- Asia-Pacific
- China
- Japan
- India
- Australia
- South Korea
- Rest of Asia-Pacific
- Middle East & Africa
- GCC
- South Africa
- Rest of Middle East & Africa
- South America
- Brazil
- Argentina
- Rest of South America
- North America
Data Sources, Market Sizing, and Validation
Desk Research
Desk research started with public healthcare and trade statistics to set the demand context, using sources like CDC disease burden tables, OECD health indicators, and WHO health data where infusion therapy volumes were discussed. We also reviewed US FDA databases for device clearances and safety alerts, plus clinical publications in peer reviewed journals to understand adoption drivers such as dose error reduction and smart pump interoperability.
To translate this into measurable market inputs, we used US Centers for Medicare and Medicaid Services utilization signals, national statistical offices for hospital activity and aging population trends, and trade association publications covering IV therapy and medication safety. Company annual reports, investor presentations, and press releases were used to map product mix and regional exposure, and we also used paid subscriptions for company financials and intelligence, patent databases, and an import export shipment level database for directional cross checks. These are illustrative sources, and additional public references were also used during data collection, validation, and clarification.
Primary Interviews and Surveys
Primary work was used to pressure test the size model with hospital pharmacy teams, biomedical engineering staff, infusion therapy clinicians, distributors, and device OEM facing roles. Because this is a global market, interviews were balanced across APAC, EMEA, and the Americas so differences in purchasing cycles, installed base upgrades, and software attach rates could be reflected, then reconciled with desk inputs.
Distribution of primary research fieldwork respondents
| Company type | Respondent position | Region |
|---|---|---|
| Top tier: 29% | CXOs: 18% | APAC: 49% |
| Mid tier: 49% | Functional/Unit leaders: 30% | EMEA: 29% |
| Smaller Players: 22% | Managers: 52% | Americas: 22% |
Market-Sizing & Forecasting
Sizing was built using a top down structure where the addressable infusion therapy footprint is reconstructed from healthcare delivery volumes, device penetration, and replacement behavior, then converted into revenue using representative pricing bands. The totals were corroborated using selective bottom-up approximations, including sampled supplier revenue mapping by geography, channel checks on pump and consumable mix, and sanity checks on implied units times ASP outcomes.
Key inputs used in the model include the installed base of infusion pumps by care setting, replacement cycles and upgrade timing to smart pumps, consumable usage intensity (administration sets and related disposables) per patient day, software adoption and attach rates for dose error reduction features, and regional pricing differences driven by tendering and hospital procurement norms. Where the bottom-up checks had gaps, we used conservative interpolation based on comparable countries with similar hospital bed density and care mix, then rechecked the implied per bed spending with interview feedback.
For forecasting, scenario analysis was applied around adoption speed of connected infusion platforms and the pace of hospital digitization, followed by an ARIMA based time series check on historical growth patterns so short term swings did not get overstated. Final growth paths were reviewed against primary feedback on budget cycles, regulatory attention on medication safety, and expected product refresh waves.
Data Validation & Update Cycle
Outputs were validated through multiple cross checks so the final number stayed consistent with real world signals such as hospital capacity trends, device replacement timing, and procurement seasonality. Variances were flagged when regional totals implied unrealistic spend per bed, or when software revenue shares moved outside what interviews supported, and those points were reworked before sign off.
A second analyst review is completed to confirm that assumptions, math, and definitions are applied consistently across countries and years. The report is refreshed annually, with interim updates when material events affect pricing, supply continuity, or regulatory direction. Before delivery, a final pass is done to ensure the most recent public updates and expert feedback are reflected.
Mordor Intelligence's Infusion Management Market Size Compared Against Other Published Estimates
Published market sizes for infusion management can look far apart because groups sometimes count different things under the same label, and the base year and currency timing are not always aligned. Differences also show up when one estimate mixes infusion devices with infusion services, or when software and connected monitoring are treated as separate adjacent markets.
The main gap drivers here are scope boundaries (devices and related disposables versus infusion service delivery), how the installed base and replacement cycle are modeled, and whether software attach rates are treated as optional add ons or as bundled system revenue. Another common source of spread comes from using older price points and not updating for tender driven ASP changes, which can move a global total meaningfully even when unit assumptions are similar.
Benchmark comparison
| Source | Market Size | Gaps in Research Methodology |
|---|---|---|
| Mordor Intelligence | USD 51.44 B (2026) | |
| Industry Research Publisher A | USD 3.02 B (2024) | The figure is materially lower because it appears to focus on a narrower definition of infusion management, likely emphasizing software or a limited product subset, and it also uses an earlier base year that does not capture the later cycle of smart pump upgrades. |
| Healthcare Analytics Outlet B | USD 48.37 B (2025) | This estimate tracks infusion services across sites of care, so it captures provider delivered infusion revenue rather than device, disposable, and platform sales, which changes what is being measured and how pricing is constructed. |
The table shows that most of the spread is explained by whether the number represents service delivery revenue or the device plus consumable system that enables infusion therapy, and by the year used to anchor pricing and adoption. By keeping the model tied to pump installed base, replacement timing, and disposables intensity, and by excluding pure nursing service revenue, the scope difference becomes clear. That is why the 2026 value is higher here, and it is treated this way by Mordor Intelligence.


Key Questions Answered in the Report
What is the current size of the infusion management market?
The market stands at USD 51.44 billion in 2026 and is forecast to reach USD 75.74 billion by 2031.
Which product segment dominates the infusion management market?
Volumetric pumps lead with a 39.02% share in 2025 thanks to broad clinical applicability and established hospital procurement cycles.
Why is Asia-Pacific the fastest-growing region?
Healthcare infrastructure investment, chronic-disease prevalence, and regulatory harmonization lift Asia-Pacific growth to a 9.42% CAGR through 2031.
How are smart pumps enhancing patient safety?
Connected systems cut high-risk medication-error rates by 44% and enable real-time monitoring that shortens nursing response times.
What challenges could slow market growth?
High capital outlays, semiconductor shortages, sustainability mandates on PVC, and cybersecurity compliance can constrain near-term adoption.
Page last updated on:


 Your data is secure and never sold or shared.


