
Intravenous Infusion Pump Market Size and Share
Market Overview
| Study Period | 2020 - 2031 |
|---|---|
| Market Size (2026) | USD 10.34 Billion |
| Market Size (2031) | USD 14.67 Billion |
| Growth Rate (2026 - 2031) | 7.25 % |
| Fastest Growing Market | Asia Pacific |
| Largest Market | North America |
| Market Concentration | Medium |
Major Players *Disclaimer: Major Players sorted in no particular order Image © Mordor Intelligence. Reuse requires attribution under CC BY 4.0. | |
Intravenous Infusion Pump Market Analysis by Mordor Intelligence
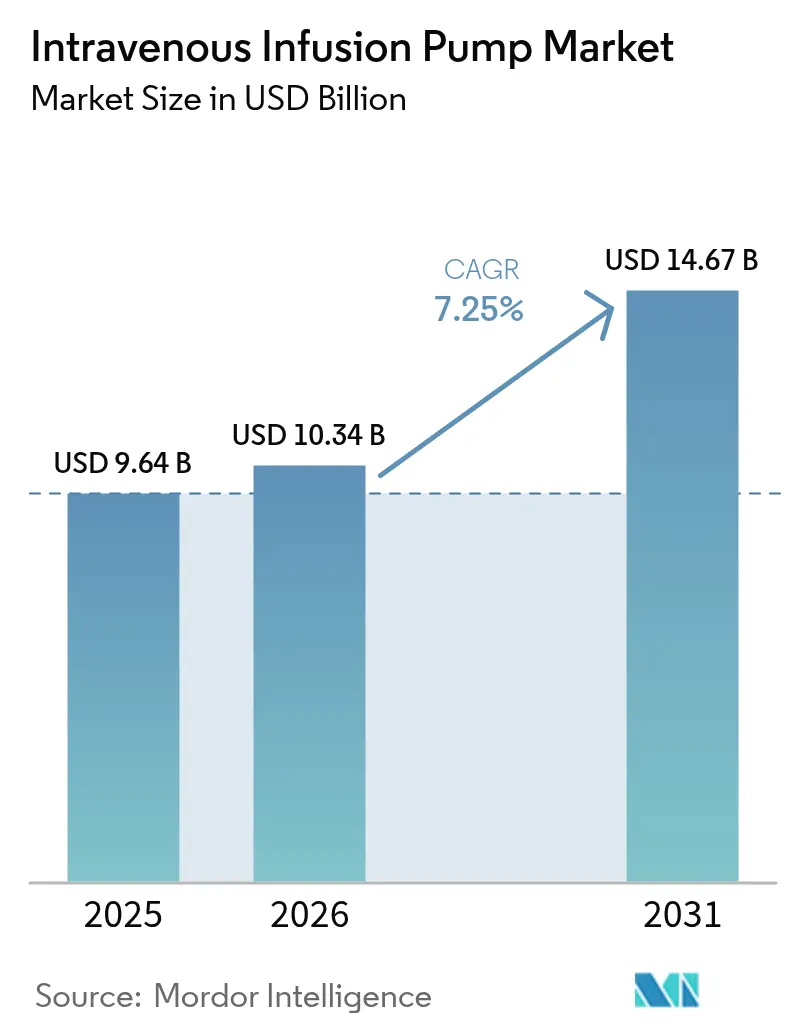
Intravenous Infusion Pump market size in 2026 is estimated at USD 10.34 billion, growing from 2025 value of USD 9.64 billion with 2031 projections showing USD 14.67 billion, growing at 7.25% CAGR over 2026-2031.
The intravenous infusion pump market continues to pivot away from gravity-fed systems toward smart, software-driven platforms that synchronize with electronic medical records and employ artificial intelligence for dose optimization. Aging populations, wider chronic disease prevalence, and the push for digitized, value-based healthcare collectively fuel sustained demand across hospitals, ambulatory centers, and home settings. Adoption in the home environment is rising fastest, helped by cloud-linked monitoring that keeps patients safely on therapy while cutting readmissions. North America remains the primary commercial theater, yet Asia’s accelerating infrastructure buildout is beginning to reshape procurement priorities and competitive focus. Supply chain risk surfaced when Hurricane Helene disrupted a key facility, prompting providers to diversify sourcing and prompting manufacturers to regionalize production footprints.
Key Report Takeaways
- By product type, volumetric pumps led with 36.12% of intravenous infusion pump market share in 2025, while smart/connected pumps are projected to expand at a 13.07% CAGR through 2031.
- By application, oncology and chemotherapy commanded 29.20% share of the intravenous infusion pump market size in 2025 and are expected to progress at an 8.26% CAGR to 2031.
- By end user, hospitals held 61.74% of the intravenous infusion pump market in 2025, whereas home care is set to post the highest 11.09% CAGR through 2031.
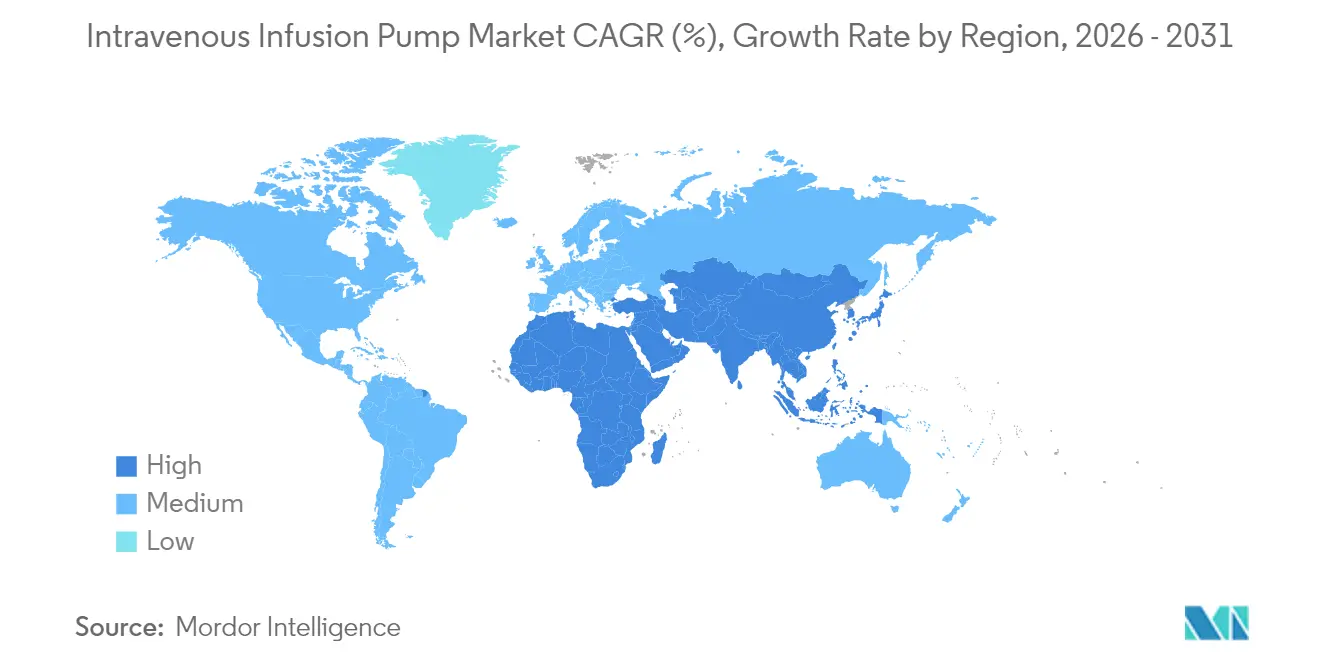
- By geography, North America retained 38.30% revenue share in 2025; Asia-Pacific is forecast as the quickest-growing region at a 9.66% CAGR through 2031.
Note: Market size and forecast figures in this report are generated using Mordor Intelligence’s proprietary estimation framework, updated with the latest available data and insights as of 2026.
Market Trends and Insights
Drivers Impact Analysis of Intravenous Infusion Pump Market*
| Driver | (~) % Impact on CAGR Forecast | Geographic Relevance | Impact Timeline |
|---|---|---|---|
| Rising prevalence of chronic diseases | +1.8% | Global, centered in North America & Europe | Long term (≥ 4 years) |
| Adoption of home and alternate-site infusion therapy | +2.1% | North America & EU lead, APAC emerging | Medium term (2-4 years) |
| EMR-integrated smart pumps | +1.5% | North America & EU core, spill-over to APAC | Medium term (2-4 years) |
| Healthcare infrastructure growth in emerging markets | +1.2% | APAC core, MEA & Latin America follow | Long term (≥ 4 years) |
| Rising use of specialty biologics | +0.9% | Global, early adoption in developed markets | Long term (≥ 4 years) |
| Increased venture funding and innovation | +0.6% | North America & EU, expanding to APAC | Short term (≤ 2 years) |
| Source: Mordor Intelligence | |||
Rising Prevalence of Chronic Diseases
Escalating global incidence of diabetes, cancer, and other long-duration illnesses is transforming medication delivery expectations across the intravenous infusion pump market. More than 537 million adults lived with diabetes in 2024, driving continuous insulin infusion demand that links pump accuracy to real-time glucose readings. Oncology protocols now depend on programmable pumps that adjust flow rates in seconds, ensuring chemotherapeutics remain within tight therapeutic windows while minimizing drug wastage. Device makers are embedding sensors that track heart-rate variability and other biomarkers so algorithms can dynamically shift infusion profiles without clinician intervention. These incremental safeguards not only reduce adverse events but also differentiate premium product lines in price-sensitive tender processes. Manufacturers advancing predictive-analytics firmware position themselves to capture emerging service revenues as health systems move toward outcome-based purchasing models.[1]Xiang-Wei Zhang and Ming Li, “Adaptive Rate Control in Smart Infusion Pumps,” Technology and Health Care, technologyandhealthcare.org
Adoption of Home and Alternate-Site Infusion Therapy
Policy incentives that reward reduced inpatient length of stay, combined with widening patient acceptance, place home infusion at the core of future growth. Clinical studies report 100% satisfaction among home users of smart pumps, with patients resolving 97% of alarms on their own, underscoring usability advances that allow complex regimens to leave the ward safely.[2]Anna Brown et al., “Patient Experiences With Home-Based Infusion Therapy,” Journal of Infusion Nursing, journals.infusionnursing.com Battery-powered, lightweight devices calibrated for multi-day operation enable chemotherapy, parenteral nutrition, and antibiotic therapy outside hospitals. In parallel, tele-consult portals feed continuous pump data to clinicians who can intervene early, avoiding costly readmission episodes. Regulatory agencies now release tailored guidance for non-institutional use, shortening clearance timelines for portable systems furnished with lock-out features, tamper-evident cartridges, and instructional interfaces written for laypersons.
Integration with Electronic Medical Records (EMR) with Smart Pump
Hospitals that deployed EMR-integrated pumps cut manual keystrokes by 86% and generated USD 370,000 of incremental revenue in eight months through automated charge capture.[3]Kristine Biltoft and Beth Finneman, “Economic Outcomes of EMR-Integrated Infusion Pumps,” American Journal of Health-System Pharmacy, ashp.org Bidirectional messaging populates pump parameters from physician orders while logging live infusion data back to the chart, closing documentation gaps that once exposed providers to compliance penalties. Barcode medication administration now verifies drug-to-patient matching at the bedside, eliminating frequent programming errors. For critical care teams administering vasopressors or titratable analgesics, the technology saves cumulative minutes per patient each shift, translating to measurable labor productivity gains. Momentum builds as health system executives prioritize digital maturity metrics tied to reimbursement, positioning the intravenous infusion pump market for multi-year software-upgrade cycles.
Healthcare Infrastructure Growth in Emerging Markets
Governments in China, India, Indonesia, and the Gulf states are erecting new tertiary hospitals and refurbishing provincial clinics, thereby unlocking sizeable tenders for both basic volumetric units and latest-generation smart pumps. Public procurement frameworks increasingly stipulate domestic content thresholds, prompting global brands to forge local manufacturing joint ventures that trim import duties and accelerate regulatory approval. Medical tourism inflows to Thailand, Malaysia, and the United Arab Emirates create additional pull for devices certified to international standards yet competitively priced. Training academies run by manufacturers now complement government nursing-skill programs, assuring that clinical staff can operate advanced systems with confidence. Over the long horizon, these investments reinforce a virtuous circle in which installed-base growth spurs service contract demand, enlarging lifetime revenue per pump.
Restraints Impact Analysis of Intravenous Infusion Pump Market*
| Restraint | (~) % Impact on CAGR Forecast | Geographic Relevance | Impact Timeline |
|---|---|---|---|
| High Capital and Maintenance Costs of Smart Pumps | -1.4% | Global, particularly affecting emerging markets | Long term (≥ 4 years) |
| Cybersecurity and Product Recall Risks | -0.8% | Global, with heightened focus in North America & EU | Medium term (2-4 years) |
| Stringent Regulatory Oversight | -0.6% | Global, with strictest requirements in North America & EU | Long term (≥ 4 years) |
| Supply Chain Disruptions | -0.4% | Global, with critical impact on North America | Short term (≤ 2 years) |
| Source: Mordor Intelligence | |||
High Capital and Maintenance Costs of Smart Pumps
Smart pumps range from USD 3,000 to USD 15,000 per unit, and many providers must also budget 10-15% of purchase price annually for service. When hospitals operate on thin operating margins, finance committees often delay upgrades, sustaining demand for stripped-down volumetric models that still meet minimum safety regulations. Total ownership calculations must factor staff training, software licenses, and replacement batteries, which collectively extend the payback horizon beyond three years for many community facilities. Group purchasing organizations negotiate lower list prices, yet adoption gaps persist in low-resource geographies. Manufacturers strive to soften barriers through leasing programs and step-wise upgrade paths that allow basic devices to receive connectivity modules later when budgets allow.
Cybersecurity and Product Recall Risks
Connected pumps expose hospitals to potential wireless intrusions that could alter drug libraries or disrupt operation. Regulatory bodies now insist on secure boot loaders, encrypted firmware, and life-cycle patch plans before granting clearance. High-profile Class I recalls in 2024 involving battery defects and software malfunctions led to inpatient therapy interruptions and increased legal exposure. Procurement teams therefore scrutinize vendor vulnerability-management procedures as closely as flow-rate accuracy claims. Device makers respond with third-party penetration testing and bug-bounty programs to reassure buyers. While added safeguards raise R&D and compliance costs, they are essential to maintain confidence in an interconnected care environment.
*Our forecasts treat driver/restraint impacts as directional, not additive. The impact forecasts reflect baseline growth, mix effects, and variable interactions.
Intravenous Infusion Pump Market Segment Analysis
By Product Type:
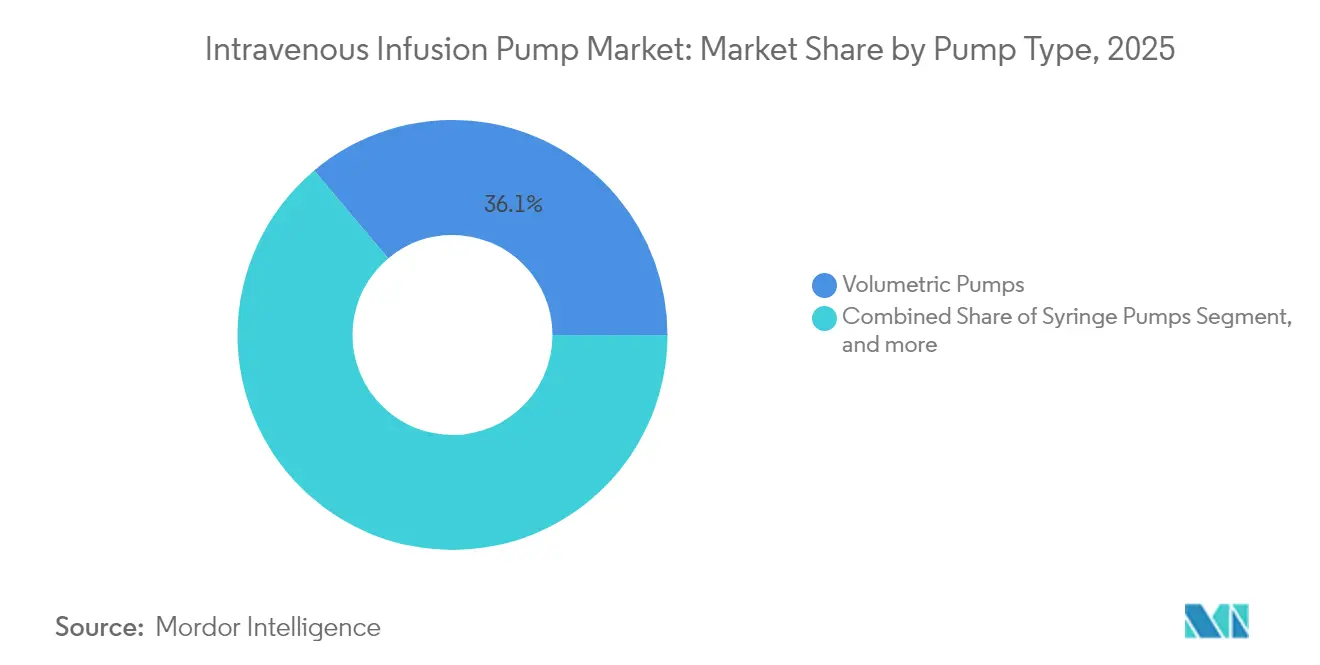
Smart Connectivity Drives Premium Segment GrowthVolumetric units accounted for 36.12% of intravenous infusion pump market share in 2025, reaffirming their versatility for maintenance fluids, antibiotics, and blood products. The intravenous infusion pump market size for volumetric devices reached USD 3.48 billion in 2025 and is forecast to expand at a steady pace as replacement cycles align with tightened alarm-management standards. Hospitals value their robust build and straightforward user interface, especially in high-acuity wards. Nevertheless, smart pumps equipped with Wi-Fi and bidirectional EMR links are projected to post a vigorous 13.07% CAGR, reflecting mounting pressure to capture infusion data in real time. Integration enables centralized drug-library updates, lowering medication error incidence and aligning nurse workflows with digital charting mandates.
Platform evolution now emphasizes modularity. Vendors market controllers that accept volumetric, syringe, and PCA modules, thereby trimming staff training hours and sparing biomedical teams from maintaining multiple device families. Portable units gain traction among ambulatory surgery centers and home infusion providers that require lightweight designs attentive to patient mobility. Implantable pumps, though niche, fill critical roles in chronic pain and intrathecal chemotherapeutic delivery. Enteral pumps, while outside the parenteral domain, share core engineering know-how, allowing manufacturers to leverage common supply chains. Such synergies support margin defense amid rising component costs and cybersecurity compliance spend across the intravenous infusion pump market.



By Application:
Oncology Dominance Reflects Treatment ComplexityOncology held the top spot at 29.20% of the intravenous infusion pump market in 2025 and is also the fastest-growing segment, advancing at an 8.26% CAGR through 2031. That dominance rests on escalating adoption of dose-dense protocols and antibody drug conjugates that require programmable flow rates to mitigate infusion reactions. The intravenous infusion pump market size for oncology reached USD 2.81 billion in 2025, and health systems continue to prioritize pumps with closed-system transfer compatibility. Syringe-based chemotherapy lines depend on micro-accuracy, often down to 0.1 mL increments, while volumetric versions facilitate hydration and adjunct therapies.
Analgesia follows as clinicians migrate from intermittent bolus to patient-controlled paradigms that reduce nursing workload and support enhanced recovery pathways. Parenteral nutrition relies on multi-channel systems that deliver amino acids, lipids, and trace elements concurrently over 24-hour periods. Pediatric and neonatal care introduce constraints around dead-space volume and occlusion sensitivity, steering demand toward advanced sensors capable of detecting sub-milliliter shifts. Endocrinologists managing brittle diabetes leverage infusion architecture compatible with continuous glucose data streams, inching toward automated insulin delivery loops within acute care settings. Whether treating cancers or GI disorders, stakeholders demand unified software libraries that minimize training variation and ensure compliance with high-alert medication safeguards.
By End User:
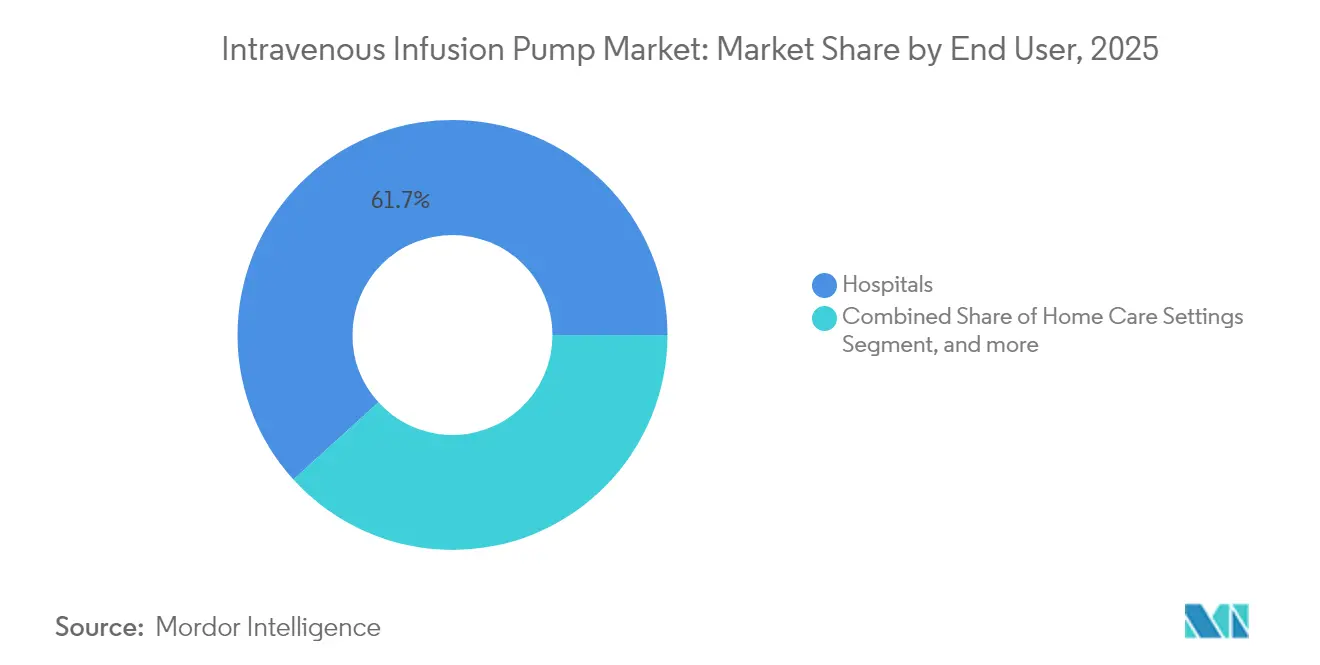
Home Care Transformation Reshapes Market DynamicsHospitals remained primary purchasers, accounting for 61.74% of revenue in 2025, yet adoption curves flatten as many systems complete fleet upgrades. Attention therefore shifts to alternative sites that promise growth and margin resilience for the intravenous infusion pump market. The home segment is projected to climb at 11.09% CAGR, reflecting payer directives that reward therapy in the least-costly environment. This shift encourages device engineers to prioritize visual cues, intuitive touch screens, and multilingual instruction sets to empower non-professional caregivers. Telehealth dashboards allow infusion nurses to supervise dozens of patients concurrently, triaging alerts by severity and scheduling field visits only when warranted.
Ambulatory surgery and oncology centers extend the outpatient footprint, offering same-day procedures backed by hospital-grade safety profiles. Specialty infusion clinics handle complex biologics and antibiotics on a chronic basis, frequently bundling pump rental fees into per-therapy pricing structures. These providers demand rapid swap-out service contracts to avoid treatment delays. Consequently, manufacturers diversify revenue through logistics, training, and remote technical support, cushioning unit-sale volatility. Regulators, for their part, continue to fine-tune home infusion guidelines to balance patient empowerment with risk management, reinforcing a hybrid care continuum that underpins recurring demand.
Geography Analysis
North America Intravenous Infusion Pump Market
North America secured 38.30% of global revenue in 2025, a position attributed to reimbursement models that finance smart pump rollouts and clinical guidelines that prescribe dose-error-reduction software for high-risk medications. The region also benefits from vigorous enforcement of post-market surveillance, which weeds out substandard imports and rewards vendors able to document cybersecurity resilience. Consolidation among health systems yields larger, multi-site tenders, creating leverage for suppliers that can supply integrated product portfolios, training, and analytics services under a single contract.
APAC Intravenous Infusion Pump Market
Asia-Pacific’s intravenous infusion pump market is advancing at a 9.66% CAGR, underpinned by national healthcare modernization drives and burgeoning medical tourism. China’s “Made in China 2025” program and India’s production-linked incentives foster local assembly partnerships that compress lead times and sidestep tariffs. Hospitals in Thailand, Malaysia, and the Philippines increasingly adopt internationally accredited oncology protocols, drawing overseas patients and elevating device expectations. Competitive pricing remains vital, yet buyers emphasize after-sales service networks capable of supplying spare parts and bilingual training to sustain uptime.
EMEA and South America Intravenous Infusion Pump Market
Europe maintains a sizeable installed base despite slower growth, benefitting from harmonized Medical Device Regulation across most member states. The United Kingdom’s distinct post-Brexit pathway creates dual-compliance complexity, yet novel approval routes occasionally shorten timelines for suppliers targeting NHS trusts. Middle East and Africa exhibit low but rising penetration rates as oil-rich Gulf Cooperation Council nations invest in tertiary oncology centers equipped with US or EU-certified IV pumps. South America’s recovery from prior recessions reopens procurement budgets for both public and private hospitals seeking to replace aging volumetric fleets with networkable models.

Regulatory Landscape
Intravenous infusion pumps are regulated as medical devices with heightened scrutiny for software, connectivity, and performance. In the United States, infusion pumps are generally Class II devices under 21 CFR 880.5725 and commonly use the FDA 510(k) pathway; alternate controller enabled (ACE) pumps are addressed under 21 CFR 880.5730 with special controls that emphasize performance verification such as basal and bolus accuracy. The FDA also applies a Total Product Life Cycle (TPLC) approach for infusion pumps, reinforcing expectations around design controls, risk management, and post-market surveillance for networked systems.
In Europe, market access is governed by Regulation (EU) 2017/745 (EU MDR), with the consolidated text updated as of January 1, 2026. Post-market requirements are increasingly prescriptive, including proactive surveillance and incident management aligned with MDCG 2025-10 guidance. Standards activity also shapes design and accessory choices, such as EN ISO 80369-1:2026 (June 2026) for small-bore connectors, which can influence connector architectures and administration set compatibility decisions for manufacturers selling across regions.
Value Chain Analysis
The value chain starts with electronics and precision-mechatronic inputs, including microcontrollers, sensors, ASICs, motors, and batteries, along with plastics, housings, and disposable administration-set interfaces. Device OEMs handle system design and software development (dose error reduction software, connectivity modules, cybersecurity features), then complete verification and validation activities needed for Class II compliance under 21 CFR 880.5725/880.5730 and alignment to FDA infusion pump TPLC expectations. In the United States, the FDA Quality Management System Regulation (QMSR) alignment to ISO 13485:2016 (effective 2024) tightens quality requirements across design, production, and distribution, raising documentation and supplier controls throughout the chain.
Manufacturing and final assembly typically concentrate in established medical-device hubs (including the United States, Germany, China, and Mexico), while critical subcomponents are often sourced across East Asia (for example, Taiwan, Japan, South Korea, and parts of Southeast Asia). Distribution moves through direct hospital sales, tenders and group purchasing organizations, and home-infusion providers that also require logistics, training, and field service coverage. Bottlenecks center on limited-source ASICs and flow sensors, alongside software assurance activities (cybersecurity testing, patch processes, and validation), which increases lead-time sensitivity and pushes OEMs toward dual sourcing and more regionalized production footprints.
Competitive Landscape
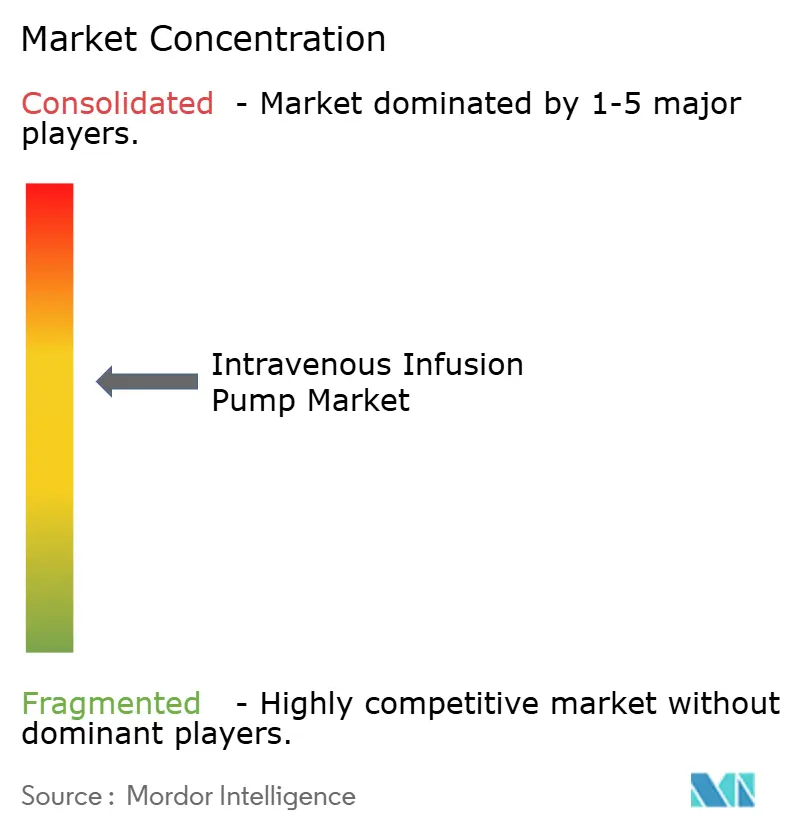
The intravenous infusion pump industry remains moderately fragmented, with about a dozen manufacturers crowding the upper revenue tiers. Baxter International leverages a broad clinical evidence base and long-standing GPO contracts. ICU Medical notably reinforcing its standing through battery improvements and syringe-pump library expansion. While no single firm commands double-digit dominance, early adoption of cybersecurity-certified firmware and cloud-based analytics is creating brand stickiness that could tilt future tenders.
Strategic thrusts now revolve around unified platforms. Vendors aim to integrate large-volume, syringe, and PCA modules under one controller to streamline training, inventory, and software validation cycles for hospitals that routinely manage thousands of units. Partnerships with EMR providers enable turnkey interoperability bundles, reducing IT integration overhead for customers. Start-ups, meanwhile, concentrate on AI-driven dosing algorithms that predict occlusions or air-in-line events before alarms trigger, offering resilience boosts sought by critical care teams.
Supply chain diversification rose to board-level priority after Hurricane Helene curtailed 60% of US IV fluid output at a single North Carolina site. Larger manufacturers now dual-source plastics and PCB assemblies across continents to buffer climate or geopolitical shocks. Cybersecurity incidents and subsequent recalls have reinforced risk-sharing clauses in service contracts, prompting device makers to invest heavily in penetration testing and white-hat hacking initiatives. Looking ahead, market leaders capable of marrying safety, connectivity, and lifecycle service promises will consolidate mindshare among heavyweight purchasers in the intravenous infusion pump market.
Intravenous Infusion Pump Industry Leaders
B. Braun Melsungen AG
Becton, Dickinson and Company
IRadimed Corporation
Baxter International Inc.
ICU Medical, Inc.
- *Disclaimer: Major Players sorted in no particular order
Intravenous Infusion Pump Market Companies Covered in this Report
- B. Braun
- Baxter
- Beckton Dickinson
- ICU Medical
- Smiths Group
- Terumo
- Mindray
- Fresenius
- Medtronic
- IRadimed
- Moog
- Zyno Medical
- Micrel Medical Devices
- Advanced Instrumentations
- InfuSystem Holdings Inc.
- Sino Medical-Device Technology
- Plenum Tech Pvt Ltd
- Nipro
- JMS
- Q-Core Medical

Market Opportunities and Future Outlook
A key whitespace area is interoperability paired with clinical workflow automation. Evidence from hospital deployments shows EMR-integrated pumps can reduce manual keystrokes by 86% and improve charge capture, which creates procurement triggers for bidirectional pump-EHR integration and standardized drug-library management at scale. As adoption varies by health system, suppliers that bundle interoperability services (interfaces, validation, and ongoing library governance) with unified pump platforms can expand beyond hardware into recurring software and service revenues.
Regulatory and product-architecture changes also create room for software-forward, updatable pump platforms. In the United States, Class II pathways under 21 CFR 880.5725 and 21 CFR 880.5730 (ACE pumps) are increasingly paired with structured lifecycle change management for software, supported by FDA 510(k) clearances that include Predetermined Change Control Plans (PCCP) for ACE pump software updates, such as Beta Bionics receiving 510(k) clearance for the iLet ACE Pump in April 2026. At the same time, heightened attention to post-market surveillance under EU MDR and MDCG 2025-10, plus connector safety requirements such as EN ISO 80369-1:2026, supports demand for compliance-ready designs, cybersecurity maintenance programs, and validated accessory ecosystems that lower hospital risk and simplify multinational deployments.
Recent Industry Developments in Intravenous Infusion Pump Market
- March 2026: IRadimed Corporation commercially launched the 3870 MRI-compatible infusion pump system. The rollout expands MRI-safe infusion workflows across US hospitals where conventional pumps are restricted, supporting deployments in imaging suites and helping standardize MRI-compatible fleets.
- November 2025: Duncan Regional Hospital became the first US facility to implement BD Alaris EMR interoperability with the MEDITECH electronic health record system. The deployment provides a reference site for pump-to-EHR integration, reinforcing interoperability as a procurement criterion alongside pump hardware performance.
- April 2024: Baxter received US FDA 510(k) clearance for its Novum IQ large-volume infusion pump (SYR) featuring Dose IQ Safety software. The clearance expanded Baxter's smart pump portfolio and strengthened its positioning around dose-error reduction and software-enabled safety in hospital purchasing cycles.


Intravenous Infusion Pump Market Report Scope and Research Methodology
Market Definition and Coverage
For this methodology, the market covers powered devices that deliver drugs, fluids, blood products, or parenteral nutrition into a vein in controlled doses across clinical and home settings. Revenue is counted at the device level and is measured in current USD for each year.
Scope exclusions: We exclude enteral, epidural, and subcutaneous infusion products, along with single use elastomeric balloons and aftermarket tubing or catheters.
Segments Covered in This Report
- By Type
- Volumetric Pumps
- Syringe Pumps
- Patient-Controlled Analgesia (PCA) Pumps
- Portable Pumps
- Implantable Pumps
- Enteral Pumps
- Insulin IV Pumps
- Smart/Connected IV Pumps
- By Application
- Oncology & Chemotherapy
- Analgesia
- Parenteral Nutrition
- Gastroenterology
- Pediatrics
- Hematology
- Diabetes Management
- By End User
- Hospitals
- Home Care Settings
- Ambulatory Surgical & Oncology Centers
- Specialty Clinics
- By Geography
- North America
- United States
- Canada
- Mexico
- Europe
- Germany
- United Kingdom
- France
- Italy
- Spain
- Rest of Europe
- Asia-Pacific
- China
- Japan
- India
- Australia
- South Korea
- Rest of Asia-Pacific
- Middle East & Africa
- GCC
- South Africa
- Rest of Middle East & Africa
- South America
- Brazil
- Argentina
- Rest of South America
- North America
Data Sources, Market Sizing, and Validation
Desk Research
Desk work started with public, checkable sources that explain installed base, use patterns, and safety requirements for infusion devices. We relied on sources such as the US FDA device databases and safety communications, the US CDC for hospital care utilization context, OECD health statistics for spending and care delivery mix, and World Bank indicators for macro normalization by country. We also used clinical literature from peer reviewed journals to understand infusion workflows, error reduction trends, and adoption of smart pump features.
To convert those signals into market inputs, we pulled company filings, annual reports, and investor presentations to map product portfolios and where revenues sit by geography or care setting when available. For cross checks, a paid subscription for company financials and intelligence was used to standardize entity structures and to avoid double counting where businesses have multiple subsidiaries. This desk source list is illustrative only, and many other public and paid references were used for data collection, validation, and clarification during the study.
Primary Interviews and Surveys
Primary inputs were gathered through expert interviews and short surveys across the value chain, including device makers, distributors, hospital procurement, biomedical engineering teams, and clinicians who use pumps daily. We used these discussions to validate price bands, replacement cycles, smart pump penetration, and the pace of adoption in hospitals versus ambulatory and home care, and then to reconcile any desk based gaps by region.
Distribution of primary research fieldwork respondents
| Company type | Respondent position | Region |
|---|---|---|
| Top tier: 39% | CXOs: 12% | APAC: 42% |
| Mid tier: 40% | Functional/Unit leaders: 28% | EMEA: 35% |
| Smaller Players: 21% | Managers: 60% | Americas: 23% |
Market-Sizing & Forecasting
Sizing was built using a top-down approach where hospital activity and infusion intensity signals are used to reconstruct the demand pool, and then converted into device spend using adoption and replacement assumptions. Country totals were shaped using indicators such as inpatient and outpatient procedure volumes, ICU and general bed capacity, chronic disease burden that drives infusion therapies, and the share of care delivered in home settings. Price inputs were handled as blended ASP ranges by pump category and region, which were adjusted for known pricing pressure from tenders and group purchasing, and then checked against what buyers and channel participants described.
Selective bottom-up approximations were used to corroborate the totals, including roll ups of leading suppliers where public revenue splits were available, and sampled ASP times shipment volume estimates from distributor and hospital channel checks. When a specific country lacked usable inputs, we filled gaps by using proxy markets with similar care delivery mix, and then scaled using hospital capacity and spending indicators before being validated again through interviews. For forecasting, scenario analysis was applied with a base case that reflects expected smart pump penetration, replacement timing after major safety alerts, and the mix shift toward ambulatory and home care, and then it was stress tested with faster and slower adoption cases shared by respondents.
Data Validation & Update Cycle
Validation was done through repeated triangulation across demand signals, supplier disclosures, and primary feedback, which helped flag country level outliers early. Analysts ran variance checks on ASP movements, unit growth versus hospital activity, and regional shares versus independent healthcare spending signals, and then reviewed the drivers behind any unusual jumps before sign-off. If the model output conflicted with what buyers or clinicians were seeing, respondents were re-contacted to confirm whether it was a definition issue, a timing shift, or a localized shortage.
Reports are refreshed annually, and interim updates are made when a material event changes pricing, availability, or utilization patterns. Before delivery, a final pass is completed so the year, currency conversions, and key assumptions reflect the latest available public releases and fresh interview feedback.
Mordor Intelligence's Intravenous Infusion Pump Market Size Versus Other Published Estimates
Published numbers for intravenous infusion pumps often do not match because teams choose different product boundaries and then apply different pricing and currency timing choices across countries. Differences also come from whether the estimate is anchored to a demand pool (hospital activity and care setting mix) or mainly built from supplier side disclosures.
In practice, the spread is usually driven by what is counted as an IV pump versus an adjacent infusion category, and how ASP progression is handled as smart features become more common. When FX rates are applied at different points in the year and when price bands are not rechecked after tender cycles, totals can move a lot even if unit demand looks similar, which is why the refresh cadence and validation checks matter for keeping the number stable and explainable in Mordor Intelligence.
Benchmark comparison
| Source | Market Size | Gaps in Research Methodology |
|---|---|---|
| Mordor Intelligence | USD 10.34 B (2026) | |
| Industry Publisher A | USD 6.72 B (2025) | Uses a different base year and appears to bundle adjacent pump types, which can pull the IV-only boundary and pricing mix away from a like-for-like device revenue view. |
| Global Publisher B | USD 7.12 B (2026) | Focuses on a narrower set of pump types and therapy uses, and the approach disclosed suggests less emphasis on re-validating blended ASP ranges by region after procurement-driven price resets. |
The table shows that year choice, category inclusion, and how prices are refreshed are the main reasons totals differ. By tying the model to clear demand indicators, and then rechecking price and mix assumptions through interviews before finalizing, we keep the estimate traceable to simple steps that can be repeated when new signals appear.


Key Questions Answered in the Report
What is the current size of the intravenous infusion pump market?
The intravenous infusion pump market stands at USD 10.34 billion in 2026 and is projected to reach USD 14.67 billion by 2031.
Which application segment is growing fastest?
Oncology and chemotherapy lead growth, advancing at an 8.26% CAGR thanks to complex dosing needs that favor programmable smart pumps.
How quickly is home infusion expanding?
Home care settings are registering an 11.09% CAGR through 2031 as payers and patients embrace treatment outside traditional hospitals.
Why are smart pumps preferred over gravity systems?
Smart pumps deliver precise, programmable flow rates, integrate with EMRs for automatic documentation, and reduce medication errors.
What regions offer the highest growth potential?
Asia-Pacific is forecast as the quickest-growing geography with a 9.66% CAGR, driven by infrastructure investment and medical tourism.
How are manufacturers addressing cybersecurity risks?
Vendors now embed encrypted firmware, secure boot processes, and continuous patch programs, and they submit devices to third-party penetration testing to meet evolving regulatory requirements.
Page last updated on:


 Your data is secure and never sold or shared.


