Market Overview
| Study Period | 2020 - 2031 |
|---|---|
| Forecast Data Period | 2026 - 2031 |
| Base Year Market Size (2025) | USD 58.12 Billion |
| Market Size (2026) | USD 60.55 Billion |
| Market Size (2031) | USD 74.31 Billion |
| Growth Rate (2026 - 2031) | 4.81% CAGR |
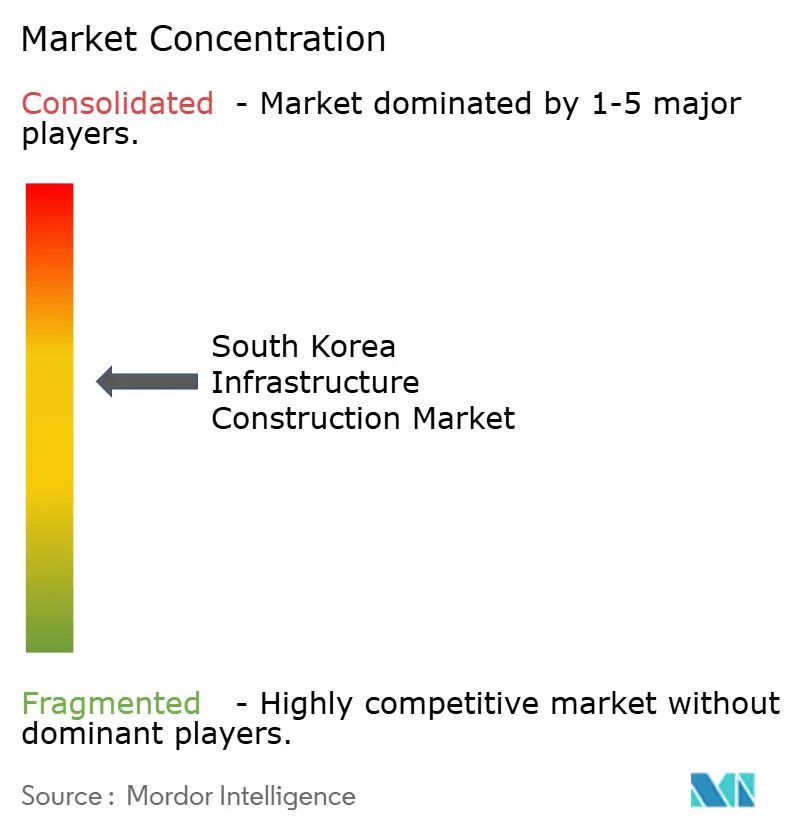
| Market Concentration | Medium |
Major Players *Disclaimer: Major Players sorted in no particular order Image © Mordor Intelligence. Reuse requires attribution under CC BY 4.0. | |

South Korea Infrastructure Construction Market Analysis by Mordor Intelligence
The South Korea Infrastructure Construction Market size is expected to increase from USD 58.12 billion in 2025 to USD 60.55 billion in 2026 and reach USD 74.31 billion by 2031, growing at a CAGR of 4.81% over 2026-2031.
Seoul’s policy agenda puts rail, smart-city, and carbon-neutral assets at the center of public spending, while standardized public-private partnership (PPP) contracts draw fresh private capital. Aging assets are being upgraded under the Korean New Deal’s Green Remodeling program, creating a second wave of renovation work alongside new rail corridors that extend the Korea Train eXpress (KTX) and Great Train eXpress (GTX) networks. Technology adoption from digital-twin flood models to hydrogen equipment helps contractors offset labour shortages and compress schedules. Meanwhile, a debt ceiling on federal outlays forces ministries to rigorously screen projects, favoring those with strong cost–benefit ratios, such as GTX, over lower-traffic expressways.
Key Report Takeaways
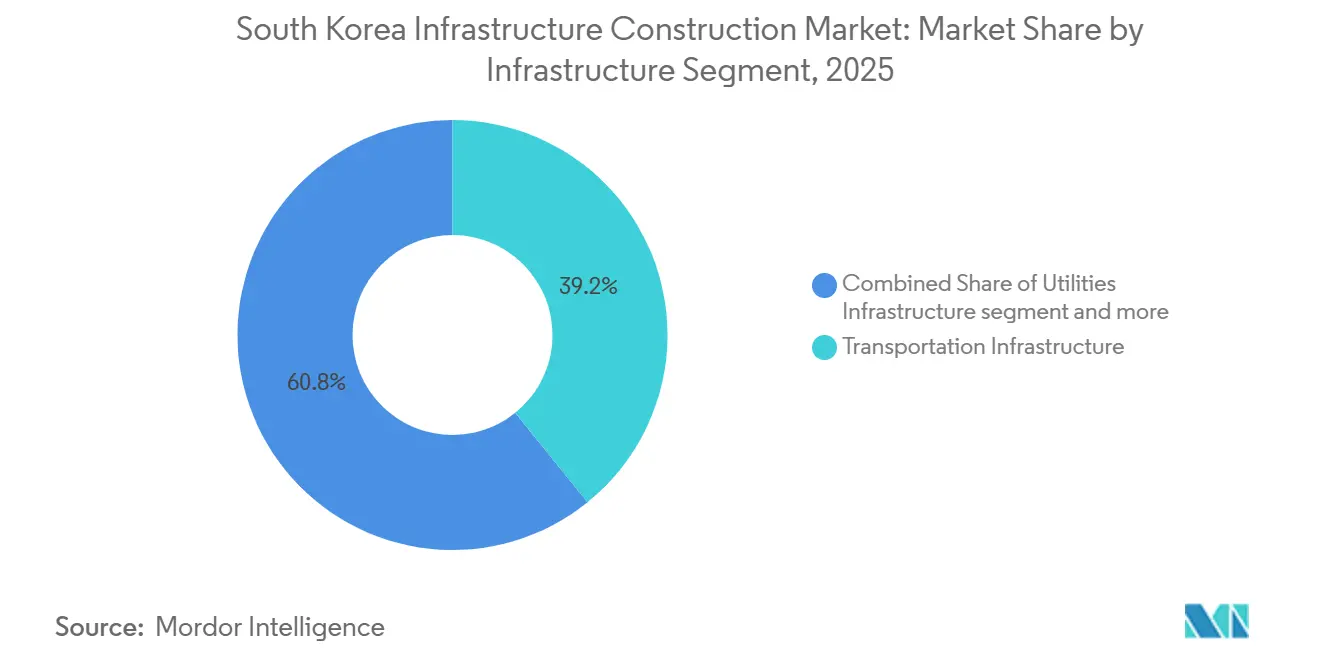
- By infrastructure segment, transportation captured 39.2% of the South Korea infrastructure construction market share in 2025, and is projected to post the highest 5.13% CAGR through 2031.
- By construction type, new construction accounted for 65.7% of the South Korea infrastructure construction market in 2025; renovation is advancing at a faster 5.55% CAGR through 2031.
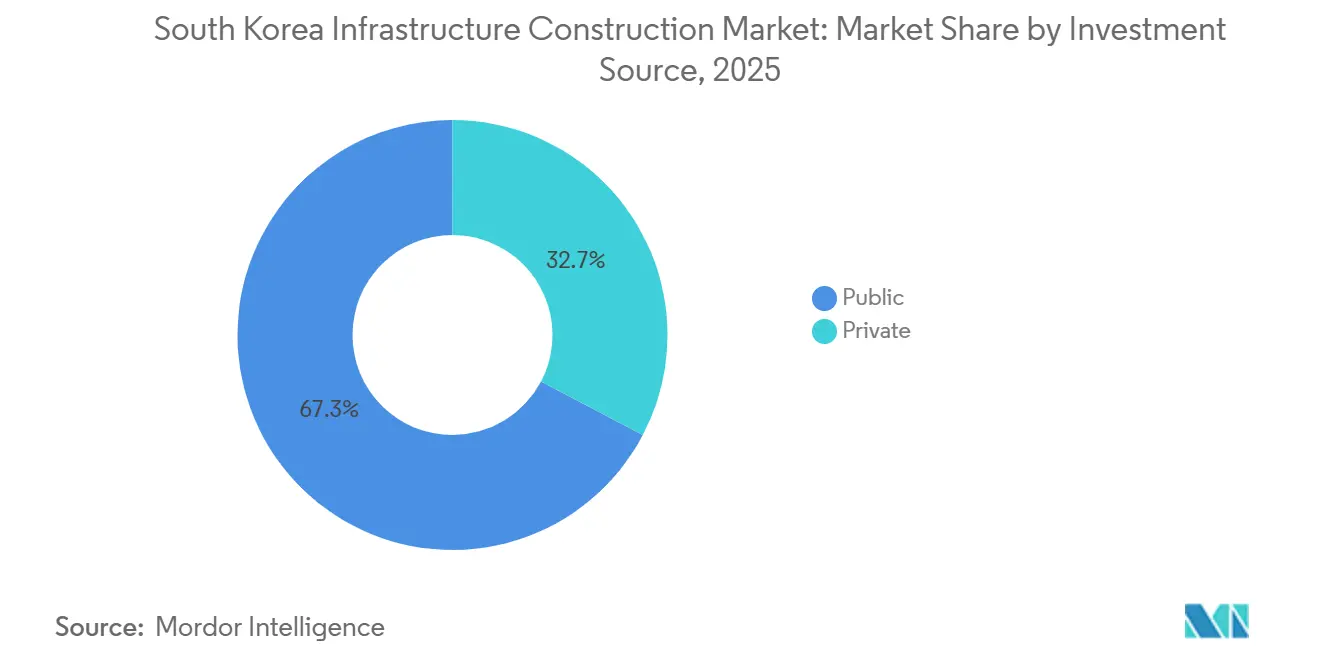
- By investment source, public funding accounted for 67.3% of the South Korean infrastructure construction market share in 2025, whereas private capital is expanding at a 5.02% CAGR, driven by PPP incentives.
- By city, Seoul held 27.9% of the South Korea infrastructure construction market size in 2025, and Daegu is set to grow at a 6.11% CAGR through 2031.
Note: Market size and forecast figures in this report are generated using Mordor Intelligence’s proprietary estimation framework, updated with the latest available data and insights as of January 2026.
South Korea Infrastructure Construction Market Trends and Insights
Drivers Impact Analysis*
| Drivers | (~) % Impact on CAGR Forecast | Geographic Relevance | Impact Timeline |
|---|---|---|---|
| Expansion of rail and metro networks | +1.2% | Greater Seoul Area, Busan, Daegu, Gwangju | Long term (≥ 4 years) |
| Nation-wide smart-city and urban-redevelopment programs | +0.9% | National, early gains in Seoul, Busan, Sejong, Daegu | Medium term (2-4 years) |
| Government push for green and resilient infrastructure | +0.7% | National, concentrated in metropolitan areas | Medium term (2-4 years) |
| Technology integration (BIM, drones, IoT, AI) | +0.5% | National, led by tier-1 contractors | Short term (≤ 2 years) |
| Deployment of underground smart-utility tunnels | +0.3% | Seoul, Incheon, Busan | Long term (≥ 4 years) |
| Hydrogen-powered heavy-equipment pilots | +0.2% | Busan, Ulsan, Jeju | Long term (≥ 4 years) |
| Source: Mordor Intelligence | |||
Expansion of Rail and Metro Networks
The initial GTX A, B, and C lines are slated to serve 1.2 million daily riders by 2028, trimming many commutes by up to 40 minutes and relieving congestion on the Seoul Metro. GTX-A began service in 2024; lines B and C reached 68% and 52% completion by January 2026, led by Samsung C&T and Hyundai E&C. New feasibility work for GTX-D, E, and F, approved in December 2025, adds a USD 13.5 billion through 2035. KTX extensions to Gangneung and Sokcho, completed in 2024, boosted demand for east-coast tourism construction by USD 1.05 billion in 2025. Busan’s Metro Line 5 link to Gimhae Airport, due in 2027, underpins cargo and passenger integration.
Nation-Wide Smart-City and Urban-Redevelopment Programs
The K-City Network links 18 Seoul districts to a single data backbone that optimizes traffic, lighting, and waste services in real time, lowering municipal operating costs by 11% in 2025.[1]Seoul Metropolitan Government, “Digital-Twin Flood Control 2025,” seoul.go.kr Busan’s Eco Delta Smart City mirrors the model with 8,400 sensor-equipped homes that cut energy use by 22% relative to standard apartments. The Ministry of Land, Infrastructure and Transport (MOLIT) earmarked USD 638 million in 2025 for retrofitting 120 neighborhoods, with a focus on seismic resilience and rooftop solar. Contractors such as GS E&C and DL E&C lock in multi-year facility-management fees, smoothing revenue between megaproject tenders. Sejong’s autonomous-shuttle corridor, opened in February 2025, demonstrates how new rights-of-way can be future-proofed for Level-4 vehicles from the outset.
Government Push for Green and Resilient Infrastructure
Since January 2025, every new public building larger than 1,000 m² must hit Zero Energy Building (ZEB) status, combining insulation upgrades, photovoltaics, and geothermal heat pumps.[2]Ministry of Environment, “2025 Green Infrastructure Budget,” me.go.kr The Green Building Certification Institute counted 412 Green Standard for Energy and Environmental Design (G-SEED) Excellent or Outstanding projects in 2025, up from 287 a year earlier. Hyundai E&C’s Gimpo Han River New Town, certified ZEB-1 in October 2025, now exports surplus power back to the grid under a 20-year feed-in tariff. The Ministry of Environment set aside USD 465 million in 2025 for wastewater-plant upgrades that cut effluent nitrogen by 30% and enable industrial reuse. Ulsan’s 50 MW electrolyzer supplies hydrogen to fuel-cell buses and heavy machinery, making the city a zero-emission pilot hub.
Technology Integration (BIM, Drones, IoT, AI) in Construction
KICT’s BIM Integration Platform, launched in January 2025, obliges public works above USD 37.5 million to file ISO 19650-ready models, enabling clash detection before procurement. Samsung C&T used autonomous drones on the Incheon Bridge expansion, slashing survey time from 14 days to 3 and improving accuracy to 2 cm. SK ecoplant’s AI maintenance engine, live on Busan Eco Delta, analyzes data from 1,200 sensors and predicts failures 72 hours in advance, reducing downtime by 19%. Seoul’s Hangang River digital twin simulated Typhoon Khanun in August 2025, optimizing flood-gate operations and averting overtopping. MOLIT now mandates real-time progress tracking via wearables on every GTX contract, feeding productivity metrics into earned-value dashboards.
Restraints Impact Analysis*
| Restraints | (~) % Impact on CAGR Forecast | Geographic Relevance | Impact Timeline |
|---|---|---|---|
| Ageing workforce and craft-skill shortages | -0.6% | National, acute in rural provinces | Short term (≤ 2 years) |
| Fiscal-budget and public-debt ceilings | -0.5% | National | Medium term (2-4 years) |
| Lengthy regulatory and environmental approvals | -0.3% | Metropolitan areas with heritage zones | Medium term (2-4 years) |
| Heritage-site opposition to urban redevelopment | -0.2% | Seoul, Gyeongju, Jeonju | Long term (≥ 4 years) |
| Source: Mordor Intelligence | |||
Ageing Workforce and Craft-Skill Shortages
Statistics Korea reported that 48% of construction workers were 55 or older in 2025, up from 42% in 2020, while entrants under 30 accounted for only 9%.[3]Statistics Korea, “2025 Construction Employment Survey,” kostat.go.kr The Korea Construction Association warns that 87,000 welders, carpenters, and crane operators will retire between 2026 and 2030, far outstripping the number of graduates from vocational schools. Although E-9 visas for overseas labor increased by 15,000 slots in 2025, language and safety certification hurdles blunt productivity gains. Contractors respond with prefabrication; Lotte E&C’s Asan plant cuts on-site labor hours by 30% through modular bathroom pods and facade panels. A reskilling program launched in February 2025 aims to transition 5,000 senior workers into BIM coordination and drone operation roles by 2027.
Fiscal-Budget and Public-Debt Ceilings
South Korea’s public debt hit 54.3% of GDP in 2025, prompting MOLIT to cap annual infrastructure spending at USD 21.8 billion through 2028. The ceiling has already delayed studies for 12 expressway segments and 4 regional airports, redirecting funds to higher-yield rail and smart-city projects. Rising debt-service costs will absorb 11.2% of the central budget by 2028, squeezing discretionary capital. Standardized PPP templates introduced in mid-2025 unlocked USD 2.3 billion of private pledges for toll roads and water plants in six months. Yet municipal bonds backed by future property taxes raise sustainability questions if land values falter.
*Our forecasts treat driver/restraint impacts as directional, not additive. The impact forecasts reflect baseline growth, mix effects, and variable interactions.
Segment Analysis
By Infrastructure Segment: Rail Investments Anchor Transportation Lead
Transportation infrastructure accounted for 39.2% of 2025 spending, the largest slice of the South Korea infrastructure construction market, and it is projected to advance at a 5.13% CAGR to 2031 as GTX extensions and KTX upgrades move ahead. Government funding of USD 13.5 billion for the three new GTX corridors, together with Busan’s Metro Line 5 and multiple KTX branch lines, locks in a multi-year backlog for tier-1 contractors with tunnel-boring and electrification expertise. Utilities work follows, buoyed by USD 465 million of 2025 wastewater-plant retrofits that drive membrane-bioreactor demand and open design slots for mid-tier civil firms. Social assets such as regional hospitals and schools absorb demographic pressure; fourteen new medical centers approved in 2025 alone will lift healthcare square footage by 1.3 million m² by 2028.
The fastest future growth appears in extraction infrastructure, where domestic lithium and cobalt deposits in Gangwon are under review, while seismic retrofits mandated for pre-2000 public buildings add a fresh USD 3.15 billion renovation stream through 2030. Contractors exploit prefabricated shear-wall modules that cut installation times by 40%, an efficiency gain that offsets labor shortages.


By Construction Type: Renovation Gains as Building Stock Ages
New builds still dominated 65.7% of the 2025 value, yet renovation work is set to expand more quickly, climbing at a 5.55% CAGR as municipalities favor retrofits that lower embodied carbon and preserve scarce land. The Green Remodeling program disbursed USD 825 million in 2025 to insulate and solar-equip 3,200 public buildings, slicing their energy use by 28% and adding a steady flow of mid-size contracts for regional contractors. Seoul’s seismic-retrofit mandate, enforced from January 2025, brings education-sector demand; DL E&C’s modular system cut on-site closure time for 23 schools by 40% and now serves as a template for other provinces.
New construction maintains relevance where capacity gaps persist. The initial three GTX corridors required 120 km of twin-bore tunnels plus 27 deep stations, a scope that only the five chaebols can finance and manage. Greenfield megaprojects such as Busan Eco Delta Smart City demonstrate that integrated district heating, fiber backbones, and autonomous-vehicle routes are easier to embed at the outset than to retrofit later. Looking ahead, Ministry of Land, Infrastructure and Transport of the Republic of Korea (MOLIT)’s 2025 technology roadmap flags modular superstructures and 3-D-printed concrete as cost-savers, signaling further share gains for digital-first builders.
By Investment Source: Private Capital Pursues PPP Opportunities
Public funds accounted for 67.3% of outlays in 2025, anchoring the South Korean infrastructure construction market, yet private inflows are tracking a 5.02% CAGR, as the June 2025 PPP template offers revenue guarantees and tax perks tied to Zero Energy Building certification. A consortium led by Macquarie and GS E&C closed the USD 1.3 billion Incheon-Gimpo expressway concession at an 8.2% internal rate of return, signaling a healthy appetite for user-fee assets.
State support remains critical for strategic corridors whose payback exceeds private risk thresholds; the USD 13.5 billion GTX program stays on the balance sheet, with chaebols compensated via fixed-price EPC contracts that hedge against cost inflation. Sovereign and pension investors also scale up: the National Pension Service lifted domestic infrastructure exposure to 4.2% of its USD 800 billion portfolio in 2025, valuing predictable inflation-linked cash flows.
Geography Analysis
Seoul’s 27.9% share in 2025 reflects a pivot from capacity building to system optimization; GTX-A alone spurred USD 630 million in corridor-linked housing and retail during 2025, while the citywide digital twin backbone reduced annual operating costs by 11% as verified during Typhoon Khanun. Stringent seismic and ZEB codes add retrofit volume, with 412 public structures achieving Green Standard for Energy and Environmental Design (G-SEED) Excellent status in 2025, 44% more than a year earlier.
Further south, Daegu enjoys the fastest 6.11% CAGR to 2031 thanks to light-rail and urban-regeneration budgets that drive localized employment and anchor tenants for technology clusters. Building-code incentives for rooftop solar and earthquake resilience lifted average property values by 9% in regenerated districts during 2025, catalyzing private co-investment. Busan’s Eco Delta Smart City merges autonomous-vehicle lanes with district heating, lowering household energy bills by 22% and drawing smart-appliance manufacturers into adjacent industrial parks.
Incheon’s airport phase-four works, forecast to lift terminal capacity to 106 million passengers by 2030, set off a USD 1.6 billion wave of road and hospitality builds, while provincial areas leverage a USD 3.9 billion Balanced Regional Development fund to even out service quality. Gyeongju’s 30 MW hydrogen plant commissioned 2024 feeds industrial estates and signals future net-zero clusters for Jeju and Ulsan, widening the technology diffusion footprint beyond the capital corridor.
Competitive Landscape
Samsung C&T, Hyundai E&C, GS E&C, DL E&C, and POSCO E&C together won a clear majority of 2025 public tenders, showing a moderately concentrated field that still gives smaller firms latitude in specialized niches. Samsung C&T’s drone-based surveys on the Incheon Bridge cut mapping time by 79%, a cost edge that helps sustain bid-price discipline. Hyundai E&C advanced its Smart Construction Platform on GTX-A, trimming rework by 14% through AI-driven defect flags, while POSCO E&C teamed with Doosan to pioneer hydrogen cranes on Ulsan sites, showcasing environmental credentials.
Mid-tier companies chase value-add renovation, modular housing, and regional utilities. Lotte E&C’s Asan modular hub offsets labor scarcity by delivering facade panels ready for installation, saving 30% in on-site man-hours and positioning the firm as a preferred retrofit supplier for municipal schools. SK ecoplant’s predictive-maintenance AI reduced downtime at Busan Eco Delta by 19%, winning caretaker contracts that extend cash flow beyond handover dates. New entrants offer drone-as-a-service mapping and digital twin analytics, enabling regional builders to upgrade without the capital-intensive R&D.
Standardization pushes collaboration. KICT’s January 2025 BIM Integration Platform forces ISO 19650 compliance on projects above USD 37.5 million, opening data rooms where small structural engineers can align seamlessly with chaebol primes. As hydrogen equipment pilots scale, OEM partnerships widen: Hyundai Construction Equipment signed framework deals with SK ecoplant and GS E&C to roll out 50 additional fuel-cell excavators by end-2026, tying equipment supply to measurable emission cuts.
South Korea Infrastructure Construction Industry Leaders
Samsung C&T Corporation
Hyundai E&C
GS E&C Corp.
DL E&C
Daewoo Engineering & Construction Co., Ltd.
- *Disclaimer: Major Players sorted in no particular order

Recent Industry Developments
- February 2026: Samsung C&T secured a USD 1.8 billion civil package for the northern stretch of GTX-D, targeting 400,000 daily riders by 2032.
- January 2026: Hyundai E&C and Macquarie formed a USD 1.3 billion toll-road JV linking Incheon and Gimpo with a 30-year concession and 8.2% expected return.
- December 2025: MOLIT cleared feasibility work for GTX-E and GTX-F, adding USD 9 billion in capital through 2035.
- November 2025: GS E&C won a USD 668 million contract to build Daegu’s 50,000-seat athletics venue with a retractable roof and rainwater harvesting.


Research Methodology Framework and Report Scope
Market Definitions and Key Coverage
Our study defines the South Korean infrastructure market as the annual value of work put in place across transportation, utilities, social and extraction assets, including new-builds and major renovations that extend asset life or capacity. Assets range from high-speed rail corridors and expressways to power grids, wastewater plants, and digital backbone projects that underpin industrial and urban growth.
Minor repairs, routine maintenance, and offshore assets serving foreign territories fall outside this scope.
Segmentation Overview
- By Infrastructure Segment
- Transportation Infrastructure
- Utilities Infrastructure
- Social Infrastructure
- Extraction Infrastructure
- By Construction Type
- New Construction
- Renovation
- By Investment Source
- Public
- Private
- By Key Cities
- Seoul
- Busan
- Daegu
- Incheon
- Rest of South Korea
Detailed Research Methodology and Data Validation
Primary Research
Mordor analysts interviewed project owners, EPC contractors, lenders, and municipal planners in Seoul, Busan, Daegu, and Jeju. Conversations clarified bid prices, typical contingency buffers, labor-rate escalation, and public-private funding splits, while a short web survey of design consultants provided fresh unit-cost benchmarks for elevated rail and sub-1 GW solar farms.
Desk Research
We gathered foundational data from open-access, tier-one sources such as the Ministry of Land, Infrastructure and Transport statistics, Korea Development Institute CAPEX bulletins, National Assembly budget papers, Korea Customs Service trade flows, and Korea Construction Association tender databases. Company filings and 10-K-equivalents, reputable business press, and select modules from D&B Hoovers and Dow Jones Factiva supplied firm-level revenues, project pipelines, and cost narratives. Energy build-out figures were cross-checked against KEPCO generation tables and WSTS semiconductor capex trackers. The sources cited here are illustrative; many additional references were consulted for validation and clarification.
Market-Sizing & Forecasting
A top-down build began with national construction-investment accounts and segmented infrastructure outlays, which are then reconciled with selective bottom-up checks such as sampled EPC revenues and channel pricing for structural steel. Key drivers feeding the model include public works budgets, approved megaproject pipelines, building-material cost indices, private capital deployment rates, labor-productivity trends, and yen-won exchange dynamics that sway imported equipment costs. Multivariate regression allied with scenario analysis projects these variables to 2030; gaps in sampled bottom-up data are bridged through peer-range imputation vetted in follow-up calls.
Data Validation & Update Cycle
Outputs pass two layers of analyst review that flag variance versus historical series, peer signals, and live project trackers. Material anomalies trigger re-runs before sign-off. The dataset refreshes every twelve months, with interim updates when policy shifts, large contract awards, or currency swings move the baseline.
Why Mordor's South Korea Infrastructure Baseline Earns Trust
Published estimates often differ because firms choose unique asset baskets, cost-uplift rules, and refresh cadences.
Key Gap Drivers, many studies bundle residential civil works or exclude renovation spend, apply unvetted average selling prices, or convert currencies at fixed rates instead of yearly means. Mordor's disciplined scope alignment, variable selection, and annual refresh reduce these drifts.
Benchmark comparison
| Market Size | Anonymized source | Primary gap driver |
|---|---|---|
| USD 56.25 B | Mordor Intelligence (2025) | - |
| USD 58.70 B (2024) | Global Consultancy A | Includes limited industrial parks yet omits utility refurbishment; single-year FX conversion |
| USD 59.76 B (2025) | Industry Association B | Aggregates residential civil engineering and uses optimistic ASP escalation |
| USD 56.14 B (2023) | Regional Consultancy C | Older base year and no adjustment for 2024 public-budget uplift |
Taken together, the comparison shows that Mordor's method delivers a balanced, transparent view anchored to clearly defined asset classes, validated cost inputs, and a refresh rhythm that decision-makers can rely on.


Key Questions Answered in the Report
How large will South Korea’s infrastructure construction sector be by 2031?
The South Korea infrastructure construction market size is projected to reach USD 74.31 billion by 2031, expanding at a 4.81% CAGR from 2026 to 2031.
Which asset class dominates spending today?
Transportation assets, led by rail and metro projects, captured 39.2% of 2025 value and remain the budget priority through 2031.
Where is the fastest regional growth occurring?
Daegu leads growth at a 6.11% CAGR as it extends light-rail, regenerates aging districts, and prepares for the 2027 World Athletics Championships.
Why is renovation accelerating faster than new builds?
Retrofit incentives under the Green Remodeling program and seismic mandates push municipalities to upgrade existing assets, driving a 5.55% CAGR in renovation value.
How are labour shortages being managed?
Contractors invest in modular prefabrication, BIM-based workflows, and overseas labor visas, reducing on-site man-hours and reshaping job roles toward technology oversight.
What role does hydrogen play in future projects?
Pilot fleets of hydrogen excavators and cranes are proving the feasibility of zero-emission operation, and subsidies aim to close cost gaps, signaling broader deployment after 2027.
Page last updated on:


