
Market Overview
| Study Period | 2020 - 2031 |
|---|---|
| Forecast Data Period | 2026 - 2031 |
| Base Year Market Size (2025) | USD 45.07 Billion |
| Market Size (2026) | USD 47.14 Billion |
| Market Size (2031) | USD 58.46 Billion |
| Growth Rate (2026 - 2031) | 4.40 % |
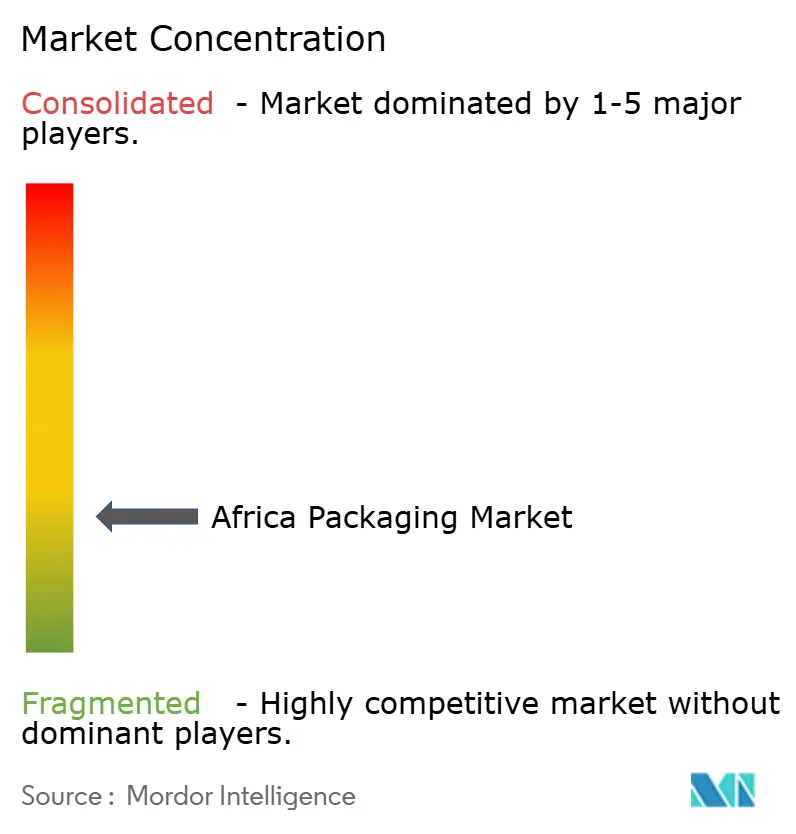
| Market Concentration | Low |
Major Players *Disclaimer: Major Players sorted in no particular order Image © Mordor Intelligence. Reuse requires attribution under CC BY 4.0. | |
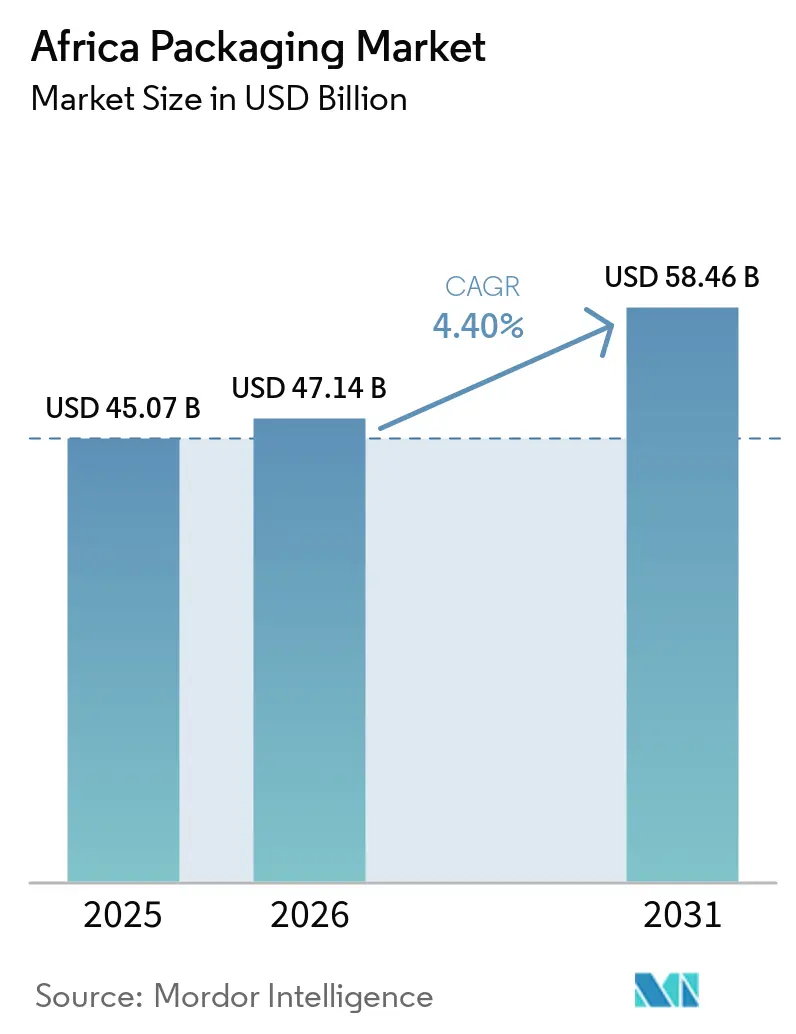
Africa Packaging Market Analysis by Mordor Intelligence
The Africa packaging market size is expected to grow from USD 45.07 billion in 2025 to USD 47.14 billion in 2026 and is forecast to reach USD 58.46 billion by 2031 at a 4.4% CAGR over 2026-2031. Converters that can balance resin-price volatility, power-supply disruptions, and port bottlenecks with rising demand from e-commerce, urban FMCG consumption, and sustainability mandates are best placed to capture this expansion. Plastic formats still dominate, yet regulatory pressure is shifting brand owners toward mono-material and biodegradable solutions that meet Extended Producer Responsibility targets. Flexible films and stand-up pouches are gaining share because they reduce logistics costs and fit price-sensitive portion sizes demanded by the growing urban middle class. East Africa is set to outpace Southern Africa on the back of horticultural and pharmaceutical exports, while Nigeria and Egypt remain volume anchors but lag in growth as infrastructure gaps persist. Competitive intensity is moderate, with the top ten players controlling roughly half of revenue; technology adoption around digital presses and inline quality inspection is emerging as a key differentiator.
Key Report Takeaways
- By packaging type, plastic accounted for 48.19% of Africa packaging market share in 2025; biodegradable substrates are projected to expand at a 4.91% CAGR through 2031.
- By packaging format, rigid solutions held 61.53% of revenue in 2025, while flexible formats are advancing at a 5.23% CAGR to 2031.
- By end-use industry, food applications commanded 37.28% of demand in 2025, whereas e-commerce parcels are on track for a 4.95% CAGR over the forecast horizon.
- By geography, Southern Africa led with 34.61% revenue share in 2025; East Africa is expected to record the highest regional CAGR at 5.11% to 2031.
Note: Market size and forecast figures in this report are generated using Mordor Intelligence’s proprietary estimation framework, updated with the latest available data and insights as of 2026.
Market Trends and Insights
Drivers Impact Analysis of Africa Packaging Market*
| Driver | (~) % Impact on CAGR Forecast | Geographic Relevance | Impact Timeline |
|---|---|---|---|
| Growing Urban Middle Class Boosting FMCG Consumption | +0.90% | Nigeria, Kenya, Egypt, South Africa | Medium term (2-4 years) |
| E-commerce Packaging Demand Surge | +0.70% | South Africa, Kenya, Nigeria, Egypt | Short term (≤ 2 years) |
| Expansion of Modern Retail Chains Across Africa | +0.60% | Southern Africa, East Africa, West Africa | Medium term (2-4 years) |
| Government Bans on Single-Use Plastics Driving Alternative Materials | +0.80% | Kenya, Rwanda, South Africa, Tanzania | Long term (≥ 4 years) |
| Rise of Cold-Chain Logistics for Fresh-Produce Exports | +0.50% | Kenya, South Africa, Ethiopia, Morocco | Medium term (2-4 years) |
| AfCFTA Trade Corridors Spurring Demand for Returnable Transit Packaging | +0.40% | Pan-African, with early gains in East African Community and SADC | Long term (≥ 4 years) |
| Source: Mordor Intelligence | |||
Growing Urban Middle Class Boosting FMCG Consumption
Rapid urban migration is concentrating purchasing power in cities, driving demand for portion-controlled sachets and stand-up pouches that match lower per-transaction spending limits.[1]United Nations Department of Economic and Social Affairs, “World Urbanization Prospects 2024 Revision,” un.org Multinationals are localizing production to cut logistics costs and respond faster to city-level taste shifts, as evidenced by Unilever’s USD 85 million flexible-pack line commissioned in Lagos in 2024.[2]Unilever, “Annual Report and Accounts 2024,” unilever.com Mini-supermarket expansion in peri-urban areas is accelerating the switch from bulk to pre-packaged goods, with sachets accounting for up to 50% of unit sales in Nigeria and Kenya. Rising disposable incomes are encouraging premium pack upgrades such as aseptic cartons, yet affordability considerations mean pack-size innovation remains the principal growth lever. The demographic dividend therefore underpins steady baseline demand that tempers cyclical stocks in commodity-linked segments.
E-commerce Packaging Demand Surge
Online retail’s share of South African sales reached 7.2% in 2025, while Kenya’s e-commerce value rose 18% year on year, reshaping corrugated-box specifications for rapid fulfilment and cross-border shipping.[3]Unilever, “Annual Report and Accounts 2024,” unilever.com Jumia’s new fulfilment centers across West and East Africa added 120,000 m² of warehouse space and drove requirements for digitally printed boxes with tamper-evident features. Platforms are setting recycled-content thresholds, prompting converters to invest in recovered-fiber supply and digital corrugators capable of short runs. Social-commerce growth is boosting demand for branded mailers and padded envelopes, an underserved niche that expanded 22% in 2025. Absence of uniform waste regulations poses a risk of landfill levies but also a service opportunity for converters offering take-back schemes.
Government Bans on Single-Use Plastics Driving Alternative Materials
Kenya’s 2024 EPR rules require 80% collection of plastic packaging by 2028, leading Coca-Cola Beverages Africa to fund a 15,000-ton rPET plant in Nairobi.[4]National Environment Management Authority, “Extended Producer Responsibility Regulations 2024,” nema.go.ke South Africa’s phased restrictions and Rwanda’s long-standing bag ban form a patchwork that forces multinationals to maintain multiple SKU portfolios, raising complexity and capex needs. Folding-carton and liquid-paperboard demand is climbing as quick-service restaurants and dairy brands shift from disposable plastics. Biopolymer uptake remains below 2% of flexible-film tonnage due to a 30-50% price premium and limited composting capacity, yet pilot community hubs in Kenya point to a scalable model once collection logistics mature. Regulatory certainty is accelerating investment decisions in alternative substrates.
Rise of Cold-Chain Logistics for Fresh-Produce Exports
Kenya shipped 176,000 t of cut flowers and 89,000 t of vegetables in 2025, relying on insulated corrugated boxes that maintain 2 °C to 8 °C during 12-hour airfreight windows. South Africa’s 2.8-million-ton citrus season uses modified-atmosphere liners for 3- to 4-week sea voyages to Asia. The African Development Bank’s USD 1.2 billion cold-chain initiative expanded refrigerated warehousing by 35%, spurring demand for pallet wraps and data-logging labels. Ethiopia’s 19% growth in cut-flower exports is drawing corrugated-box capacity near Addis Ababa airport to reduce lead times. Pharmaceutical cold-chain programs are adopting WHO-certified containers, widening the application base for high-value insulated formats.
Restraints Impact Analysis of Africa Packaging Market*
| Restraint | (~) % Impact on CAGR Forecast | Geographic Relevance | Impact Timeline |
|---|---|---|---|
| Volatile Polymer and Paper-Pulp Prices | -0.60% | Pan-African, acute in import-dependent markets | Short term (≤ 2 years) |
| Power-Supply Instability Increasing Plant OPEX | -0.50% | South Africa, Nigeria, Ghana, Zimbabwe | Medium term (2-4 years) |
| Port Congestion Delaying Raw-Material Inflows | -0.30% | Nigeria (Lagos), Kenya (Mombasa), Tanzania (Dar es Salaam) | Short term (≤ 2 years) |
| Inadequate Recycling Infrastructure Limiting rPET Uptake | -0.20% | Sub-Saharan Africa excluding South Africa | Long term (≥ 4 years) |
| Source: Mordor Intelligence | |||
Volatile Polymer and Paper-Pulp Prices
Polyethylene prices in South Africa oscillated between ZAR 18,500 and ZAR 24,200 t⁻¹ in 2024-2025, shrinking converter margins by up to 12%. With 70% of sub-Saharan resin imported, freight-rate swings and forex shifts have direct P&L impact, illustrated by a six-week supply delay after Red Sea disruptions in late 2024. Paper-pulp costs climbed 11% in 2025 as global supply tightened, compelling box makers to import kraft liner at an 18% premium. Limited hedging tools in African financial hubs expose small converters to spot-price shocks, reinforcing a flight to scale and vertical integration.
Power-Supply Instability Increasing Plant OPEX
Stage-4 to Stage-6 load-shedding hit South African plants for 185 days in 2025, forcing reliance on diesel generators that cost up to ZAR 6.00 kWh⁻¹ triple grid rates raising energy expense 12-18%. Nigerian converters self-generate up to 80% of power needs, adding USD 0.12 kg⁻¹ to flexible-film costs. High OPEX deters capex-heavy processes such as blown-film extrusion and pushes investment toward digital flexography. Renewable projects reduce grid exposure but require steep upfront capital and face regulatory uncertainty around wheeling tariffs, limiting scale for smaller firms.
*Our forecasts treat driver/restraint impacts as directional, not additive. The impact forecasts reflect baseline growth, mix effects, and variable interactions.
Africa Packaging Market Segment Analysis
By Packaging Type:
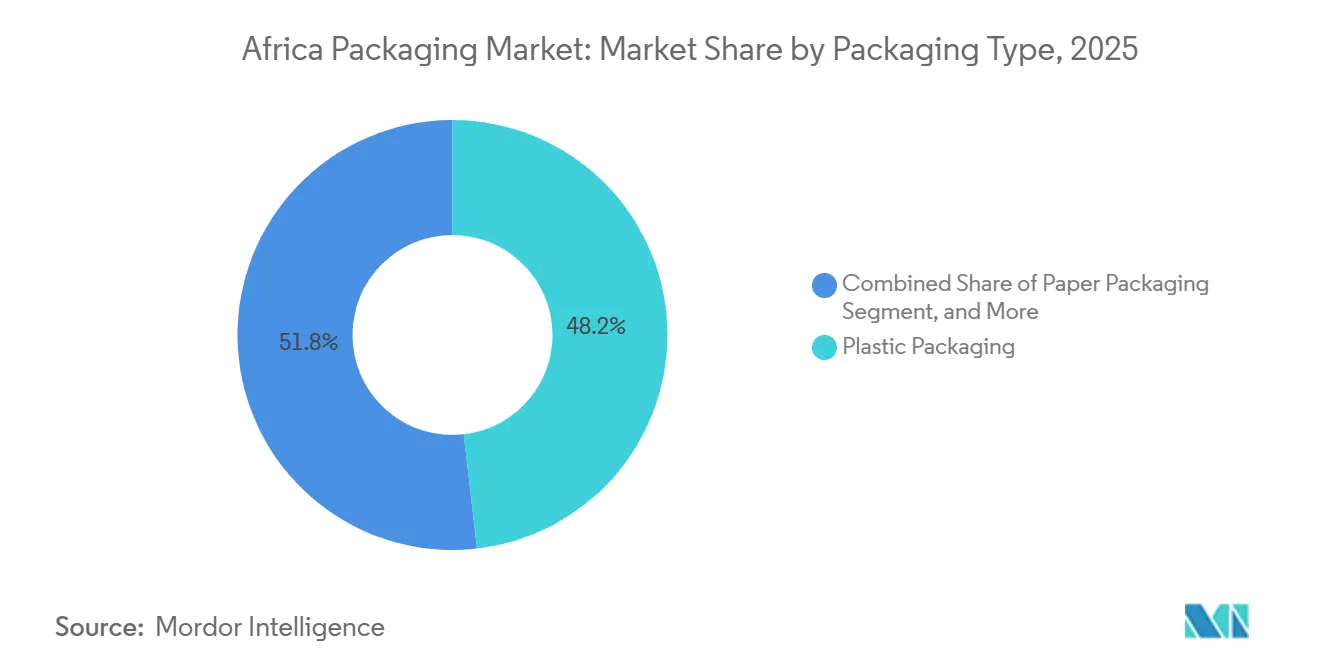
Plastic Dominance Meets Biodegradable MomentumPlastic formats supplied 48.19% of Africa packaging market revenue in 2025, underpinned by polyethylene for shopping bags and dairy sachets, PET for beverages and polypropylene for hot-fill applications, yet biodegradable alternatives are projected to grow at 4.91% CAGR as single-use bans tighten. South Africa’s 68% PET recycling rate, the highest on the continent, exemplifies how deposit-return schemes can sustain polymer use within circular models. Biodegradable take-up remains constrained by limited composting hubs that handle only a fraction of projected PLA tonnage, yet pilot programs suggest scalable pathways once collection matures. Paper claimed 28% share in 2025, buoyed by corrugated demand from e-commerce and folding cartons for dry foods, while glass and metal retained niche positions in premium beverages and on-premises consumption.
Rigid plastics such as PET bottles and HDPE containers dominate volume but rely on capital-intensive blow-moulding lines that favour incumbents, restraining rapid format shifts. Flexible plastics, led by stand-up pouches, are growing faster because they cut material usage by up to 40% and fit portion-size requirements in urban informal retail. Brand owners are piloting mono-material laminates that meet recyclability mandates, yet barrier-performance trade-offs limit adoption for moisture-sensitive snacks. Kraft-liner shortages in 2025 drove corrugated producers to increase recycled-fiber ratios to 85%, raising strength concerns in humid climates.



By Packaging Format:
Rigid’s Scale Versus Flexible’s AgilityRigid formats accounted for 61.53% of the Africa packaging market in 2025, powered by entrenched beverage, glass and corrugated lines with high switching costs. Corrugated boxes remain indispensable for e-commerce and agricultural exports, but their 3.8% growth lags flexible films as brand owners chase logistics savings. Large converters like Nampak and Consol enjoy scale advantages, yet asset intensity limits innovation speed compared with agile, flexible players.
Flexible packaging is set for 5.23% CAGR through 2031, propelled by stand-up pouches and high-clarity films that suit urban purchasing patterns. Lower tooling costs enable converters to service fragmented FMCG portfolios efficiently, although multi-layer structures face recyclability headwinds under new EPR rules. Mono-material polyethylene pouches coupled with metallized coatings offer a compliance path, but require reformulated inks and adhesives, stretching smaller firms’ balance sheets.
By End-Use Industry:
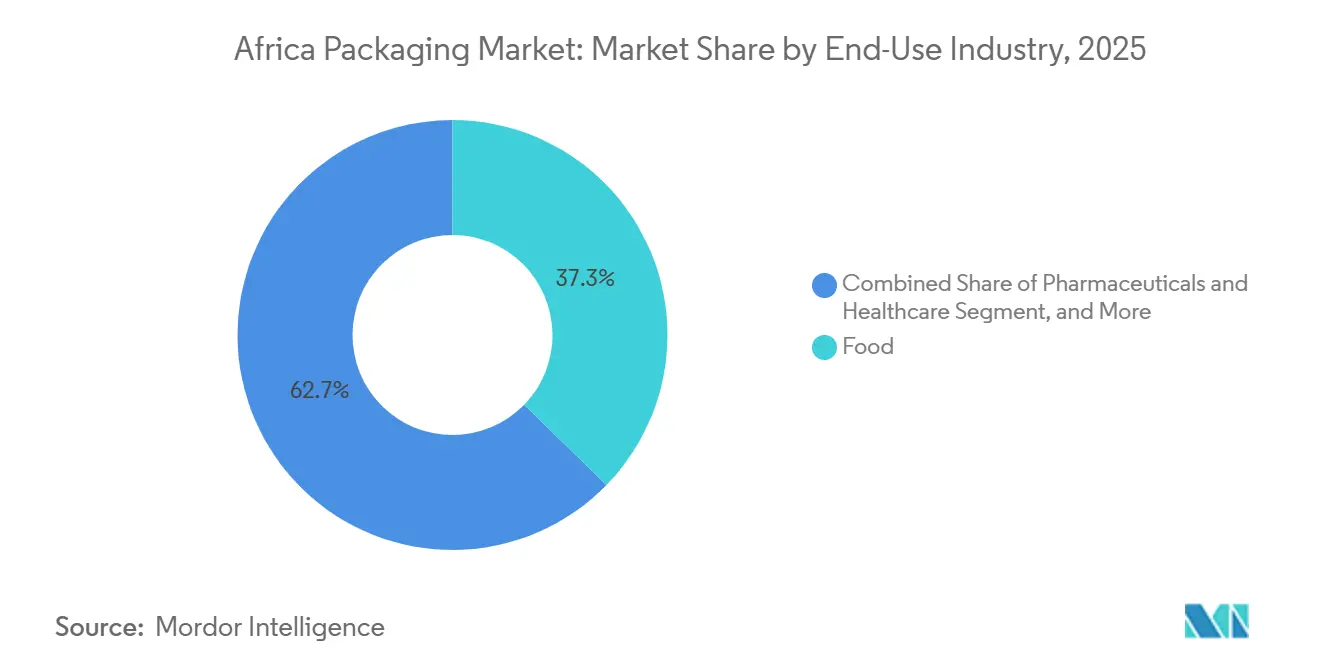
Food’s Anchor and E-commerce’s SurgeFood applications represented 37.28% of revenue in 2025, driven by maize-meal bags, dairy sachets and fresh-produce packaging. Urban middle-class premiumization is lifting demand for aseptic cartons and high-barrier films, while mass segments remain price-led, favouring polyethylene sachets. Beverage packaging, concentrated in PET water bottles and glass beer containers, follows with a 22% share, while aseptic juice cartons are gaining ground in school-feeding programs.
E-commerce is the fastest-growing end-use, poised for a 4.95% CAGR, as personalized unboxing drives the adoption of digitally printed corrugated boxes and branded mailers. Pharmaceutical packaging is benefitting from vaccine cold-chain investments, supporting demand for temperature-monitoring labels and blister packs compliant with WHO standards. Personal care premiumization spurs uptake of airless pumps and glass jars, though growth remains modest in comparison to food and online retail.
Geography Analysis
Southern Africa Packaging Market
Southern Africa held 34.61% of the Africa packaging market in 2025, leveraging integrated polymer, paper and glass supply chains around South Africa, yet growth is capped at 3.7% CAGR by chronic load-shedding, rising diesel costs and stiff import competition. Botswana and Namibia provide niche demand linked to diamonds and seafood, whereas Zimbabwe and Mozambique remain hampered by macro instability.
East Africa Packaging Market
East Africa is projected to lead regional expansion at 5.11% CAGR, buoyed by Kenya’s horticultural exports and Ethiopia’s pharmaceutical clusters. Kenya’s 2024 EPR framework is catalysing rPET capacity investments and accelerating migration to mono-material flexible packaging. Ethiopia’s 19% growth in cut-flower exports and Tanzania’s nascent modern retail footprint offer white-space opportunities for corrugated and flexible converters.
MEA Packaging Market
West Africa, anchored by Nigeria’s 220 million consumers, confronts high logistics costs from port congestion and self-generation of electricity, which add up to USD 0.12 kg⁻¹ to film production. Despite these hurdles, sachet culture sustains resilient demand for low-cost flexible packaging. Egypt benefits from natural-gas subsidies and re-export links into the Middle East, yet currency volatility and machinery import restrictions temper investment sentiment. The rest of Africa, including Morocco and Ghana, will track a 4.2% CAGR supported by AfCFTA trade facilitation and cold-chain rollouts.
Regulatory Landscape
Packaging regulation across Africa is tightening through country-level bans, extended producer responsibility (EPR) schemes, and emerging regional harmonization, which adds compliance complexity for pan-African brand owners. Kenya operationalized plastic-packaging controls through Legal Notice 181 of 2024 under the Environmental Management and Co-ordination framework, and from 2025, enforcement of EPR obligations by the National Environment Management Authority (NEMA) is increasing attention on registered producer responsibility organizations, collection targets, and traceable recovery plans.
Regional convergence efforts are also progressing alongside national rules. In March 2026, stakeholders in Arusha advanced the East African Community (EAC) Single-Use Plastics (SUP) Bill toward tabling, pointing to movement from fragmented national bans toward a potential bloc-level framework. The African Organisation for Standardisation (ARSO) Technical Committee 14 is formalizing food-packaging and labelling standards, including FDARS 1721:2025 for recycled PET intended for food contact, which supports cross-border acceptance of compliant materials and encourages converters to adopt documented recycled-content quality systems. IGAD has also issued a regional plastic pollution prevention strategy centered on circular economy approaches, reinforcing the shift toward formal recovery and standardized labeling.
Competitive Landscape
Approximately 45-50% of Africa packaging market revenue resides with the top ten players, indicating moderate concentration. Multinationals such as Amcor, Mondi and Tetra Pak differentiate through barrier-film know-how and aseptic-carton technology, winning share in regulated dairy and pharma segments. Mondi’s 2025 launch of recyclable pet-food pouches underscores how substrate innovation aligned with recyclability can unlock premium categories.
Local incumbents Nampak, Mpact and Consol retain strong customer intimacy but battle elevated energy costs and tightening balance sheets: Nampak’s USD 245 million beverage-can divestiture in 2025 illustrates strategic retrenchment toward core liquid cartons and flexible films. Regional specialists like East African Packaging Industries grew corrugated capacity 25% in 2025 to serve Jumia, while Astrapak’s digital presses target short-run e-commerce packaging.
Investment themes revolve around automation that offsets labour inflation and power disruptions. Mpact’s inline vision systems cut waste by 8% in 2024, and Consol’s solar arrays lowered grid dependence 30%, boosting ESG credentials. Market white spaces include compostable quick-service food packaging, returnable transit containers for AfCFTA corridors and tamper-evident pouches for generic pharmaceuticals.
Africa Packaging Industry Leaders
Nampak Limited
Mondi Group
Mpact Ltd
Foster Packaging International (Pty) Ltd
Astrapak Ltd (RPC Packaging Holdings Ltd)
- *Disclaimer: Major Players sorted in no particular order
Africa Packaging Market Companies Covered in this Report
- Amcor plc
- Mondi plc
- Nampak Ltd
- Mpact Ltd
- Tetra Pak International SA
- Sealed Air Corp.
- Constantia Flexibles Group GmbH
- Consol Holdings (Pty) Ltd
- Astrapak Ltd
- Foster Packaging International (Pty) Ltd
- East African Packaging Industries Ltd
- Bonpak (Pty) Ltd
- Huhtamäki Oyj
- Ardagh Group SA
- Smurfit WestRock
- Novus Holdings Ltd
- Greif Inc.
- Sonoco Products Company
- Frigoglass SAIC

Market Opportunities and Future Outlook
EPR implementation and enforcement are translating into investment pipelines for recycling and food-grade recycled content, especially along large beverage and FMCG corridors. In Nigeria, mandatory EPR for plastics (via NESREA) has aligned with capacity-led moves in 2026, including Polysmart Packaging beginning the first phase of a USD 60 million recycling facility targeting 100,000 tons per year and Indorama Ventures partnering with Nigerian Breweries and Genesis Energy on a planned 45,000-ton-per-year food-grade rPET facility in Lagos. These initiatives create near-term whitespace for collection aggregation, sorting, and decontamination capability that can support converters with more consistent rPET and help brand owners meet recycled-content commitments under evolving national EPR rules.
Localization of packaging supply is also creating opportunities in import-dependent markets facing FX volatility and freight disruptions. Capacity additions show conversion investment beyond traditional hubs, including Shri Krishana Overseas Plc (SKL) investing in a new Kisaju plant in Kenya to lift output from 3,000 to 22,000 tonnes per year and Boxpack Zambia securing funding for a new production line to increase monthly output from 600 to 1,800 tonnes. In rigid packaging and closures, Coleus Packagings R200 million equipment investment in Alrode (Johannesburg) reflects steps to serve beverage and FMCG customers with shorter lead times and tighter quality control, alongside lightweighting and recyclability-aligned formats such as mono-material packs and improved closure designs, which sustainability mandates and modern retail specifications are pushing.
Recent Industry Developments in Africa Packaging Market
- May 2026: Nampak confirmed the Springs Line 4 project, relocating a can manufacturing line from Angola to its Beverage South Africa operations. The project adds local capacity and increases pack format flexibility for beverage customers, while also simplifying the company's footprint after portfolio changes across African operations.
- July 2025: Mondi's Merebank mill in South Africa achieved Cradle to Cradle Certified Bronze for its uncoated fine paper portfolio, including Rotatrim-branded products. The certification strengthens paper-based packaging credentials for brand owners facing tighter sustainability screening and procurement requirements in South Africa.
- July 2024: Mpact Plastic Containers Castleview (Pty) Ltd acquired a 30% stake in Africa Tanks (Pty) Ltd for ZAR 73 million. The investment broadens Mpact's participation in water storage solutions by applying plastics processing know-how to adjacent demand tied to water security and infrastructure needs.


Africa Packaging Market Report Scope and Research Methodology
Market Definition and Coverage
For this methodology, the Africa packaging market is the value of packaging materials and formats used to contain, protect, transport, and display goods across African countries, counted at the point where packaging is sold into end users like food, beverage, home care, and industrial supply chains.
Scope exclusions: It does not count packaging machinery, printing presses, or logistics services that sit outside the packaging material and converted packaging value.
Segments Covered in This Report
- By Packaging Type
- Plastic Packaging
- Rigid Plastic Packaging
- By Material Type
- Polyethylene (PE)
- Polypropylene (PP)
- Polyethylene Terephthalate (PET)
- Polyvinyl Chloride (PVC)
- Polystyrene (PS) and Expanded PS
- Other Material Types
- By Product Type
- Bottles and Jars
- Caps and Closures
- Trays and Containers
- Other Product Types
- By End-use Industry
- Food
- Beverage
- Pharmaceutical
- Cosmetics and Personal Care
- Industrial
- Other End-use Industry
- By Material Type
- Flexible Plastic Packaging
- By Material Type
- Polyethylene (PE)
- Biaxially Oriented Polypropylene (BOPP)
- Cast Polypropylene (CPP)
- Other Material Types
- By Product Type
- Pouches and Bags
- Films and Wraps
- Other Product Types
- By End-use Industry
- Food
- Beverage
- Pharmaceutical
- Cosmetics and Personal Care
- Industrial
- Other End-use Industry
- By Material Type
- Rigid Plastic Packaging
- Paper Packaging
- By Product Type
- Folding Carton
- Corrugated Boxes
- Liquid Paperboard
- Other Product Type
- By End-use Industry
- Food
- Beverage
- E-commerce
- Other End-use Industry
- By Product Type
- Container Glass
- By Color
- Green
- Amber
- Flint
- Other Colors
- By End-use Industry
- Food
- Beverage
- Alcoholic
- Non-Alcoholic
- Personal Care and Cosmetics
- Pharmaceuticals (Excl. Vials and Ampoules)
- Perfumery
- By Color
- Metal Cans and Containers
- By Material Type
- Steel
- Aluminum
- By Product Type
- Cans
- Drums and Barrels
- Caps and Closures
- Other Product Type
- By End-use Industry
- Food
- Beverage
- Chemicals and Petroleum
- Industrial
- Paints and Coatings
- Other End-use Industry
- By Material Type
- Plastic Packaging
- By Packaging Format
- Rigid
- Flexible
- By End-Use Industry
- Food
- Beverage
- Pharmaceuticals and Healthcare
- Personal Care and Cosmetics
- Industrial
- E-commerce
- Other End-use Industry
- By Country
- Egypt
- Nigeria
- Kenya
- South Africa
- Rest of Africa
Data Sources, Market Sizing, and Validation
Desk Research
Desk research was used to build the basic demand and supply context before any modeling was finalized. We relied on public statistics and documentation such as UN Comtrade trade flows, World Bank macro indicators, UNIDO industrial output series, and country statistical offices for manufacturing and population trends, which helps explain how packaging consumption varies across Africa.
To ground packaging-specific assumptions, we also reviewed sources such as FAO food processing and agriculture indicators, industry association publications covering plastics, paper, and recycling, plus company annual reports, investor presentations, and reputable business press for capacity additions and plant expansions. For fill-in checks, paid subscriptions were used selectively for company financials, patent activity, and shipment-level import and export visibility where available. These sources are illustrative, and many other references were also consulted for data collection, cross-checks, and clarification.
Primary Interviews and Surveys
Interviews and surveys with packaging converters, suppliers, and end-use participants across Africa clarify converter utilization, material mix, average selling price movement, imports, exports, and demand by end use. These responses help check secondary series, fill country-level gaps, and test assumptions before sign-off. Analysts re-contact respondents when reported changes conflict with trade, production, or company evidence.
Distribution of primary research fieldwork respondents
| Company type | Respondent position |
|---|---|
| Top tier: 27% | CXOs: 18% |
| Mid tier: 48% | Functional/Unit leaders: 32% |
| Smaller Players: 25% | Managers: 50% |
Market-Sizing & Forecasting
Sizing starts with a top-down build that reconstructs packaging demand using production and trade data for packaged goods, and then translates that demand into packaging spend using material and format intensity factors. When the main drivers are assembled, the total comes out at the end, and we check realism at the country and end-use level.
To keep the model practical, we used a short list of inputs that can be tracked every year, such as packaged food and beverage output, urbanization and income trends, import penetration for packaged products, resin and paper price direction, and the shifting split between rigid and flexible formats. Results were then corroborated with selective bottom-up approximations, including sampled converter revenue roll-ups, channel checks on pricing, and volume x average selling price sanity tests for major packaging materials. Where data gaps existed, we used proxy ratios from similar markets and then normalized back to Africa totals.
For forecasting, scenario analysis was used to reflect different paths for consumer demand, raw material costs, and local manufacturing capacity, with assumptions refined through expert feedback. Each scenario was converted into annual market values using expected mix changes, and then the central case was selected when it matched observed market signals and interview consensus best.
Data Validation & Update Cycle
Validation was done through multiple checks so a single data series does not overly drive the result. Model outputs were compared against independent indicators such as packaging material imports, converter capacity announcements, and packaged goods output trends. When variances were large, they were reviewed and corrected before sign-off.
Before numbers are finalized, another analyst reviews the logic, inputs, and year-to-year movements to catch anomalies like price jumps that are not supported by raw material trends. Reports are refreshed annually, and interim updates are made when material events occur, such as major capacity changes or sudden commodity price shifts. Right before delivery, a fresh pass is completed so clients receive the most current view.
Mordor Intelligence's Africa Packaging Market Size Measured Against Other Published Estimates
Published market sizes for Africa packaging can differ because teams do not always count the same value point, geography set, or product boundary, even if the titles look similar. Differences also come from how prices are normalized, how informal supply is treated, and how often the model is refreshed when currencies and raw materials move.
Import and export flows for packaging materials, packaged goods output signals, and converter capacity additions are the checks that keep Mordor Intelligence tied to a packaging demand pool that is realistic at country level, before totals are summed. When those signals are not used, it is easy to overstate the market by mixing in non-packaging items, or understate it by using flat pricing that misses resin and paper swings.
Benchmark comparison
| Source | Market Size | Gaps in Research Methodology |
|---|---|---|
| Mordor Intelligence | USD 45.07 B (2025) | |
| Industry Portal A | USD 41.20 B (2025) | Uses a narrower country set and excludes parts of industrial and transport packaging, and it also applies limited pricing updates, which keeps value growth muted. |
| Regional Consultancy B | USD 52.80 B (2025) | Blends packaging materials with adjacent activities like labeling and some converting services, and it assumes faster ASP escalation without cross-checking against trade and commodity signals. |
The table shows that the spread is mainly explained by boundary choices and price handling, not by a disagreement on direction of growth. By tying the model to repeatable signals and then checking totals with simple bottom-up reality tests, the final number stays traceable and easier to update year after year.


Key Questions Answered in the Report
What is the current value of the Africa packaging market?
It stood at USD 47.14 billion in 2026 and is projected to reach USD 58.46 billion by 2031.
Which segment is growing fastest within Africa's packaging landscape?
Flexible packaging, particularly stand-up pouches, is forecast to post a 5.23% CAGR through 2031.
How are single-use plastic bans affecting packaging choices?
Regulations in Kenya, Rwanda and South Africa are accelerating a shift toward paper, mono-material films and biodegradable substrates.
Why is East Africa the fastest-growing region?
Strong horticultural exports, expanding pharmaceutical clusters and supportive EPR regulations push the region toward a 5.11% CAGR.
What role does e-commerce play in packaging demand?
Online retail growth is lifting demand for digitally printed corrugated boxes and branded mailers, with e-commerce packaging set for a 4.95% CAGR.
How severe is the impact of power instability on converters?
Load-shedding in South Africa and unreliable grids in Nigeria raise energy costs 12-18%, compelling firms to invest in generators and renewables.
Page last updated on:


 Your data is secure and never sold or shared.


