Market Overview
| Study Period | 2020 - 2031 |
|---|---|
| Forecast Data Period | 2026 - 2031 |
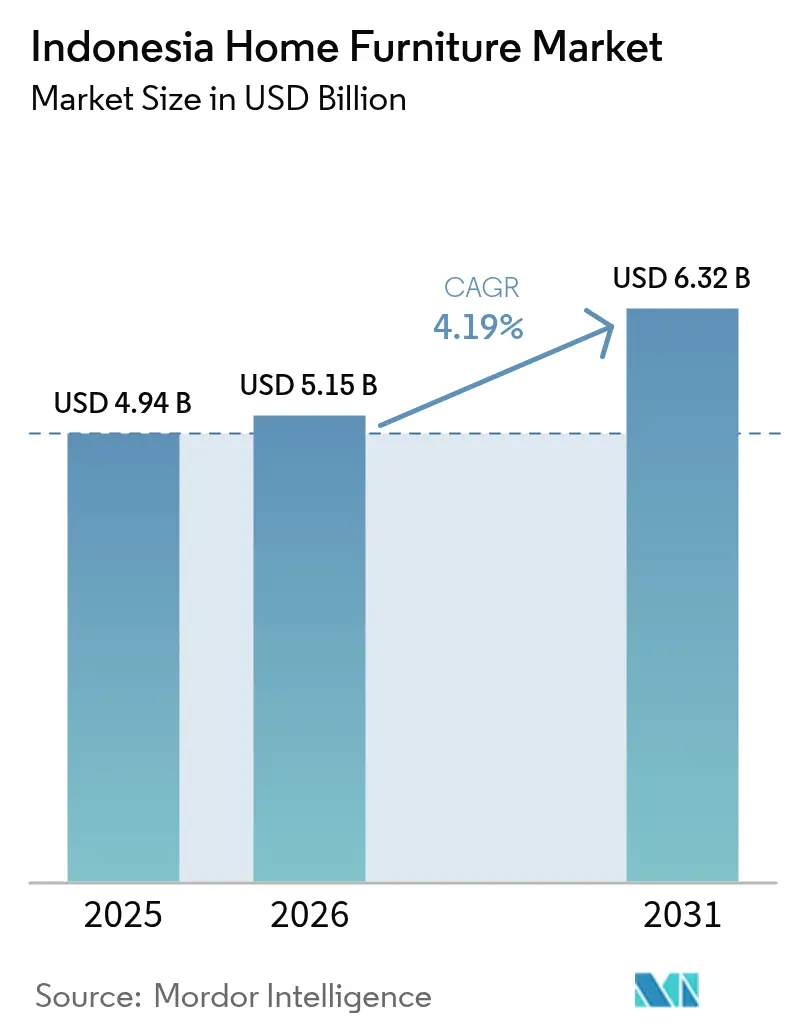
| Base Year Market Size (2025) | USD 4.94 Billion |
| Market Size (2026) | USD 5.15 Billion |
| Market Size (2031) | USD 6.32 Billion |
| Growth Rate (2026 - 2031) | 4.19% CAGR |
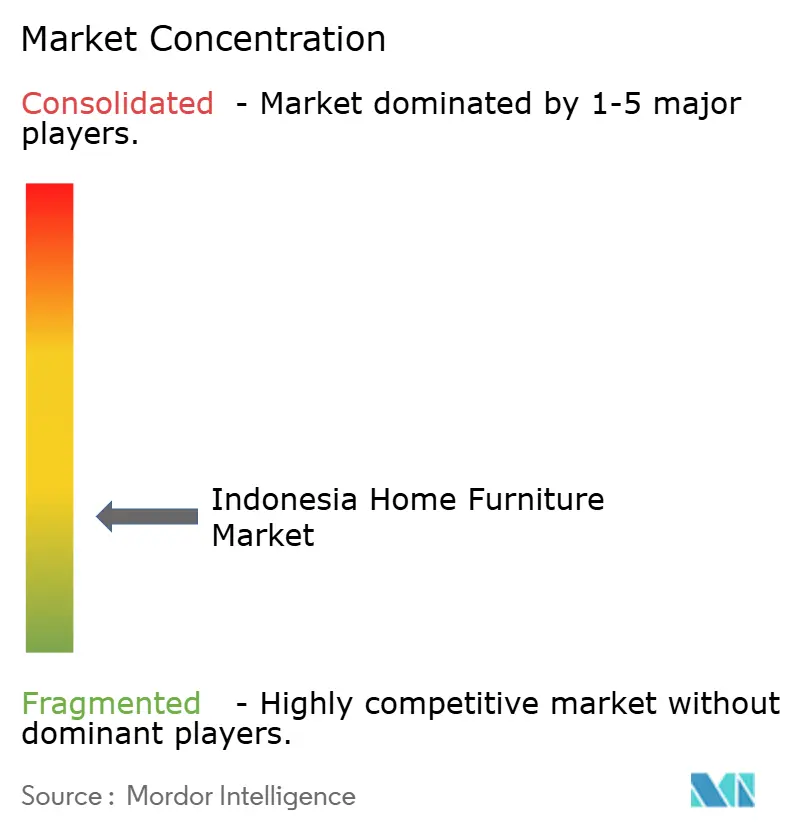
| Market Concentration | Low |
Major Players *Disclaimer: Major Players sorted in no particular order Image © Mordor Intelligence. Reuse requires attribution under CC BY 4.0. | |
Indonesia Home Furniture Market Analysis by Mordor Intelligence
The Indonesia home furniture market size is expected to increase from USD 4.94 billion in 2025 to USD 5.15 billion in 2026 and reach USD 6.32 billion by 2031, growing at a CAGR of 4.19% over 2026-2031. Housing-linked demand aided by subsidized mortgage programs, ongoing logistics reform under the National Logistics Ecosystem, and channel shifts toward omnichannel retail continue to set the pace for the Indonesian home furniture market in 2026[1]Ministry of Public Works and Housing, “FLPP 2025 Tembus Ratusan Ribu Unit,” Kementerian Perumahan dan Kawasan Permukiman, pkp.go.id. The rollout of single-window port processes and digital documentation compressed clearance times and processing costs, improving reach into secondary and remote regions for bulky categories. Timber legality assurance through SVLK and FLEGT licensing strengthens buyer confidence for wood-based lines, especially in export-facing assortments. Within Indonesia, Java remains the core demand and supply base, while Papua and Maluku post the fastest growth on the back of improved maritime connectivity and flat-pack logistics economics.
Key Report Takeaways
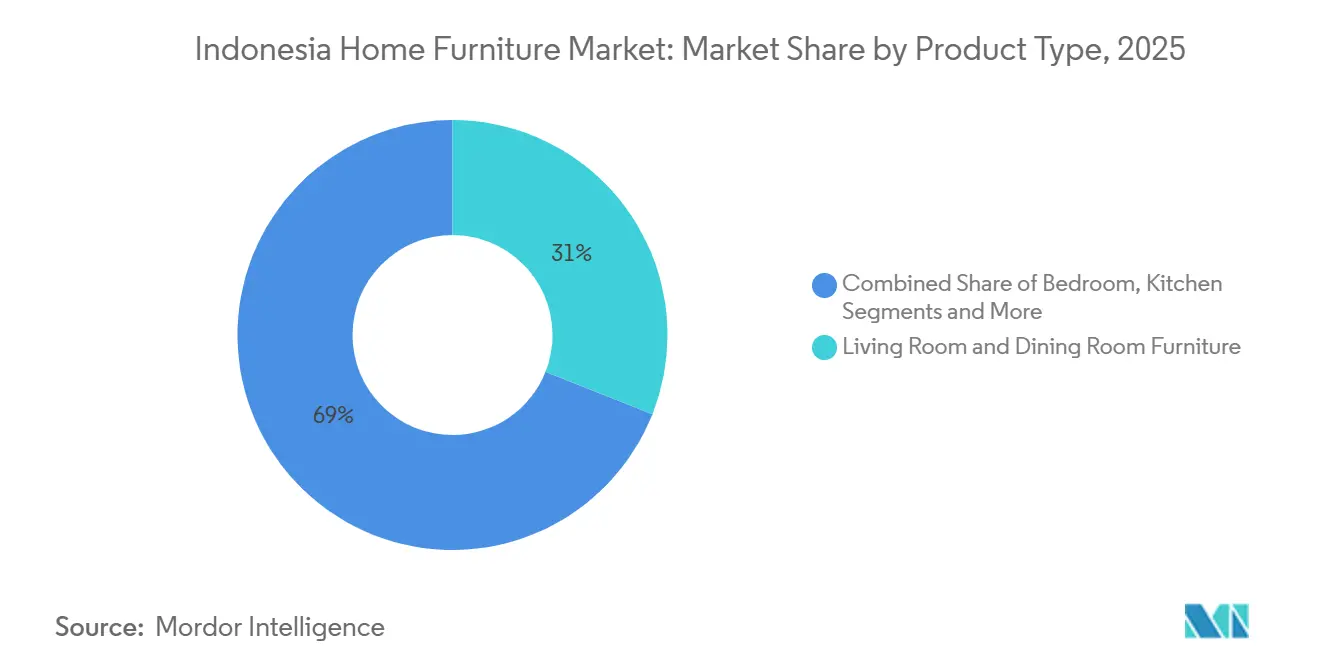
- By product type, living room and dining room furniture led with 31.00% of the Indonesia home furniture market share in 2025, while bedroom furniture is projected to expand at a 4.95% CAGR through 2031.
- By material, wood held 61.70% of the Indonesia home furniture market share in 2025, whereas plastic and polymer materials are forecast to grow at a 6.23% CAGR through 2031.
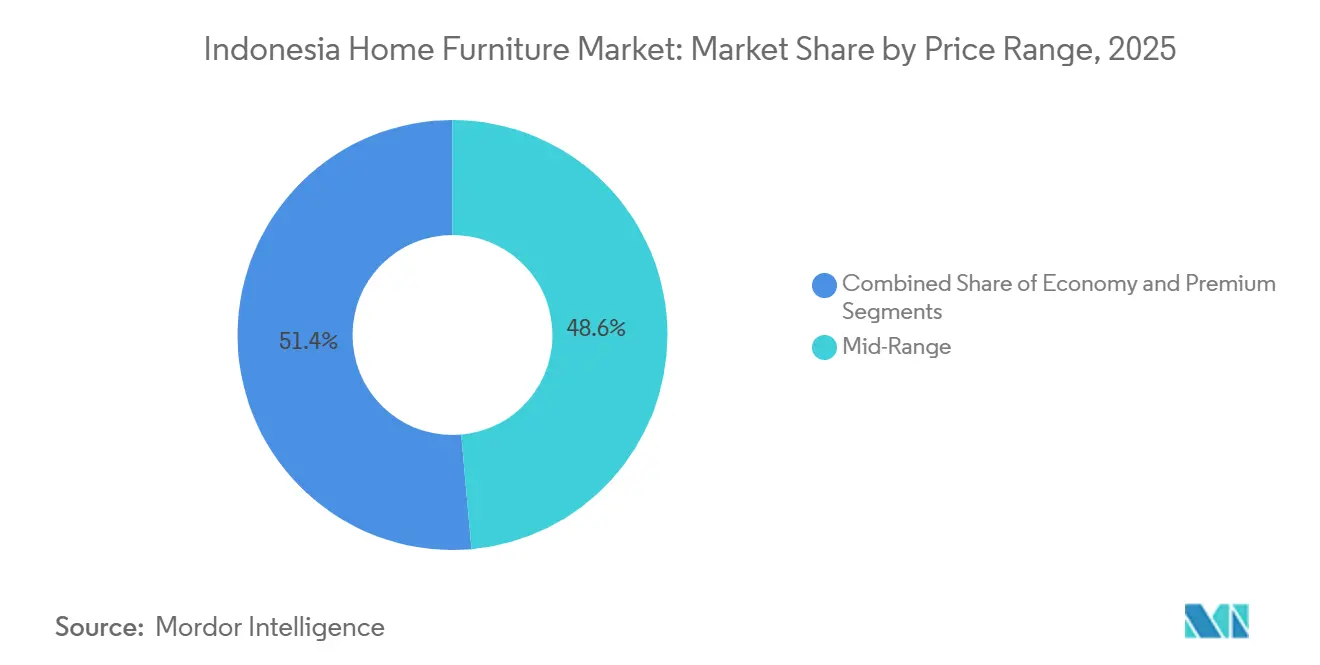
- By price range, mid-range captured 48.60% of the Indonesia home furniture market share in 2025, while premium is expected to advance at a 5.38% CAGR through 2031.
- By distribution channel, specialty furniture stores accounted for 40.90% of the Indonesia home furniture market share in 2025, whereas online channels are projected to grow at a 6.71% CAGR through 2031.
- By geography, Java held 57.80% of the Indonesia home furniture market share in 2025, while Papua and Maluku are projected to expand at a 5.55% CAGR through 2031.
Note: Market size and forecast figures in this report are generated using Mordor Intelligence’s proprietary estimation framework, updated with the latest available data and insights as of 2026.
Indonesia Home Furniture Market Trends and Insights
Drivers Impact Analysis*
| Driver | (~) % Impact on CAGR Forecast | Geographic Relevance | Impact Timeline |
|---|---|---|---|
| Video and social commerce adoption accelerate online furniture conversion | +0.9% | Global, with the highest traction in Java urban centers and rapid spillover to Sumatra, Sulawesi | Medium term (2-4 years) |
| Chain retail expansion into tier-2/3 cities increases category penetration | +0.7% | National, with early gains in Palangka Raya, Kendari, Tarakan, and Balikpapan | Medium term (2-4 years) |
| Subsidized housing finance (FLPP, TAPERA) supports first-time home furnishing | +1.2% | National, strongest in West Java, Central Java, and South Sumatra | Long term (≥ 4 years) |
| Timber legality (SVLK/FLEGT) strengthens trust and enables premium positioning | +0.5% | Export-focused, particularly the EU and UK markets, the domestic premium segment in Jakarta and Surabaya | Long term (≥ 4 years) |
| Logistics modernization (NLE, port process digitization) reduces delivery friction | +0.6% | National, with notable gains in Eastern Indonesia, including Papua, Maluku, and the outer islands | Long term (≥ 4 years) |
| Rise of knockdown/flat-pack designs optimized for e-commerce fulfillment | +0.3% | Global, led by Java manufacturing hubs with distribution across the archipelago | Short term (≤ 2 years) |
| Source: Mordor Intelligence | |||
Video and Social Commerce Adoption Accelerates Online Furniture Conversion
Digital content formats that show products in use, including live demonstrations and shoppable video, continue to change how Indonesians discover and evaluate furniture online, lifting conversion and compressing the path to purchase for high-consideration categories. The Indonesian home furniture market is adapting budgets and merchandising workflows to prioritize product storytelling, creator partnerships, and short video showcases that reduce hesitation for big-ticket purchases. This trend favors brands that can present multiple finish options, dimensions, and assembly steps within video catalogs that mirror in-store consultations. Retailers and manufacturers are also extending showroom experiences into virtual environments that allow rotation and zoom on sofas, bedroom sets, and dining tables, improving confidence before checkout. The Indonesian Logistics and Forwarders Association (ALFI) recorded transaction-volume spikes during Payday moments, with daily product sales growing 41% month-over-month in September 2025 beta phases, indicating that synchronized payment cycles and real-time engagement are creating predictable demand surges that manufacturers can pre-position inventory against [2]Indira Pranasdita, “Fitur Baru Vidio x Shopee, Vidio Shopping: Belanja Bisa Sambil Nonton!,” IDN Times, idntimes.com.
Chain Retail Expansion into Tier-2/3 Cities Increases Category Penetration.
National chains are extending coverage into underserved cities with store formats that present complete rooms and project bundles, improving attachment rates across seating, tables, storage, and accessories. Openings in frontier and secondary locations, such as Tarakan, signal confidence that better maritime and road links can support bulky-goods delivery promises and post-sale service levels. As logistics costs trend lower as a share of GDP, these stores can offer freight promotions in defined radiuses around new outlets, helping close historical availability gaps for branded furniture. Display zoning and project visualization also help first-time homeowners select coherent sets that fit room dimensions and budgets [3]Editorial Team, “INFORMA,” INFORMA, informa.co.id. The Indonesian home furniture market benefits when wider physical access works in tandem with online research, enabling omnichannel journeys that raise conversion and improve repeat purchase cycles beyond Java’s core metros.
Subsidized Housing Finance (FLPP, TAPERA) Supports First-Time Home Furnishing
The Housing Financing Liquidity Facility recorded a high watermark of 270,985 units financed by late 2025, channeling funds across scores of banks and developers and catalyzing furniture demand as beneficiaries take possession of new homes. As households finalize mortgages and move in, spending shifts toward essential furnishings, starting with the bedroom, living, dining, and basic storage that match compact floor plans. The Indonesian home furniture market gains from this steady pipeline of first-time buyers, who are prone to value-driven selections, knockdown designs, and curated room bundles suitable for smaller footprints. Concentrations of FLPP activity in provinces like West Java and Central Java also create local hotspots for store traffic and delivery runs, improving route density and fulfillment economics. Over time, repeat purchases and upgrades extend the value of each cohort as incomes grow and space usage changes within households that start with entry-level sets and trade up to mid-range or premium lines.
Timber Legality (SVLK/FLEGT) Strengthens Trust and Enables Premium Positioning
Indonesia’s timber legality assurance through SVLK, coupled with FLEGT licensing, shortens verification for compliant shipments into the UK and EU, reducing uncertainty for buyers of wood-based furniture and components [4]UK Office for Product Safety and Standards, “UK Government FLEGT Report 2024 to 2025,” GOV.UK, gov.uk. Clear chain-of-custody and geolocation-backed documentation align with emerging European deforestation benchmarks, positioning Indonesian producers to maintain access as enforcement phases in. Certification processes and surveillance audits conducted by recognized bodies give importers confidence, which supports the premium placement of solid-wood and veneer products. Peer-reviewed research has documented positive pricing and performance effects associated with legality assurance, reinforcing the business case for certified sourcing and manufacturing. For the Indonesian home furniture market, these features sustain competitive differentiation versus uncertified alternatives in both domestic premium tiers and international assortments.
Restraints Impact Analysis*
| Restraint | (~) % Impact on CAGR Forecast | Geographic Relevance | Impact Timeline |
|---|---|---|---|
| High inter-island logistics costs and delivery lead times | -0.8% | Eastern Indonesia, Papua & Maluku, remote islands with limited port infrastructure | Long term (≥ 4 years) |
| The compliance burden of SVLK for MSMEs raises the cost of goods | -0.4% | National, particularly affecting smaller manufacturers in Java, Kalimantan, and Sumatra | Medium term (2-4 years) |
| Regulatory volatility in social commerce platforms disrupts seller channels | -0.3% | National, with the highest exposure in Java and Sumatra, where digital adoption is concentrated | Short term (≤ 2 years) |
| High vacancy/misallocation in subsidized housing dampens furniture conversion | -0.5% | National, especially in peripheral regions where housing allocations exceed immediate occupancy | Medium term (2-4 years) |
| Source: Mordor Intelligence | |||
High Inter-Island Logistics Costs and Delivery Lead Times
While national reforms have improved average logistics performance, structural premiums persist on long-haul domestic routes serving island provinces. Ocean-freight comparisons show that moving cargo from China to Jakarta can be competitively priced on international lanes, yet domestic inter-island routes remain costly and slow for similar equipment types and durations. For retailers sending containerized shipments to eastern destinations such as Jayapura, end-to-end costs and extended dwell can force higher inventory buffers or narrower assortments in distant stores. Remote-area surcharges and variable port conditions further complicate reliable lead times, discouraging ambitious service-level promises beyond major hubs. The Indonesian home furniture market, therefore, calibrates its eastern expansion plans around cross-docks, flat-pack formats, and staggered delivery offers to maintain affordability and protect margins until route economics improve. Even with better digital processes at large ports, hinterland transport and inter-island transshipment continue to account for a large share of delivered costs on bulky SKUs.
Compliance Burden of SVLK for MSMEs Raises Cost of Goods
SVLK requires audits by accredited bodies, surveillance over the certificate lifecycle, and documented controls across sourcing and processing, which can weigh heavily on micro and small producers. Audit cadence and documentation standards create recurring administrative work that diverts managerial focus from product development when capabilities and resources are thin. Although legality assurance eases access to regulated export markets, upfront and ongoing compliance can raise unit costs for MSMEs that lack scale, challenging price competitiveness in budget segments. Public programs to modernize machinery and production systems have helped selected firms, but the reach and value of reimbursements to date underscore the need for wider support to lift sector capabilities. For the Indonesia home furniture market, this creates a split where larger integrated manufacturers capture the benefits of certification more easily, while smaller workshops face tougher trade-offs.
*Our forecasts treat driver/restraint impacts as directional, not additive. The impact forecasts reflect baseline growth, mix effects, and variable interactions.
Segment Analysis
By Product Type: Hybrid Work Rewires Bedroom Demand
Living room and dining room furniture held 31.00% of 2025 revenue as social gathering and shared meals remain central to household routines, with families prioritizing sofas, dining sets, and storage that anchor the main shared spaces. The Indonesian home furniture market continues to promote modular seating and extendable tables to accommodate growing families and multi-use rooms without expanding floor area. Bedroom furniture is projected to grow at a 4.95% CAGR through 2031, with the Indonesian home furniture market size for bedroom lines expected to reach USD 0.48 billion by 2031 as flexible work arrangements sustain demand for desks, ergonomic chairs, and integrated storage. This shift has placed greater emphasis on items that combine sleep, study, and storage functions in compact layouts, supporting value propositions built around adaptability. Integrated manufacturers with broad catalogs also benefit from residential project orders that specify coordinated components, bridging retail and B2B flows as housing delivery scales.
Kitchen furniture tracks the adoption of open-plan layouts in mid-market apartments and landed homes, where storage and prep surfaces are designed to improve perceived space and functionality. The Indonesian home furniture industry aligns cabinetry modules, finishes, and hardware standards to speed installation and facilitate post-move upgrades without full remodels. Home-office categories continue to see resilient interest as households plan for hybrid schedules, privacy screens, and wire-management features that reduce clutter in small rooms. Outdoor furniture gains traction as balconies and courtyard spaces become more common in new developments, favoring weather-resistant finishes and lighter materials that ease last-mile delivery. Bathroom furniture remains smaller in mix but benefits from hospitality refurbishments and premium residential upgrades where moisture-resistant woods and engineered materials meet performance expectations.


By Material: Plastic Gains as Flat-Pack Economics Favor Lightweight
Wood furniture captured 61.70% of 2025 revenue, reflecting consumer preferences for durable, natural materials supported by legality certification and export credibility under SVLK and FLEGT schemes. The Indonesian home furniture market benefits from long-standing woodcraft hubs and integrated producers with secured raw-material supply, which stabilizes sourcing and supports consistent quality in large volumes. Vertically integrated players with forest concessions and multi-plant capacity ensure component availability across popular species and engineered alternatives for moisture-prone rooms. Plastic and polymer lines are growing at a 6.23% CAGR as flat-pack and lightweight profiles compress shipping costs and support simpler self-assembly for small-parcel delivery models. Popular online listings for plastic wardrobes, folding tables, and modular drawers show strong traction, highlighting acceptance of synthetic materials for budget-conscious and space-constrained buyers.
Within wood, premium assortments appeal to buyers who value provenance and finish consistency, with certifications and traceability supporting positioning in both domestic and export channels. Metal frames and mixed-material designs support minimalist aesthetics and institutional uses where durability dictates specifications, though commodity input volatility can affect margins for producers with limited hedging. The Indonesian home furniture market addresses this with catalog planning that mixes core SKUs and batch runs aligned to price windows and procurement cycles. Rattan and bamboo maintain cultural relevance and hospitality appeal, with organized manufacturers supporting traceable sourcing and export-ready finishes for outdoor and indoor uses. Over the forecast period, the materials mix will reflect continued strength in wood for core rooms, growing plastic and polymer share online, and selective metal use in office shelving and hybrid pieces that balance structure and weight.
By Price Range: Premium Surges as Dual-Income Households Upgrade
Mid-range accounted for 48.60% of 2025 revenue as organized brands compete on value, availability, and after-sales service that meet the expectations of first-time homebuyers and upgraders. The Indonesian home furniture market directs assortments toward functional durability and coordinated room bundles that simplify decisions and fit within financing or staged purchasing plans. Trusted retailers leverage footprint, delivery, and assembly services to reinforce reliability for big-ticket purchases in key cities and growing corridors. Entry-level buyers also trend toward flat-pack and synthetic materials when shipping or legality certification costs push wood alternatives out of reach, reinforcing a broad base for value-focused SKUs online.
Premium is projected to grow at a 5.38% CAGR to 2031 as consumers invest in elevated aesthetics, custom options, and long-life construction aligned with status and comfort. The Indonesian home furniture industry responds with designs that integrate charging, adjustability, and cable management while preserving material and finish integrity for living, dining, and bedroom sets. Bedding and sleep-adjacent categories support premium tickets in room packages, with retailers using white-glove delivery and installation to differentiate experiences. As households cycle through upgrades, premium penetration expands in major metros first, then filters into secondary cities as incomes and retail options grow.
By Distribution Channel: Online Velocity Tests, Specialty Stores
Specialty furniture stores commanded 40.90% of 2025 revenue due to tactile evaluation, in-store consultation, and immediate availability for in-stock items that matter in high-consideration purchases. The Indonesian home furniture market relies on these stores to anchor omnichannel journeys by enabling try-before-buy, integrated room planning, and bundled delivery and assembly. Showroom zoning into living, dining, sleeping, and junior areas improves visualization and attachment rates for coordinated sets, while financing and service offers ease commitment for larger baskets. The Indonesian home furniture market size is attributed to specialty retail benefits from dense networks in Java and selective extensions into emerging cities with improving route economics.
Online channels are forecast to expand at a 6.71% CAGR through 2031 as marketplaces and social commerce improve discovery, video-based guidance, and checkout convenience for bulky assortments configured for flat-pack delivery. Virtual showroom features that enable product rotation and zoom help close the gap with physical tryouts for sofas, wardrobes, beds, and larger storage pieces. High-velocity SKUs on marketplaces include compact wardrobes and foldable desks that match space and budget needs in apartments and small homes. Over time, the strongest brands treat online and offline as one ecosystem, focusing on total lifetime value across research online, purchase offline, and purchase online, pickup or delivery paths.
Geography Analysis
Java held 57.80% in 2025 due to its manufacturing clusters, skilled labor supply, and access to main ports, along with concentrated purchasing power in Jakarta, Surabaya, Bandung, and Semarang. The Indonesian home furniture market size, attributed to Java, also benefits from sizable allocations under subsidized housing, which creates local waves of first-time furnishing in fast-growing districts. Retail density and logistics advantages allow Java-based stores to support same-week delivery for many SKUs, while omnichannel offerings link online research with in-person consultations. Java’s ecosystem further supports component production and finishing capacity for export-oriented players, reinforcing its dual role as a domestic and international supply base within the Indonesian home furniture market.
Sumatra, Kalimantan, and Sulawesi are expanding as improved freight links and port processes raise reliability and lower costs, opening more cities to full-service delivery for bulky goods. The Indonesian home furniture market sees gains in these regions as national retailers test new showrooms and smaller formats that balance assortment breadth with manageable delivery radiuses. Projects linked to industrial and infrastructure investment attract professionals who prioritize modern furnishings for rentals and new homes, lifting demand for living, bedroom, and home-office categories. As fulfillment networks mature, online channels complement limited local retail choices by offering broader catalogs through flat-pack delivery with predictable timelines.
Papua and Maluku are projected to post the fastest growth at a 5.55% CAGR through 2031 as maritime connectivity initiatives and cross-dock strategies improve service levels. The Indonesian home furniture market expands here by leveraging knockdown designs and standardized packaging that reduce volumetric shipping charges and damage risk, making products more affordable at the destination. Bali and Nusa Tenggara benefit from hospitality refurbishments and rising residential upgrades that favor outdoor and rattan assortments with island aesthetics. Continued logistics digitization and cost improvements are expected to further increase the share of households reachable with viable delivery and assembly offers across the eastern archipelago.
Competitive Landscape
The Indonesian home furniture market remains fragmented, with the top five players accounting for less than half of revenue, and a long tail of MSMEs serving local and online demand. Organized leaders differentiate through vertical integration, legality assurance, retail density, and omnichannel capabilities that support assortment breadth and consistent service levels. PT Integra Indocabinet Tbk highlights this integrated model with upstream concessions, multi-plant capacity, and a portfolio that spans finished furniture and building components for residential and commercial projects. Export-focused firms also align with legality and traceability requirements in main destination markets, preserving access and mitigating policy risk.
Retail-focused players leverage store networks for tactile evaluation and cross-selling, including multi-zone layouts that bundle living, dining, sleeping, and junior rooms. Expansion into emerging corridors, such as Tarakan, indicates growing confidence in serviceable delivery radii as logistics metrics improve, and these openings serve as anchors for omnichannel growth. Brands reinforce positioning online with product videos and visualization tools that support self-service discovery for large baskets. Premium and design-led labels emphasize material provenance and legality credentials for domestic and export buyers, using certifications to support brand narratives and price realization.
Strategic moves reflect several patterns. Vertically integrated exporters are adding building components and project-ready kits to meet developer needs while balancing retail assortments for core rooms. Retailers are deepening omnichannel experiences and expanding selectively into new geographies as delivery economics improve, while platform sellers optimize flat-pack catalogs for fast-moving online demand. Policy shifts, such as the Indonesia–EU CEPA agreement, reinforce export incentives for compliant supply chains, favoring firms that have invested in traceability and documentation systems. As this landscape evolves, the Indonesian home furniture market rewards capabilities in sourcing, compliance, content-driven selling, and last-mile execution that together support growth across channels and regions.
Indonesia Home Furniture Industry Leaders
PT Integra Indocabinet Tbk (Integra Group)
Olympic Furniture (PT Graha Multi Bintang)
PT Chitose Internasional Tbk
VIVERE Group / PT Vivere Multi Kreasi
Vinoti Living
- *Disclaimer: Major Players sorted in no particular order

Recent Industry Developments
- December 2025: Indonesia's Ministry of Trade secured Rp 2 trillion (USD 119 million) export-credit facility via Indonesia Eximbank at 6% interest to support furniture manufacturers, addressing limited access to affordable funding and boosting productivity for global competitiveness, following advocacy by Indonesian Chamber of Commerce (Kadin) and Indonesian Furniture and Handicraft Industry Association (Himki) to increase Indonesia's USD 2.5 billion share in the USD 300 billion global furniture market heavily reliant on the US (60% of exports).
- October 2025: Asia Investment Capital acquired 70.96% (1.17 billion shares) of PT Boston Furniture Industries Tbk (SOFA) from shareholders Hardy Satya, Yohan Satya, and Dimas Adiyasa Wiryaatmaja via Conditional Share Sale and Purchase Agreement signed October 17, with deadline October 31 for fulfilling closing prerequisites, marking change of control for Indonesian wood-and-metal furniture producer and triggering compliance with OJK Regulation No. 9/POJK.04/2018 on public-company takeovers.
- September 2025: Jason Furniture (Hangzhou) announced USD 156.8 million (CNY 1.1 billion) investment in new production base in Semarang, Central Java, with groundbreaking in Q3 2025, four-year construction period, and phased production start-up, targeting full capacity three years post-completion with annual sales exceeding CNY 2.5 billion, mitigating trade-environment risks and meeting overseas customer demand as company expands beyond existing US, Mexico, and Vietnam factories that generated CNY 8.4 billion (USD 1.2 billion) in 2024 overseas sales.


Indonesia Home Furniture Market Report Scope
Furniture is a movable article used in a room or space suitable for working and living. The scope includes furniture used in residential, commercial, hospitality, and other applications.
The Indonesia Home Furniture Market Report is Segmented by Product Type (Living Room & Dining Room Furniture, Bedroom Furniture, Kitchen Furniture, Home Office Furniture, Bathroom Furniture, Outdoor Furniture, and Other Furniture), Material (Wood, Metal, Plastic & Polymer, and Others), Price Range (Economy, Mid-Range, and Premium), Distribution Channel (Home Centers, Specialty Furniture Stores, Online, and Other Distribution Channels), and Geography (Java, Sumatra, Kalimantan, Sulawesi, Bali & Nusa Tenggara, and Papua & Maluku). The Market Forecasts are Provided in Terms of Value (USD).
By Product
| Living Room & Dining Room Furniture |
| Bedroom Furniture |
| Kitchen Furniture |
| Home Office Furniture |
| Bathroom Furniture |
| Outdoor Furniture |
| Other Furniture |
By Material
| Wood |
| Metal |
| Plastic & Polymer |
| Others |
By Price Range
| Economy |
| Mid-Range |
| Premium |
By Distribution Channel
| Home Centers |
| Specialty Furniture Stores |
| Online |
| Other Distribution Channels |
By Geography
| Java |
| Sumatra |
| Kalimantan |
| Sulawesi |
| Bali & Nusa Tenggara |
| Papua & Maluku |
| By Product | Living Room & Dining Room Furniture |
| Bedroom Furniture | |
| Kitchen Furniture | |
| Home Office Furniture | |
| Bathroom Furniture | |
| Outdoor Furniture | |
| Other Furniture | |
| By Material | Wood |
| Metal | |
| Plastic & Polymer | |
| Others | |
| By Price Range | Economy |
| Mid-Range | |
| Premium | |
| By Distribution Channel | Home Centers |
| Specialty Furniture Stores | |
| Online | |
| Other Distribution Channels | |
| By Geography | Java |
| Sumatra | |
| Kalimantan | |
| Sulawesi | |
| Bali & Nusa Tenggara | |
| Papua & Maluku |


Key Questions Answered in the Report
What is the size and forecast growth of the Indonesia home furniture market to 2031?
The Indonesia home furniture market size is expected to reach USD 6.32 billion by 2031, growing at a 4.19% CAGR over 2026-2031. .
Which product categories are leading, and which are growing the fastest in Indonesia?
The living room and dining room led with 31.00% revenue share in 2025, while bedroom furniture is projected to grow the fastest at a 4.95% CAGR to 2031.
How are logistics reforms shaping furniture distribution across Indonesia?
The National Logistics Ecosystem has reduced clearance times and processing costs at major ports, improving viable delivery reach for flat-pack furniture into secondary and eastern regions.
What materials dominate furniture demand in Indonesia?
Wood held 61.70% of 2025 revenue supported by SVLK/FLEGT legality assurance, while plastic and polymer lines are expanding fastest due to flat-pack and last-mile advantages.
Which regions contribute most to Indonesia’s furniture demand?
Java led with 57.80% of 2025 revenue due to manufacturing clusters and retail density, while Papua and Maluku are expected to grow the fastest at a 5.55% CAGR.
How do subsidized housing programs influence furniture sales?
Financing under FLPP increases first-time home occupancy, creating waves of essential furnishing purchases that boost living, bedroom, and storage categories near project clusters.
Page last updated on:


