
Indonesia E-commerce Market Analysis by Mordor Intelligence
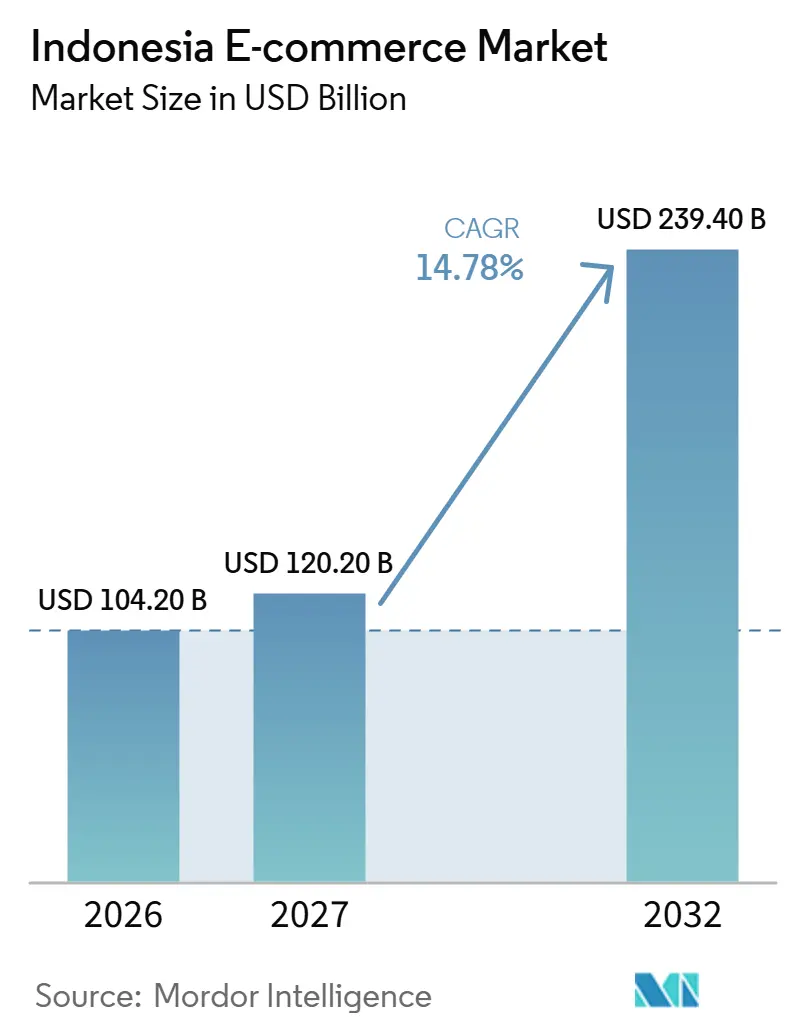
The Indonesia e-commerce market size is expected to increase from USD 104.2 billion in 2026 to USD 120.2 billion in 2027 and reach USD 239.4 billion by 2032, growing at a CAGR of 14.78% over 2027-2032.
Live shopping and PayLater checkout connect product presentation with purchasing capacity for sellers serving online buyers in Indonesia. Regional fulfillment nodes add an operational path for reaching customers beyond a merchant’s existing dispatch base. Platforms reinforce that offer through local-product channels, creator partnerships, and managed services extending from discovery to order execution. Jakarta traffic restrictions, however, can raise distribution costs after sellers have attracted demand. Failed cash-on-delivery (COD) handoffs add return handling to that cost, so live shopping and PayLater campaigns pay off only when orders survive delivery.
Key Report Takeaways
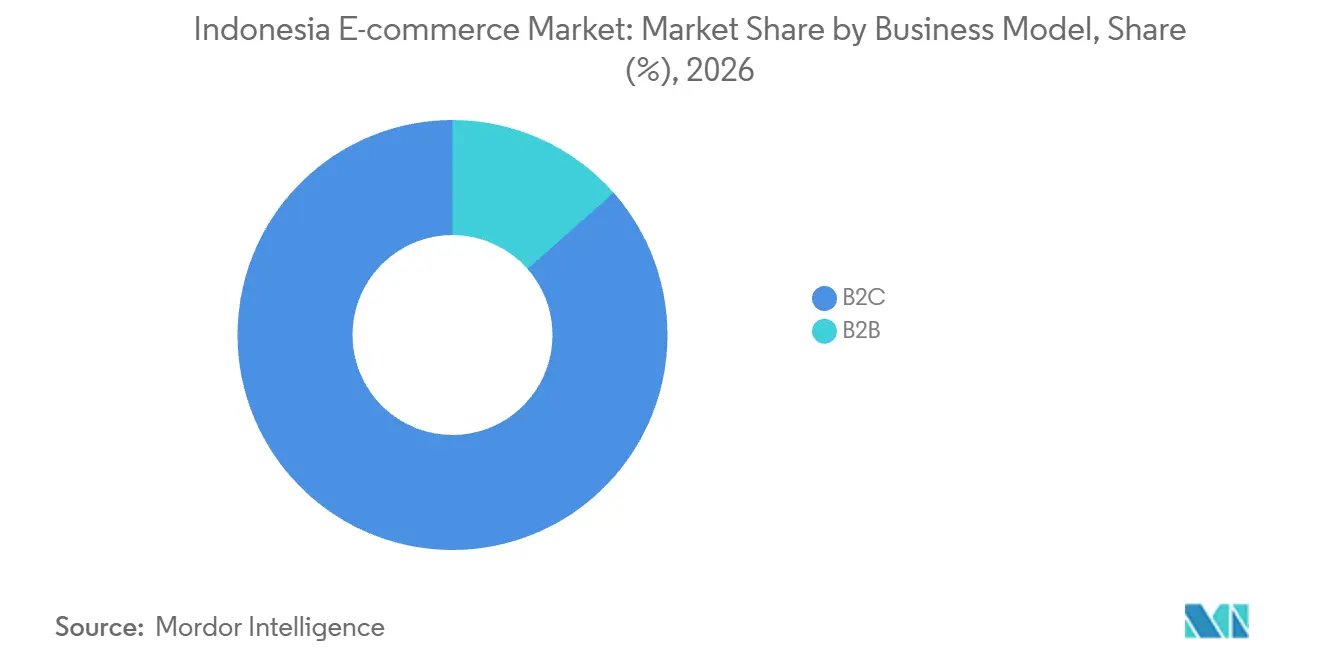
- By business model, B2C held an 86.51% share of the Indonesia e-commerce market size in 2026, while B2B is forecast to be the fastest-growing segment at a CAGR of 18.2% over 2027-2032.
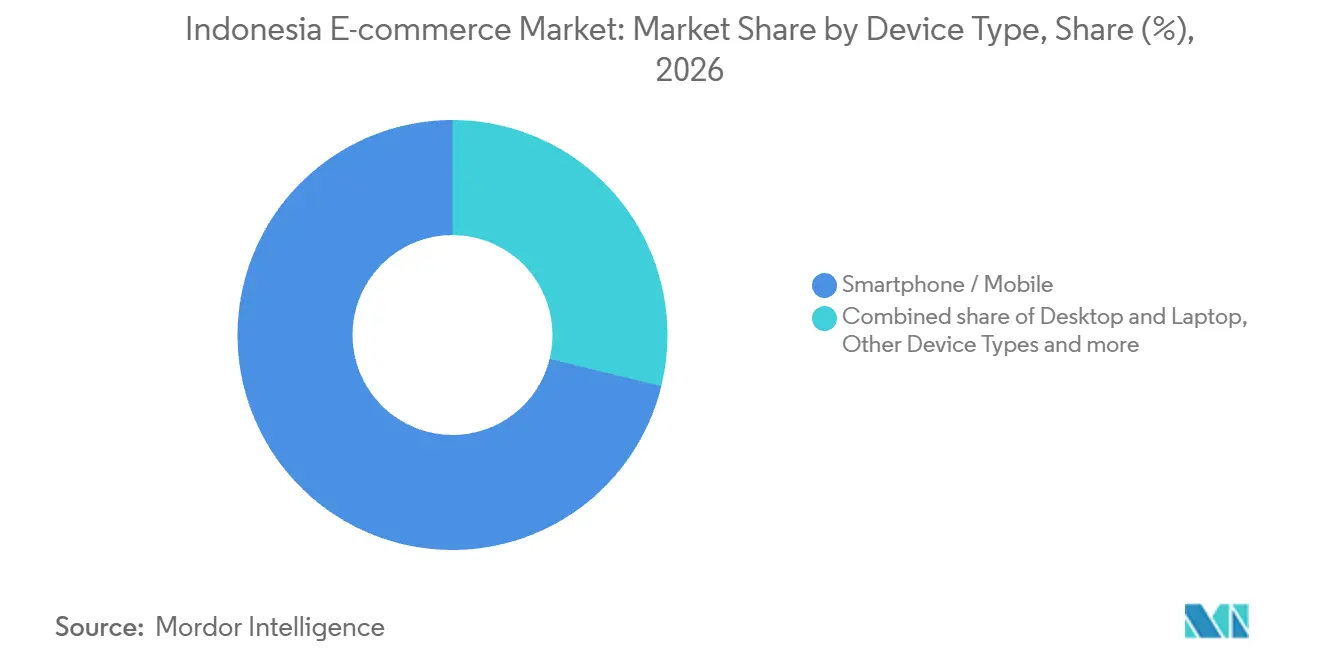
- Smartphone/mobile commerce led device types with a 71.17% Indonesia e-commerce market share in 2026 and is forecast to grow fastest at a CAGR of 17.85% over 2027-2032.
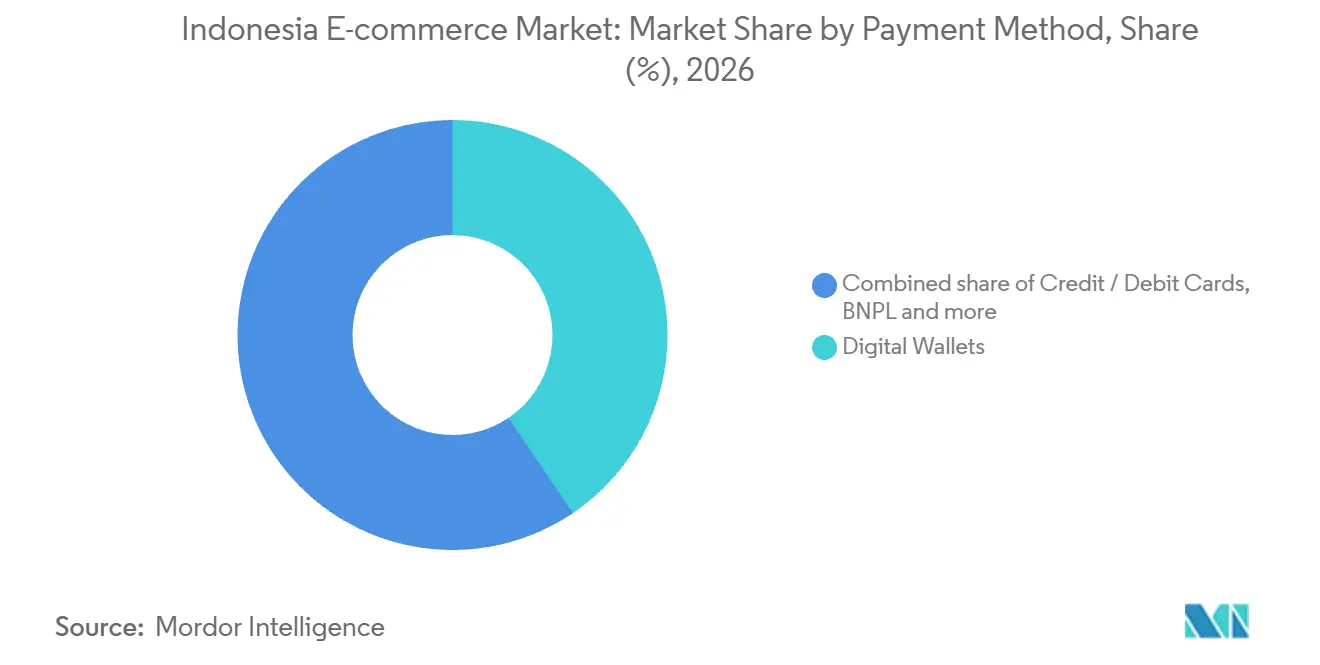
- Among payment methods, digital wallets led with 40.54% of e-commerce payment value in 2026, while BNPL is projected to grow fastest at a CAGR of 26.4% over 2027-2032.
- Within B2C product categories, consumer electronics accounted for 24.06% of B2C e-commerce value in 2026, while the food and beverages segment is forecast to grow fastest at a CAGR of 20.9% over 2027-2032.
- Across the geographic landscape, Java accounts for the majority of orders, alongside its concentration of top-ranked online-buyer and online-seller areas.
Note: Market numbers in this report are based on Mordor Intelligence's proprietary estimation framework, which combines nine months of actuals with Q4 projections for base year 2026.
Indonesia E-commerce Market Trends and Insights
Drivers Impact Analysis*
| Driver | (~) % Impact on CAGR Forecast | Geographic Relevance | Impact Timeline |
|---|---|---|---|
| Surge in Live-stream Shopping Adoption on Mobile Apps | +5.5% | Greater Jakarta and other Java areas | Short term (≤ 2 years) |
| Rapid Digitization of Tier-2/3 Cities via Logistics Micro-Hubs | +4.5% | Palembang and nearby South Sumatra areas | Medium term (2-4 years) |
| Fintech-Led Checkout (‘PayLater’) Boosting Average Order Value | +3.6% | Nationwide | Short term (≤ 2 years) |
| Government’s ‘Making Indonesia 4.0’ SME On-Boarding Programs | +1.3% | Nationwide | Medium term (2-4 years) |
| Rising Cross-border Seller Participation via Singapore and China Gateways | +1.1% | Nationwide | Medium term (2-4 years) |
| Social-Commerce Integration with WhatsApp and Instagram APIs | +0.8% | Nationwide | Short term (≤ 2 years) |
| Source: Mordor Intelligence | |||
Surge in Live-stream Shopping Adoption on Mobile Apps
Live shopping gives sellers a channel with demonstrated use and a role in customer purchase decisions. In Jakpat’s November to December 2025 survey, 76% of 776 Indonesian respondents who had shopped through live shopping said they had used Shopee Live. For a seller, that audience provides a route to consumers already familiar with purchasing through the format. A 2025 purposive study of 105 Barenbliss customers using Shopee live streaming reported a significant relationship between live-stream commerce and purchase decisions. Beauty brands can therefore organize live presentations around the product choices they want to support, connecting audience access with a specific merchandising task.
Rapid Digitization of Tier-2/3 Cities via Logistics Micro-Hubs
Regional fulfillment capacity gives online sellers a practical route to serve buyers beyond their existing dispatch base. PowerCommerce.Asia opened a multi-fulfillment hub in Palembang in October 2025 to cover South Sumatra and nearby areas, according to its founder and group CEO. The commercial significance lies in adding a regional point around which merchants can organize fulfillment, rather than extending only the storefront’s digital reach. For sellers targeting that service area, a local fulfillment option can make distribution arrangements more closely match the geography of their intended customers. This can support demand by making a wider online offer operationally feasible, although its economics depend on the orders allocated to the node. The hub opened during the October 2025 10.10 shopping event, putting the new fulfillment option in place for that selling occasion.
Fintech-Led Checkout (‘PayLater’) Boosting Average Order Value
PayLater can widen the purchase a customer is able to complete by separating checkout from immediate full payment. The Indonesia Financial Services Authority (OJK) reported 34 million bank buy now pay later (BNPL) accounts in Indonesia in August 2026. Outstanding bank BNPL financing grew 29.10% year over year that month, although growth eased from 31.22% in July. At online checkout, ShopeePay lets customers select SPayLater on a merchant’s page and continue through its app or web payment flow. The bank BNPL base shows the scale of deferred-payment credit, and the ShopeePay flow shows how a merchant page presents PayLater at checkout, so higher baskets depend on customers choosing that option. The opportunity for higher order value depends on customers having sufficient approved borrowing capacity for the added spend, making usable credit at the payment step the relevant demand mechanism.
Government’s ‘Making Indonesia 4.0’ SME On-Boarding Programs
Government onboarding support addresses the skills needed to turn small manufacturers into effective online sellers. Indonesia’s Ministry of Industry reported that combined e-Smart, digital-literacy, and Making Indonesia 4.0 programs reached 376 small and medium industrial enterprises against a target of 364 through the third quarter of 2026.[1] Its April 1, 2026, workshop in Badung, Bali, served 80 local participants with digital marketing, product photography, and marketplace-marketing instruction. These activities connect policy support to the practical task of presenting products for online purchase. For marketplaces, converting this training reach into demand requires manufacturers to turn their skills in digital marketing, product photography, and marketplace marketing into active product offers that buyers can order.
Restraints Impact Analysis*
| Restraint | (~) % Impact on CAGR Forecast | Geographic Relevance | Impact Timeline |
|---|---|---|---|
| Fulfillment Cost Inflation from Jakarta Traffic Restrictions | -0.9% | Designated roads in Jakarta | Short term (≤ 2 years) |
| Persistent Cash-on-Delivery Risk Elevating Return Rates | -0.6% | East Bandung courier service area | Short term (≤ 2 years) |
| Data-Localization Rules Raising Cloud-Hosting Expense | -0.3% | Nationwide | Medium term (2-4 years) |
| Talent Shortage in Last-Mile Cold-Chain Logistics | -0.2% | Nationwide | Long term (≥ 4 years) |
| Source: Mordor Intelligence | |||
Fulfillment Cost Inflation from Jakarta Traffic Restrictions
Restricted road access makes vehicle eligibility a cost variable for Jakarta distribution operations. The odd-even rule covers designated roads on weekdays from 6:00 to 10:00 a.m. and 4:00 to 9:00 p.m., excluding national holidays. Motorcycles, electric vehicles, and other specified categories are exempt, which concentrates the burden on affected vehicles and routes. A study published in 2022 by researchers at Institut Pertanian Bogor (IPB) linked higher expedition-company distribution costs to longer customer routes when vehicle plates did not match the permitted parity. For e-commerce fulfillment, that mechanism can increase the resources needed to feed delivery networks even when exempt vehicles handle the final customer leg. Operators using affected distribution vehicles therefore face a narrower choice between longer routes and restricted dispatch windows, limiting economical service flexibility.
Persistent Cash-on-Delivery Risk Elevating Return Rates
A failed cash-on-delivery handoff leaves a courier with distribution work already performed and another parcel movement to arrange. A study used 60 daily observations from one East Bandung branch in November to December 2025, where approximately 90% of transactions were COD. Within that model, return rates had a larger effect on estimated operating costs than shipment volume. The authors described unrecovered distribution costs, transit storage, and courier trips returning parcels to their origin as components of the burden. For operators serving similarly COD-heavy order flows, additional outbound volume can therefore coexist with weaker economics when failed handoffs consume the same delivery resources again. The resulting constraint is a service cost that extends beyond reaching the customer, leaving both outbound effort and reverse handling to be recovered from successful business.
*Our forecasts treat driver/restraint impacts as directional, not additive. The impact forecasts reflect baseline growth, mix effects, and variable interactions.
Segment Analysis
By Business Model: Direct Retail Scale Meets Variable Business Orders
B2C accounted for an 86.51% share of the Indonesia e-commerce market size in 2026. Blibli reported 47% year-over-year growth in the value of paid and delivered purchases for its online first-party B2C retail segment in the second quarter of 2026.[2] The segment spans first-party products and services across categories, placing the retailer’s own offer at the center of those completed transactions. Because that measure counts paid and delivered purchases, the growth concerns fulfilled orders, tying the first-party retailer’s sales opportunity to completing delivery of its own offer.
B2B is forecast to be the fastest-growing segment, with a CAGR of 18.2% over 2027-2032. PT MONOTARO INDONESIA reported 16.9% year-over-year sales growth in local currency in 2025.[3] Sales nevertheless missed plan, which the company attributed to declining high-value orders and more government-encouraged holidays around Ramadan. For B2B platforms, a year in which sales grew yet missed plan after fewer high-value orders and more holidays shows that results depend on the timing of large purchases and on working days.

By Device Type: Mobile Commerce Links Scale With Interface Control
Smartphone/mobile commerce held 71.17% of total e-commerce value in 2026 and is forecast to grow at a CAGR of 17.85% over 2027-2032, making mobile the largest and fastest-growing segment. A checkout fault on phones would put access to the channel carrying most industry transaction value at risk, even if a seller could accept orders through other devices. For a merchant facing that fault, restoring mobile order completion takes priority over expanding device coverage because the existing spending pool is already concentrated on phones.
A merchant choosing between its own app and a marketplace flow decides who controls the mobile purchase journey. PT Fast Food Indonesia Tbk reported that sales through aggregators and KFCku Apps together grew 25% in 2025. Transactions through those combined channels increased 27% in 2025. An owned app puts navigation and checkout design within the seller’s service offer, while an aggregator requires integration with its platform’s flow.
By Payment Method: Wallet Reach and Deferred Payment Serve Different Needs
Digital wallets represented a 40.54% Indonesia e-commerce market share in 2026. In Jakpat’s August 2026 survey, 68% of Indonesian e-wallet users surveyed said they used wallets to pay for online shopping. A merchant offering wallet checkout can serve buyers already using that payment method for online purchases. In Jakpat’s November 2025 survey, 72% of 1,945 Indonesian e-wallet users aged 17 to 55 reported using DANA. For merchants choosing integrations, wallet-brand reach and use for online shopping are separate considerations, so accepting a widely used brand addresses only one part of the checkout decision.
BNPL is forecast to be the fastest-growing segment, with a CAGR of 26.4% over 2027-2032. Kredivo reported that transaction volume across its PayLater business grew 27% during Ramadan and Lebaran 2026 compared with the same period a year earlier. That transaction flow gives merchants and financing providers a concrete buying period around which to organize their service, linking deferred payment with the timing of purchase activity. Its PayLater transaction value rose 26% in the same comparison, so the seasonal gain appeared in both the count and the value of purchases.
By B2C Product Category: Electronics Value and Food Demand Favor Different Offers
Consumer electronics accounted for 24.06% of B2C e-commerce value in 2026, making it the largest product segment. In the Indonesian Internet Service Providers Association’s (APJII) February to March 2026 survey of 8,700 people aged 13 or older across 38 provinces, 7.4% reported online transactions for electronics and gadgets. The value-based lead and the survey’s buyer participation describe separate dimensions of the category’s commercial opportunity.
The food and beverages category is forecast to be the fastest-growing segment, with a CAGR of 20.9% over 2027-2032. Indonesia’s Ministry of Trade named local food and beverage products among the 3 most sought-after local product categories during Harbolnas, the national online shopping event held December 10 to 16, 2025. In the February to March 2026 APJII survey, 12.7% of respondents reported online transactions for food and beverages. For local food sellers, the 2025 result supports timing offers to the December shopping event because demand for their category was demonstrated within that local-product buying occasion.
Geography Analysis
Java E-commerce Market
Java accounts for the majority of orders. In 2025, all 10 Indonesian regencies or cities with the highest online-seller rates were in Java, as were 9 of the 10 areas with the highest online-buyer rates. Bekasi City alone had 1.1 million online buyers in 2025, providing a substantial consumer base within the island. For platforms, pairing merchant recruitment in Java’s seller-dense urban areas with buyer campaigns aimed at populations such as Bekasi’s can develop both sides of a marketplace across several established centers.
Kalimantan and Sulawesi illustrate regional expansion organized around service nodes that handle several parts of an online transaction. SPX Express opened more than 300 service points nationally in April 2025, including locations in these regions. Kalimantan additions included Teluk Bayur Hub in Berau and Bunut Hulu Hub in Kapuas Hulu, while Sulawesi additions included Mapanget Hub in Manado. The service network combined official outlets and individual agents, with functions including parcel drop-off, self-collection, and returns. For merchants, such nodes make regional reach relevant to both outbound orders and reverse handling, allowing the service offer to encompass more than delivery to the customer’s address.
Papua and Maluku show marketplace parcel volumes rising at a postal operator that delivers for several marketplaces. PT Pos Indonesia reported that its marketplace shipments in Papua-Maluku grew 178% in the first half of 2026 compared with the first half of 2025. In August 2026, the company said it worked with Shopee and Tokopedia to deliver marketplace customer orders in the region. That arrangement connects more than one marketplace’s customers to a delivery provider, giving the operator a route to serve demand aggregated by separate retail platforms.
Regulatory Framework and Outlook
This comparison examines selected jurisdictions from the perspective of domestic micro and small sellers entering online sales channels. National requirements govern platform participation, while Jakarta’s column focuses on the provincial e-Order public-procurement channel. Ministry of Trade Regulation 19/2026 (Permendag 19/2026) took effect on June 8, 2026, requiring business permits at least in the form of a business identification number, or NIB. Existing platform sellers have 18 months to adapt and new sellers 6 months, while platforms must reject registrations lacking the required permits.
Regulatory Table
| Decision factor | Indonesia | Jakarta |
|---|---|---|
| Primary authority | Ministry of Trade and Directorate General of Taxes | Jakarta provincial government as public buyer |
| Key instruments or direction | Permendag 19/2026 seller licensing and PMK 37/2025 marketplace tax collection | Governor Instruction 1/2023 on micro and small business e-purchasing through e-Order |
| Commercial effect | Permit screening and collection of eligible domestic sellers’ income tax through appointed marketplaces | Access to provincial public procurement through an online channel |
| Current policy attractiveness | Medium | High |
| Future direction of policy attractiveness | Hardening | No change |
| Source: Mordor Intelligence | ||
Indonesia’s Medium rating reflects the administrative work of seller licensing and marketplace tax collection, whose implementation through 4 appointed platforms began on October 1, 2026. Hardening follows the scheduled completion of the 6-month and 18-month licensing transitions measured from June 8, 2026, which makes permit readiness increasingly important for platform access. Jakarta’s High rating reflects the provincial government’s use of e-Order to support local micro and small business access to public procurement. No change reflects the continuing commercial role of that established channel under Governor Instruction 1/2023, which remains in force and supports the province’s established procurement-access policy.
Value Chain Stages
This comparison follows online transactions from marketplace operation through payment integration, fulfillment, and parcel delivery. Each stage captures value from a different service, making the charging point as important as the breadth of the provider’s offering. Shopee’s Indonesia terms introduced an order-processing fee from July 20, 2025, unless otherwise agreed, with specified exemptions for qualifying sellers. Merchants consequently face a combined service-cost decision, because placing an order is only the first point at which the transaction creates work.
Value Chain Analysis Table
| Primary activity | Key participants | Value capture | Bottleneck | Resilience response |
|---|---|---|---|---|
| Marketplace order processing | Marketplace operators such as PT Shopee International Indonesia and Tokopedia | Shopee seller order-processing fees, subject to agreement and qualifying exemptions | Serving orders whose value leaves little room for processing charges | Match service scope to completed-order economics |
| Online payment integration | Payment-integration providers such as Xendit | Payment-integration service income | Connecting the merchant storefront to payment processing | Use supported WooCommerce or Shopify plugins |
| Warehousing and order fulfillment | Managed-fulfillment providers such as Dikelola Shopee and third-party logistics providers such as JNE Logistics | Packaging and storage charges at Dikelola Shopee | Shopee storage becomes chargeable after the initial 60 days under its March 2026 schedule | Align stock replenishment with expected warehouse dwell time |
| Parcel delivery | Express delivery operators such as SPX Express and J&T Express | Delivery service revenue | Coordinating warehouse release with final delivery | Allocate shipments among operators providing the required delivery service |
| Source: Mordor Intelligence | ||||
Fulfillment adds a time-dependent earning opportunity alongside marketplace charges for completed orders. Dikelola Shopee’s March 2026 schedule provided free storage for the first 60 days, alongside packaging rates differentiated by package size and monthly SKU sales, plus a reduced schedule for qualifying domestic sellers. That structure makes warehouse dwell time commercially consequential even before a merchant compares delivery services. For stock held beyond 60 days, storage adds to any applicable processing and packaging charges, so a lower delivery price alone cannot remove the cost of slow inventory turnover.
Competitive Landscape
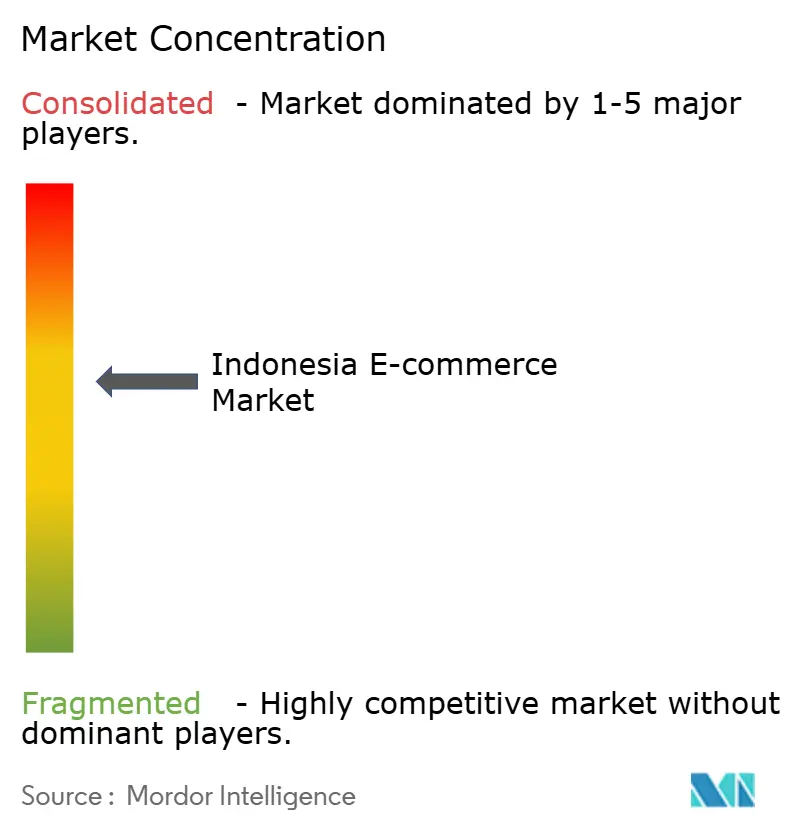
Competition is moderately concentrated around platform ecosystems, with digital products, first-party retail, and service relationships creating distinct routes to commerce revenue. At year-end 2025, PT Bukalapak.com Tbk was phasing out physical goods for virtual products, digital services, and Itemku gaming, while Blibli (PT Global Digital Niaga Tbk) operates first-party B2C online retail. On January 31, 2024, PT GoTo Gojek Tokopedia Tbk and TikTok combined Tokopedia and TikTok Shop Indonesia under jointly owned PT Tokopedia, with TikTok holding a controlling stake. GoTo received IDR 820 billion (USD 50.02 million) in 2025 e-commerce service fees from PT Tokopedia. GoTo’s fee income therefore comes from a marketplace in which TikTok holds the controlling stake, while Bukalapak and Blibli earn from platforms they run themselves.
Sea Ltd (PT Shopee International Indonesia) reported that sales of local products on its Pilih Lokal channel grew 55% in 2025. Lazada (Alibaba Group Holding Limited) joined Meta’s Facebook Affiliate Partnerships program in July 2026, enabling creators in Indonesia and 5 other Southeast Asian markets to tag products and earn commissions on completed purchases. These approaches give sellers distinct routes to discovery, connecting local-product positioning with an established marketplace channel or linking creator distribution to completed purchases. Sellers weighing these platforms therefore face different commercial tests, with local origin defining the Pilih Lokal offer and completed creator-driven purchases determining whether Lazada’s affiliate route generates commission.
Regulatory conditions also shape how closely integrated platforms can bundle the path from product discovery to payment and delivery. On June 17, 2025, the Indonesia Competition Commission (KPPU) conditionally approved TikTok Nusantara’s acquisition of PT Tokopedia, barring predatory pricing, self-preferencing, and specified restrictions on seller access. The conditions also required payment and logistics choices to remain available without tying or bundling them to promotions or discounts. KPPU said supervision would run through June 17, 2027, placing the combination under a defined conduct framework. For independent payment and delivery providers, the conditions preserve a route to serve Tokopedia and TikTok Shop merchants because marketplace promotions cannot be tied to particular payment or logistics choices.
Indonesia E-commerce Industry Leaders
-
PT Bukalapak.com Tbk
-
Blibli (PT Global Digital Niaga Tbk)
-
PT GoTo Gojek Tokopedia Tbk
-
Sea Ltd (PT Shopee International Indonesia)
-
Lazada (Alibaba Group Holding Limited)
- *Disclaimer: Major Players sorted in no particular order
Key Opportunities for Market Participants
This comparison examines opportunities to help Indonesian local-product sellers turn marketplace visibility into executable sales activity. Ministry of Trade initiatives launched in August and September 2026 combined seller-support services with dedicated storefronts for selected Pilihan Busan products. Interviews with 10 sellers on one major Indonesian marketplace, including current users, former users, and nonusers of advertising features, identified concerns about performance, cost justification, and advanced knowledge as adoption constraints. These findings favor targeted assistance with a defined commercial task over a broad promise of increased exposure.
Market Opportunities Table
| Opportunity | Why now | Buyer / lead segment | Recommended play | Main barrier | Likely beneficiaries |
|---|---|---|---|---|---|
| Curated local-product discovery | Dedicated Pilihan Busan storefronts and promotional support for selected products launched in September 2026 | Sellers of eligible curated local products | Prepare a coherent product offer and distinguish exposure from completed orders | Making the cost of promotion commercially justifiable | Eligible UMKM sellers, Tokopedia, and TikTok Shop |
| Assisted marketplace advertising | August 2026 local-product program offers digital-skills training and promotion support | Local-product sellers considering marketplace advertising | Combine advanced campaign instruction with measurable spending trials | Advanced knowledge and performance concerns among interviewed sellers | Local-product sellers and Shopee Indonesia |
| Promotion connected to managed fulfillment | The local-product program includes operational support through Dikelola Shopee | Local-product sellers preparing promoted order flows | Connect promotion planning with defined order-handling services | Coordinating order execution with the demand a promotion seeks to generate | Eligible local-product sellers and Shopee Indonesia |
| Source: Mordor Intelligence | |||||
Curated placement and managed support address different points in a sale, making their commercial roles complementary. The interviewed sellers’ concerns about cost justification strengthen the case for explaining advertising performance and service scope clearly. The central opening is assistance that connects product discovery with accountable order execution, allowing sellers to assess the operational value accompanying marketplace exposure.
Recent Industry Developments
- Oct 2026: Article 22 income-tax collection on eligible domestic sellers’ marketplace earnings began on October 1 through PT Shopee International Indonesia, PT Global Digital Niaga Tbk, PT Tokopedia, and PT Ecart Webportal Indonesia.
- Sep 2026: Indonesia’s value-added tax (VAT) framework for certain digital goods and services supplied by foreign providers took effect September 25. Designated banks or nonbank payment facilitators collect VAT. Transactions already charged VAT under the existing electronic-trading (PMSE) system are not charged again.
- Jul 2026: Lazada joined Meta’s Facebook Affiliate Partnerships program, enabling creators in Indonesia and 5 other Southeast Asian markets to tag Lazada products and earn commissions on completed purchases.
Research Methodology Framework and Report Scope
Market Definition and Coverage
The Indonesia e-commerce market measures the annual gross value of goods and services ordered online between businesses and consumers or between businesses. It covers transactions purchased in Indonesia, with value classified by business model, device used, payment method, and B2C product category.
Scope exclusions: Offline retail and wholesale sales, marketplace commissions and payment-processing fees, sales of devices and payment products, and e-commerce purchases made outside Indonesia are excluded.
Segmentation Overview
- By Business Model
- B2C
- B2B
- By Device Type
- Smartphone / Mobile
- Desktop and Laptop
- Other Device Types
- By Payment Method
- Credit / Debit Cards
- Digital Wallets
- BNPL
- Other Payment Method
- By B2C Product Category
- Beauty and Personal Care
- Consumer Electronics
- Fashion and Apparel
- Food and Beverages
- Furniture and Home
- Toys, DIY and Media
- Other Product Categories
Data Sources, Market Sizing, and Validation
Desk Research
Secondary research draws on sources such as Statistics Indonesia's e-commerce survey metadata for the definition and estimation of online transaction revenue, Bank Indonesia's Economic Report for payment and digital commerce indicators, and the Ministry of Communication and Digital Affairs' Harbolnas release for campaign activity and transaction targets. The U.S. International Trade Administration's Indonesia guide helps frame the business landscape and structural constraints.
Company filings and investor materials can add reported marketplace activity, order growth, transaction measures, and service changes, while reputable Indonesian business press can cross-check dated developments and market signals. Analysts compare each source's measure, period, and coverage with the defined Indonesia order-value pool. The named sources are not exhaustive, and further sources inform collection, validation, and clarification.
Primary Interviews and Surveys
Structured interviews and targeted surveys can involve Indonesian marketplace operators, online retailers and wholesalers, payment providers, fulfillment specialists, and analysts responsible for digital commerce or category planning. Respondents can check the interpretation of secondary indicators, explain changes in order activity and category mix, and identify gaps where published series use different definitions. Analysts triangulate those explanations with public data and company disclosures, documenting unresolved gaps and applying stated assumptions only where an indicator cannot be reconciled.
Distribution of primary research fieldwork respondents
| Company type | Respondent position | Region |
|---|---|---|
| Top tier: 35% | CXOs: 20% | |
| Mid tier: 45% | Functional/Unit leaders: 35% | |
| Smaller Players: 20% | Managers: 45% |
Market-Sizing & Forecasting
The model starts with a top-down estimate of annual online order value purchased in Indonesia, separating B2C and B2B before checking the resulting total against public business and transaction indicators. Population and internet adoption indicate the potential buyer base, household consumption and category spending help describe demand, online seller activity indicates supply participation, and digital payment and banking indicators help track the movement of purchases into online channels. A multivariate regression can relate these drivers to historical market value where comparable observations exist, with scenario analysis used where structural changes or gaps make a single historical relationship less informative.
Segment shares are built from available transaction, survey, company, and trade evidence for business models, devices, payment methods, and B2C product categories, then applied to the market value for each year. Selective bottom-up checks can compare sampled average order values with order activity or roll up publicly reported channel measures, while interviews test whether the variables and forecast paths reflect Indonesian operating conditions. If a source omits a segment or reports business revenue instead of gross order value, analysts retain it as an indicator, bridge only supportable differences, and record assumptions rather than treating the figure as a directly additive market total.
Data Validation & Update Cycle
Analysts triangulate the market model against independent official indicators, company disclosures, payment activity, and channel evidence, checking that periods, currencies, and transaction definitions align. They investigate outliers and forecast variances, trace them to source revisions, coverage changes, or model inputs, and complete successive analyst reviews before sign-off. A material discrepancy triggers targeted re-contact with relevant Indonesian respondents when available evidence can be clarified, while annual refreshes, interim updates after material events, and a fresh pre-delivery review keep the estimate current.
Mordor Intelligence's Indonesia Ecommerce Market Size Measured Against Other Published Estimates
Published estimates can differ in the transactions and products they count and the inputs used to model demand. The Indonesia e-commerce market measures the annual gross value of goods and services ordered online between businesses and consumers or between businesses.
Key Gap Drivers include the study's defined coverage and market-specific modeling choices. Population and internet adoption indicate the potential buyer base, household consumption and category spending help describe demand, online seller activity indicates supply participation, and digital payment and banking indicators help track the movement of purchases into online channels.
Benchmark comparison
| Source | Market Size | Gaps in Research Methodology |
|---|---|---|
| Mordor Intelligence | USD 120.2 B (2027) | |
| Global Consultancy A | USD 71 B (2025) | At its 2025 base, this estimate is 40.9% below this report's 2027 value of USD 120.2 B, 2 years later. The source reports a 2025 GMV estimate and describes continued market growth through its forecast horizon, so its earlier measurement year contributes to the lower comparison. |
| Technology Research Firm B | USD 46.6 B (2025) | At its 2025 base, this estimate is 61.2% below this report's 2027 value of USD 120.2 B, 2 years later. The source reports a 2025 transaction-value estimate and projects further growth through 2029, so its earlier measurement year contributes to the lower comparison. |
Mordor Intelligence's analysts triangulate the market model against independent official indicators, company disclosures, payment activity, and channel evidence, checking that periods, currencies, and transaction definitions align.
Key Questions Answered in the Report
What is the Indonesia e-commerce market size and growth outlook?
The size is expected to reach USD 120.2 billion in 2027 and USD 239.4 billion by 2032. The forecast CAGR is 14.78% over 2027-2032.
What is driving online retail demand in Indonesia?
Live shopping, PayLater checkout, and regional fulfillment support demand. Bank BNPL accounts reached 34 million in August 2026.
Which business model leads Indonesian e-commerce?
B2C held 86.51% of total e-commerce value in 2026. B2B is forecast to grow fastest at a CAGR of 18.2% over 2027-2032.
Which companies participate in Indonesian online commerce?
PT Bukalapak.com Tbk, Blibli, PT GoTo Gojek Tokopedia Tbk, Sea Ltd’s Shopee, and Lazada participate through retail or service models.
What operating challenge affects online-retail couriers?
A 2025 study of one East Bandung courier branch identified cash-on-delivery (COD) return-related operating-cost pressure, including transit storage and return trips.
Which region leads online commerce in Indonesia?
Java accounts for the majority of orders. In 2025, all 10 areas with the highest online-seller rates and 9 of the 10 with the highest online-buyer rates were in Java.