Market Overview
| Study Period | 2018 - 2031 |
|---|---|
| Forecast Data Period | 2026 - 2031 |
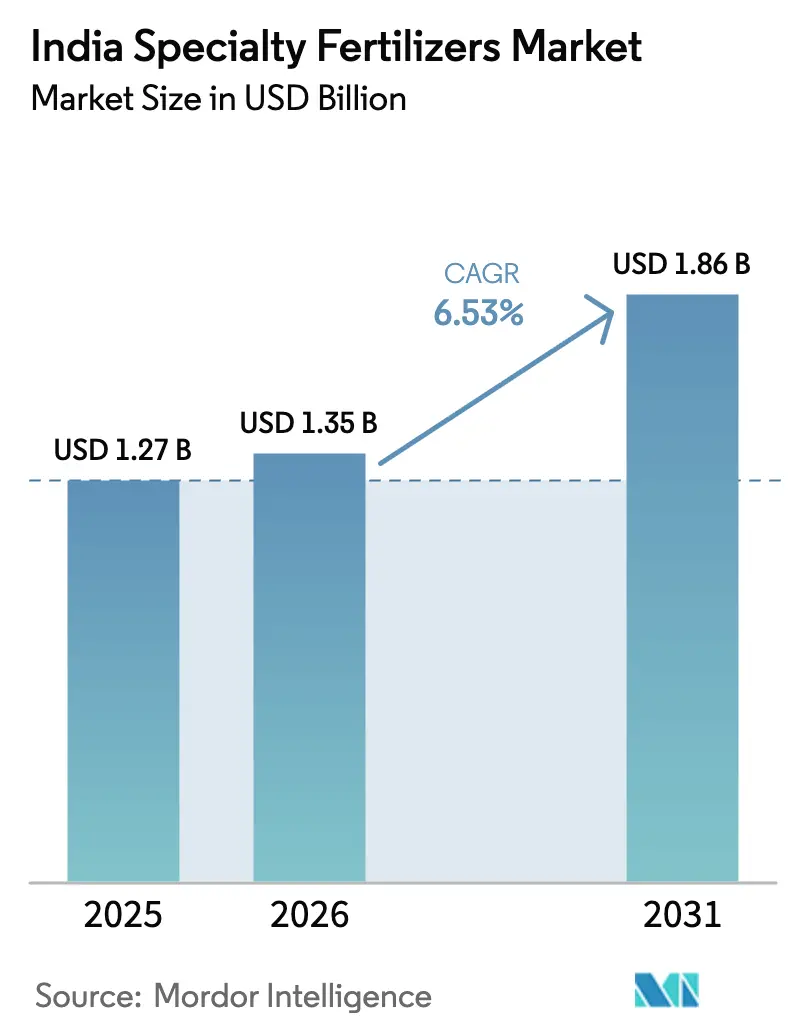
| Base Year Market Size (2025) | USD 1.27 Billion |
| Market Size (2026) | USD 1.35 Billion |
| Market Size (2031) | USD 1.86 Billion |
| Growth Rate (2026 - 2031) | 6.53% CAGR |
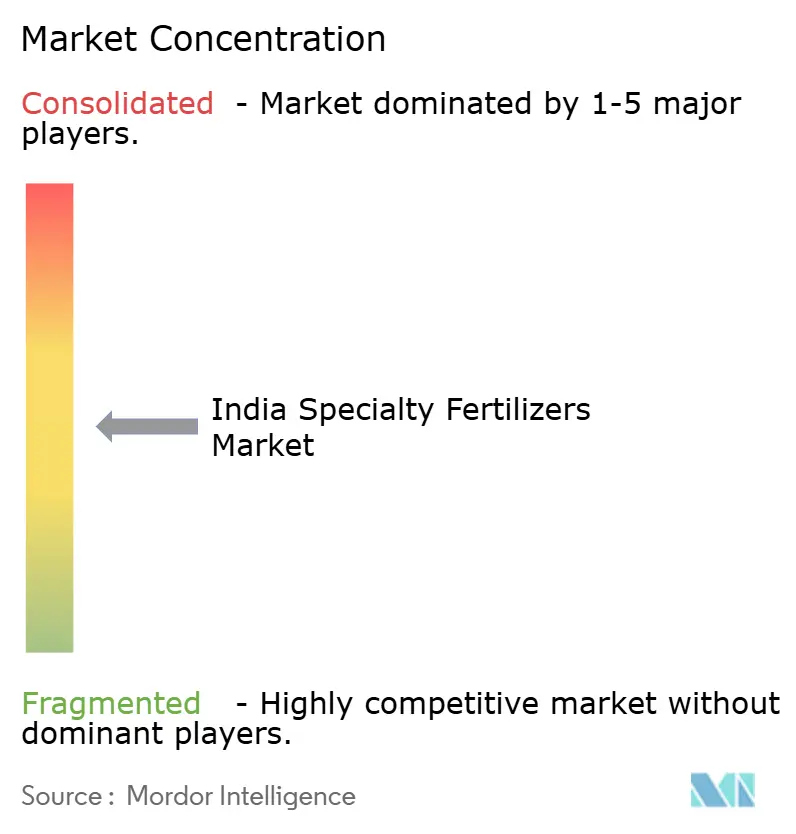
| Market Concentration | Medium |
Major Players*Disclaimer: Major Players sorted in no particular order Image © Mordor Intelligence. Reuse requires attribution under CC BY 4.0. | |
India Specialty Fertilizers Market Analysis by Mordor Intelligence
India specialty fertilizers market size in 2026 is estimated at USD 1.35 billion, growing from 2025 value of USD 1.27 billion with 2031 projections showing USD 1.86 billion, growing at 6.53% CAGR over 2026-2031. Adoption accelerates as subsidy disbursements shift from blanket tonnage to nutrient-use-efficiency metrics, and as growers link crop nutrition to carbon credit income. Micro-irrigation expansion, indigenous bio-polymer coatings, and sensor-driven variable-rate dosing are reinforcing a structural shift away from commodity blends. At the same time, volatile potash and phosphate import prices, lengthy Fertilizer Control Order approvals, and risk aversion among smallholders temper the overall growth curve. Competitive intensity remains moderate, as regional cooperatives possess extensive distribution networks, but multinationals retain differentiated chemistries. These crosscurrents frame the next decade as a transition period for the India specialty fertilizer market, characterized by precision nutrition.
Key Report Takeaways
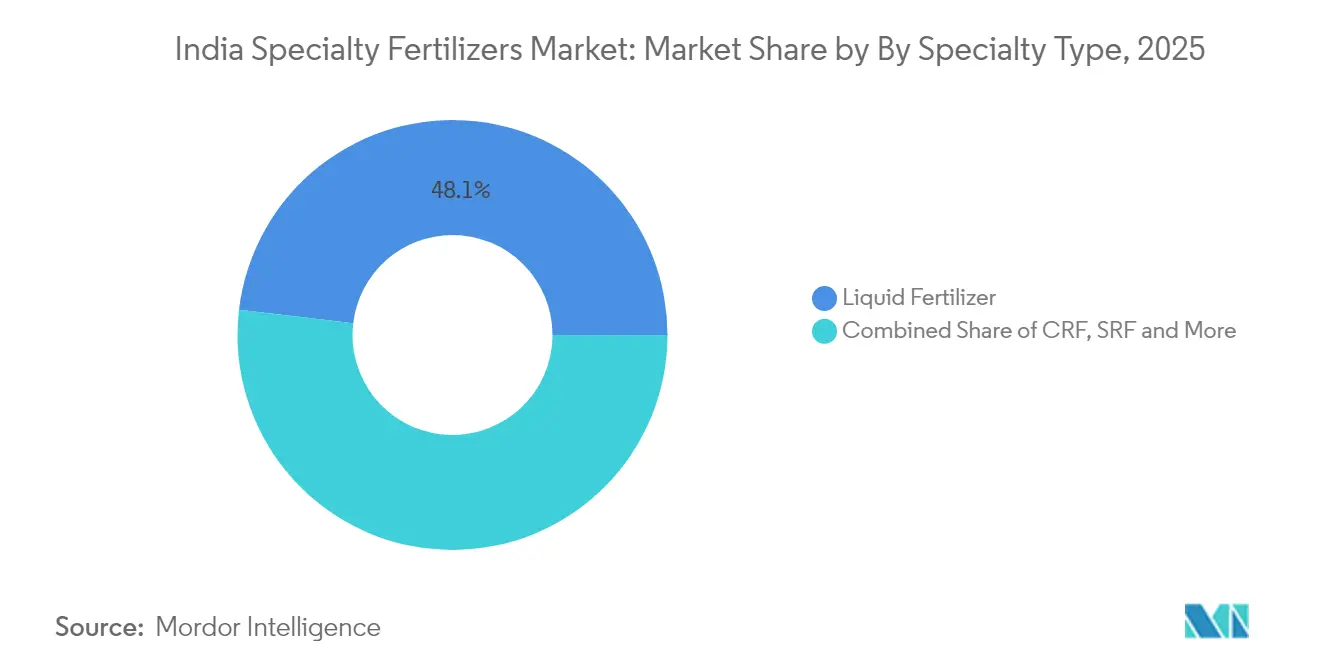
- By specialty type, liquid fertilizers led with a 48.12% share of the Indian specialty fertilizers market in 2025, and controlled-release fertilizers are projected to expand at a 6.93% CAGR through 2031.
- By application mode, fertigation accounted for a 48.35% share of the India specialty fertilizers market size in 2025, while soil application is set to grow at a 6.74% CAGR up to 2031.
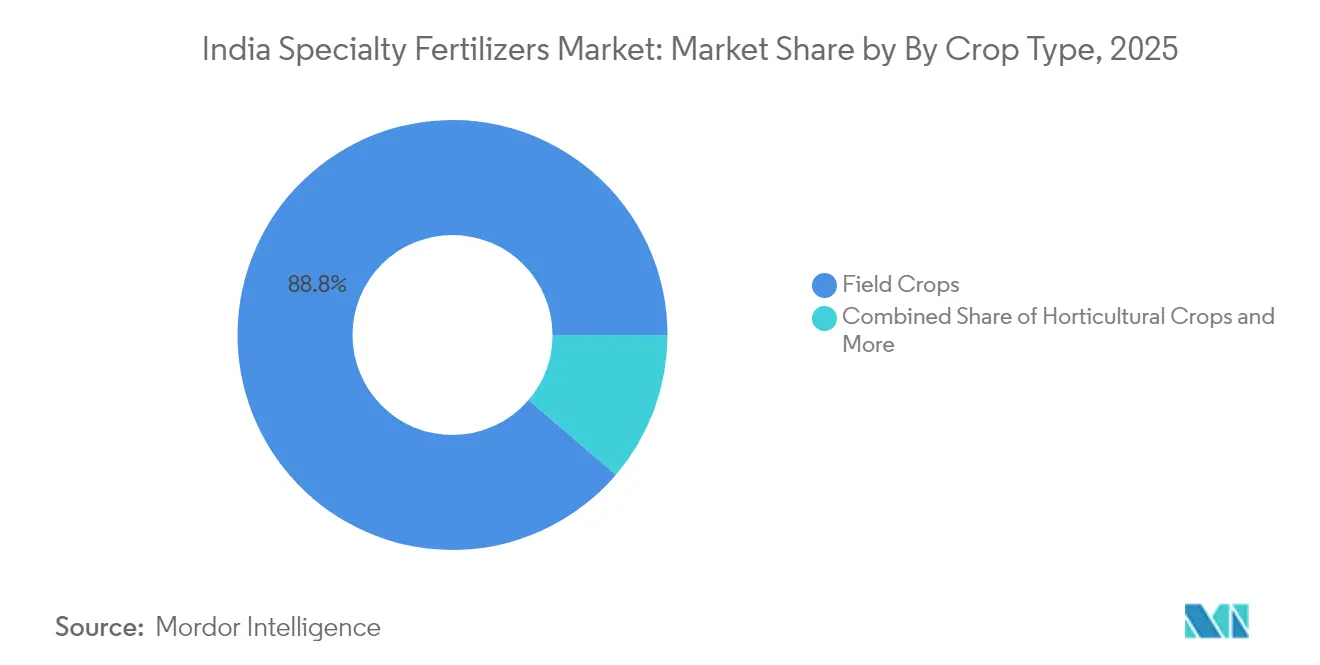
- By crop type, field crops commanded 88.75% of demand in 2025, and horticultural crops are forecast to record a 6.58% CAGR through 2031.
Note: Market size and forecast figures in this report are generated using Mordor Intelligence’s proprietary estimation framework, updated with the latest available data and insights as of 2026.
India Specialty Fertilizers Market Trends and Insights
Drivers Impact Analysis*
| Driver | ( ~) % Impact on CAGR Forecast | Geographic Relevance | Impact Timeline |
|---|---|---|---|
| Subsidy Realignment Toward Nutrient Use Efficiency Products | +1.2% | Punjab, Haryana, Andhra Pradesh | Medium term (2-4 years) |
| Surge in Micro-Irrigation Acreage and Fertigation Retrofits | +1.0% | Maharashtra, Gujarat, Karnataka, Rajasthan | Short term (≤ 2 years) |
| Crop Diversification Programs in Eastern States | +0.8% | Bihar, West Bengal, Odisha, Jharkhand | Long term (≥ 4 years) |
| Industry Partnerships with Ag-Tech Soil Sensors | +0.6% | Punjab, Haryana, western Uttar Pradesh | Medium term (2-4 years) |
| Carbon-credit premiums for enhanced-efficiency fertilizers | +0.5% | Maharashtra, Karnataka, Tamil Nadu | Long term (≥ 4 years) |
| Indigenous bio-polymer coating technology lowering cost | +0.7% | Gujarat, Maharashtra, Andhra Pradesh | Medium term (2-4 years) |
| Source: Mordor Intelligence | |||


Subsidy Realignment Toward Nutrient Use Efficiency Products
The PM-PRANAM scheme enables states to retain 50% of the subsidy savings for nutrient-efficient infrastructure, resulting in a 15.14 lakh metric ton reduction in conventional fertilizer use during 2023–24 [1]Source: Press Information Bureau, “PM-PRANAM Scheme and Fertilizer Subsidy Allocations,” pib.gov.in. Funds are now shifting toward nano-urea, water-soluble, and controlled-release grades that enhance nutrient recovery in wheat and rice belts, where over-application once exceeded agronomic norms by up to 30%. Cooperative majors bundle nano-urea with traditional blends, ensuring farmer familiarity while accessing performance-linked incentives. The National Mission on Natural Farming, backed by INR 2,481 crore (approximately USD 299 million), increases demand for organic-mineral hybrids that qualify for additional state credits. Early adopters in Punjab and Haryana report per-hectare cost savings of 10–15%, validating the policy’s premise. The new subsidy logic rewards efficacy rather than volume and widens premium pricing corridors for the India specialty fertilizer market.
Surge in Micro-Irrigation Acreage and Fertigation Retrofits
Government outlays of INR 21,968.75 crore (approximately USD 2.65 billion) under the Pradhan Mantri Krishi Sinchayee Yojana expanded micro-irrigation to 95.58 lakh hectares by March 2024 [2]Source: Ministry of Jal Shakti, “Pradhan Mantri Krishi Sinchayee Yojana – Micro Irrigation Coverage,” jalshakti-dowr.gov.in. Liquid and fully soluble NPK blends integrate seamlessly with drip and sprinkler systems, enabling split dosing that aligns with crop phenology. Maharashtra and Gujarat cover up to 75% of irrigation capital costs for smallholders, accelerating liquid demand. Coromandel International expanded water-soluble capacity by 30% at Kakinada to service this captive base. Retrofitting flood fields with fertigation modules in Rajasthan and Karnataka addresses groundwater stress and prolongs equipment life to 15–20 years, effectively locking in specialty fertilizer consumption over the asset cycle.
Crop Diversification Programs in Eastern States
Under National Food Security Mission incentives, West Bengal, Bihar, and Odisha added 1.2 million hectares of pulses between 2022 and 2024. These legumes respond poorly to blanket urea yet achieve yield increases of 15–20% with slow-release phosphatic and sulfur formulations. State universities validate polymer-coated DAP through on-farm trials, demonstrating 8–12% cost savings compared to split applications. Fragmented holdings averaging 0.8 hectares prompt growers to opt for liquids that suit knapsack sprayers. Deepak Fertilizers introduced a soluble NPK grade for pulse growers, accompanied by SMS agronomy alerts, in 2024. As diversification spreads, specialty penetration in the India specialty fertilizer market expands beyond the traditional wheat-rice corridor.
Industry Partnerships with Ag-Tech Soil Sensors
Variable-rate dosing trials on 50,000 hectares of Haryana wheat reduced nitrogen application by 18% while stabilizing yields [3]Source: CropIn Technology Solutions, “Precision Agriculture and Soil Sensor Partnerships,” cropin.com. IoT sensors identify micronutrient gaps overlooked by standard laboratory tests, driving demand for chelated zinc and boron blends. Tata Chemicals integrated sensor data into its retail app, delivering prescriptions that account for rainfall deviation and organic matter. Early adopters in Tamil Nadu achieved input cost cuts of 12–15%. As sensor prices fall below INR 5,000 (approximately USD 60) and broadband reaches rural blocks, data-driven procurement models are gaining relevance for the Indian specialty fertilizer market.
Restraints Impact Analysis*
| Restraint | (~) % Impact on CAGR Forecast | Geographic Relevance | Impact Timeline |
|---|---|---|---|
| Volatility in Imported MOP and MAP Prices | −0.9% | Coastal states reliant on seaborne raw materials | Short term (≤ 2 years) |
| Slow Registration of Novel Additives by FCO | −0.7% | Nationwide | Medium term (2-4 years) |
| Smallholder reluctance without proven yield data | −0.5% | Eastern and central rain-fed zones | Medium term (2-4 years) |
| Liquid bulk logistics gaps at inland depots | −0.4% | Eastern and northeastern interior districts | Short term (≤ 2 years) |
| Source: Mordor Intelligence | |||
Volatility in Imported MOP and MAP Prices
India imported 4.4 million metric tons of muriate of potash in 2024, at values ranging from USD 350 to USD 480 per metric ton, as the supply from Belarus and Russia tightened [4]Source: Ministry of Commerce and Industry, “Fertilizer Import Statistics FY 2024,” commerce.gov.in. Mono-ammonium phosphate averaged USD 520–680, eroding distributor margins because Nutrient-Based Subsidy reimbursements adjust quarterly. Coastal markets tend to experience sharper shocks than inland urea hubs. A lack of a potash reserve amplifies exposure, while diversification toward Canada and Israel incurs freight premiums of USD 30–50 per metric ton.
Slow Registration of Novel Additives by FCO
Approval cycles of 18–24 months deter rapid commercial roll-out of nitrification inhibitors, urease inhibitors, and biodegradable coatings [5]Source: Fertilizer Control Order, “FCO Amendments and Provisional Registration,” fert.nic.in. Although the provisional nano-urea and bio-stimulant status lasts until June 2025, the final certification pathways remain opaque. Yara International waited until mid-2024 for clearance on a blend introduced in Europe in 2022, yielding a first-mover edge to domestic competitors. The bottleneck delays innovation adoption across the India specialty fertilizer market by two to three years.
*Our forecasts treat driver/restraint impacts as directional, not additive. The impact forecasts reflect baseline growth, mix effects, and variable interactions.
Segment Analysis
By Specialty Type: Liquid Dominance Meets Polymer Innovation
Liquid fertilizers accounted for 48.12% of the India specialty fertilizers market size in 2025, driven by the rapid expansion of drip and sprinkler acreage under national irrigation programs. Controlled-release grades are forecast to grow at a 6.93% CAGR through 2031 as domestic bio-polymers lower costs and carbon-credit markets reward longer nutrient availability. Slow-release products that rely on urea-formaldehyde chemistries face regulatory scrutiny due to formaldehyde leaching, prompting a shift toward methylene urea formulations. Water-soluble grades thrive in greenhouse belts for grapes and cut flowers.Polymer-coated urea has received provisional clearance under the Fertilizer Control Order until June 2025, allowing for scale-up while permanent testing protocols are being developed. Sulfur-polymer shells meet dual nutrient needs in oilseed heartlands of Madhya Pradesh. Indigenous starch-lignin coatings pilot in tea and coffee estates, addressing microplastic concerns and aligning with national efforts to curb single-use plastics. Cooperative plants running captive liquid lines near urea units lock in conversion margins, reinforcing a two-track specialty landscape.


By Application Mode: Fertigation Anchors and Soil Application Awakens
Fertigation captured 48.35% of the India specialty fertilizers market size in 2025, facilitated by subsidies that cover up to 75% of drip capital outlay, as well as field evidence of 30–50% water savings. Soil application is expected to clock a 6.74% CAGR as polymer-coated granules prove effective in broadcast and band placement across eastern diversification belts where drip remains scarce. Foliar sprays, though only a tenth of volumes, are vital for rapid micronutrient correction in export-oriented vineyards and orchards.
Indian Council of Agricultural Research trials have shown that coated urea cuts ammonia loss by nearly half in flooded paddy fields . Fertigation infrastructure carries a 15-to-20-year lifespan that guarantees steady pull for liquids and solubles, driving capacity additions by Coromandel and Deepak Fertilizers. Foliar uptake gains momentum through drone services that slash labor by 60%. Format choice, therefore, hinges more on infrastructure than on agronomic superiority.
By Crop Type: Field Crops Anchor and Horticulture Accelerates
Field crops represented 88.75% of the India specialty fertilizers market in 2025, with rice, wheat, and sugarcane being the primary crops cultivated across 120 million hectares. Horticultural crops, however, are projected to grow at a 6.58% CAGR to 2031 as certification-driven growers in Maharashtra, Karnataka, and Tamil Nadu shift to water-soluble and controlled-release inputs. Turf and ornamentals, which account for only 2–3%, have posted double-digit growth as municipal greening specifications mandate the use of slow-release nitrogen.
Certification protocols, such as GlobalGAP, stipulate efficient formulations that reduce nitrate leaching, enabling fruit growers to earn price premiums of 15–20%. Tata Chemicals’ micronutrient chelate line targets 8 million hectares of mango and citrus orchards. Meanwhile, subsidy structures that reimburse nutrient tonnage, not efficacy, still favor conventional blends in staple cereals. Yet the PM-PRANAM realignment is beginning to tilt field-crop economics toward specialty adoption, signaling a two-speed evolution within the India specialty fertilizer market.
Geography Analysis
Maharashtra, Gujarat, Karnataka, and Punjab together comprised nearly two-thirds of 2025 consumption, underpinned by strong irrigation networks and proximity to ports and manufacturing hubs. Maharashtra alone runs 1.8 million hectares of drip, sustaining high liquid uptake in grapes, pomegranates, and sugarcane. Gujarat benefits from cotton and groundnut rotations, as well as port availability for low-cost potash imports. Punjab and Haryana, formerly reliant on cheap urea, are now piloting nano-urea under the PM-PRANAM benefits.
Eastern states contribute close to one-fifth of the volumes and are set to grow above the national rate as rice-fallow land shifts toward pulses and oilseeds, which demand phosphorus-rich, slow-release grades. Fragmented holdings push preference for portable liquids. Bulk-liquid freight limits penetration to beyond 200 kilometers of Kolkata and Bhubaneswar ports. Southern states account for a quarter of demand, driven by export-focused horticulture in the Nilgiris, Chikmagalur, and Anantapur regions. Digital Agriculture Mission pilots soil-sensor grids there that refine variable-rate prescriptions.
The northeast remains a 3–4% slice, dominated by tea estates adopting controlled-release nitrogen for labor savings and certification compliance. Urban turf and ornamental clusters around Bengaluru, Pune, and Hyderabad specify slow-release inputs in city greening tenders. Overall, adoption patterns closely follow irrigation development and export-market linkage, reinforcing regional asymmetry in the India specialty fertilizer market.
Competitive Landscape
India specialty fertilizers market exhibits moderate concentration, with the top five players including ICL Group Ltd., Yara International ASA, Deepak Fertilizers & Petrochemicals Corporation Ltd., Indian Farmers Fertiliser Cooperative Limited, and Coromandel International Ltd. Indian Farmers Fertiliser Cooperative Limited operates five nano-urea lines, the newest of which is located in Kalol, producing 18 million bottles annually and reducing the per-hectare nitrogen cost by up to 15%. Coromandel International and Deepak Fertilizers are expanding their capacities for water-soluble and polymer-coated products to serve the western and southern horticulture belts. Yara, ICL, and Nutrien position premium nitrification inhibitors and chelates toward certification-oriented orchards but face price pressure from indigenous coatings.
White-space prospects emerge in eastern India for pulse-specific phosphates and in urban landscaping, where slow-release nitrogen reduces maintenance. The technological strategies of market players are diverging, with cooperatives integrating crop-sensor data into advisory applications, while smaller firms continue to rely on calendar-based recommendations, which can lead to over-application by up to 25%. Strategic investments tilt both backward into coating materials and forward into digital retail platforms, locking growers into differentiated service ecosystems. Provisional FCO registration, valid until June 2025, temporarily shields incumbents who secured early clearances, postponing new rivalry.
India Specialty Fertilizers Industry Leaders
Coromandel International Ltd.
Deepak fertilizers & Petrochemicals Corporation Ltd
ICL Group Ltd
Indian Farmers Fertiliser Cooperative Limited
Yara International ASA
- *Disclaimer: Major Players sorted in no particular order

Recent Industry Developments
- September 2024: The Union Cabinet approved the Digital Agriculture Mission with INR 2,817 crore (USD 339 million) to install soil-sensor networks across 10 million hectares.
- June 2024: Coromandel International inaugurated an advanced nano fertilizer plant in Kakinada, Andhra Pradesh, and launched 'Paramfos Plus', a magnesium-fortified fertilizer designed to improve crop yields.
- April 2024: The Indian government notified new standards under the Fertilizer Control Order for “Nano Urea Plus”, the enhanced liquid-nano fertilizer produced by IFFCO. The standards, effective from 15 April 2024 for three years, formally regulate its composition and quality parameters, supporting wider adoption of nano-based specialty fertilizers.


India Specialty Fertilizers Market Report Scope
CRF, Liquid Fertilizer, SRF, Water Soluble are covered as segments by Speciality Type. Fertigation, Foliar, Soil are covered as segments by Application Mode. Field Crops, Horticultural Crops, Turf & Ornamental are covered as segments by Crop Type.Speciality Type
| CRF | Polymer Coated |
| Polymer-Sulfur Coated | |
| Others | |
| Liquid Fertilizer | |
| SRF | |
| Water Soluble |
Application Mode
| Fertigation |
| Foliar |
| Soil |
Crop Type
| Field Crops |
| Horticultural Crops |
| Turf and Ornamental |
| Speciality Type | CRF | Polymer Coated |
| Polymer-Sulfur Coated | ||
| Others | ||
| Liquid Fertilizer | ||
| SRF | ||
| Water Soluble | ||
| Application Mode | Fertigation | |
| Foliar | ||
| Soil | ||
| Crop Type | Field Crops | |
| Horticultural Crops | ||
| Turf and Ornamental |


Market Definition
- MARKET ESTIMATION LEVEL - Market Estimations for various types of fertilizers has been done at the product-level and not at the nutrient-level.
- NUTRIENT TYPES COVERED - Primary Nutrients: N, P and K, Secondary Macronutrients: Ca, Mg and S, Micronutients: Zn, Mn, Cu, Fe, Mo, B, and Others
- AVERAGE NUTRIENT APPLICATION RATE - This refers to the average volume of nutrient consumed per hectare of farmland in each country.
- CROP TYPES COVERED - Field Crops: Cereals, Pulses, Oilseeds, and Fiber Crops Horticulture: Fruits, Vegetables, Plantation Crops and Spices, Turf Grass and Ornamentals
| Keyword | Definition |
|---|---|
| Fertilizer | Chemical substance applied to crops to ensure nutritional requirements, available in various forms such as granules, powders, liquid, water soluble, etc. |
| Specialty Fertilizer | Used for enhanced efficiency and nutrient availability applied through soil, foliar, and fertigation. Includes CRF, SRF, liquid fertilizer, and water soluble fertilizers. |
| Controlled-Release Fertilizers (CRF) | Coated with materials such as polymer, polymer-sulfur, and other materials such as resins to ensure nutrient availability to the crop for its entire life cycle. |
| Slow-Release Fertilizers (SRF) | Coated with materials such as sulfur, neem, etc., to ensure nutrient availability to the crop for a longer period. |
| Foliar Fertilizers | Consist of both liquid and water soluble fertilizers applied through foliar application. |
| Water-Soluble Fertilizers | Available in various forms including liquid, powder, etc., used in foliar and fertigation mode of fertilizer application. |
| Fertigation | Fertilizers applied through different irrigation systems such as drip irrigation, micro irrigation, sprinkler irrigation, etc. |
| Anhydrous Ammonia | Used as fertilizer, directly injected into the soil, available in gaseous liquid form. |
| Single Super Phosphate (SSP) | Phosphorus fertilizer containing only phosphorus which has lesser than or equal to 35%. |
| Triple Super Phosphate (TSP) | Phosphorus fertilizer containing only phosphorus greater than 35%. |
| Enhanced Efficiency Fertilizers | Fertilizers coated or treated with additional layers of various ingredients to make it more efficient compared to other fertilizers. |
| Conventional Fertilizer | Fertilizers applied to crops through traditional methods including broadcasting, row placement, ploughing soil placement, etc. |
| Chelated Micronutrients | Micronutrient fertilizers coated with chelating agents such as EDTA, EDDHA, DTPA, HEDTA, etc. |
| Liquid Fertilizers | Available in liquid form, majorly used for application of fertilizers to crops through foliar and fertigation. |


Research Methodology
Mordor Intelligence follows a four-step methodology in all our reports.
- Step-1: IDENTIFY KEY VARIABLES: In order to build a robust forecasting methodology, the variables and factors identified in Step-1 are tested against available historical market numbers. Through an iterative process, the variables required for market forecast are set and the model is built on the basis of these variables.
- Step-2: Build a Market Model: Market-size estimations for the forecast years are in nominal terms. Inflation is not a part of the pricing, and the average selling price (ASP) is kept constant throughout the forecast period for each country.
- Step-3: Validate and Finalize: In this important step, all market numbers, variables and analyst calls are validated through an extensive network of primary research experts from the market studied. The respondents are selected across levels and functions to generate a holistic picture of the market studied.
- Step-4: Research Outputs: Syndicated Reports, Custom Consulting Assignments, Databases & Subscription Platforms


