Market Overview
| Study Period | 2021 - 2031 |
|---|---|
| Forecast Data Period | 2026 - 2031 |
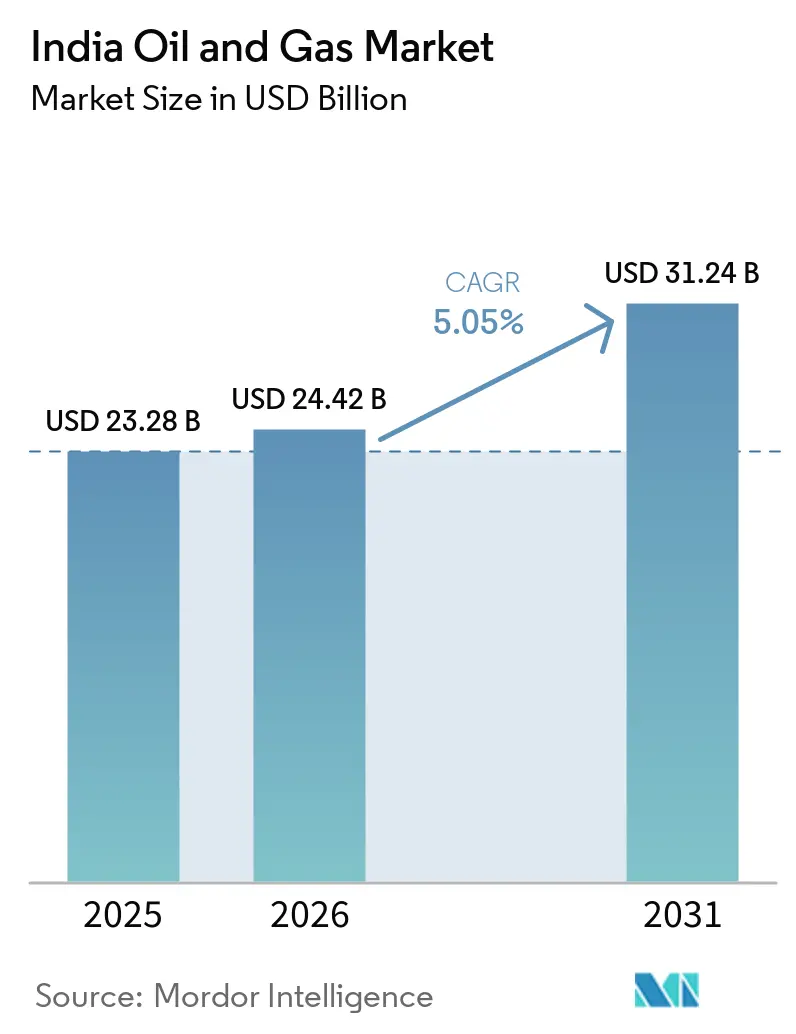
| Base Year Market Size (2025) | USD 23.28 Billion |
| Market Size (2026) | USD 24.42 Billion |
| Market Size (2031) | USD 31.24 Billion |
| Growth Rate (2026 - 2031) | 5.05% CAGR |
| Market Concentration | Medium |
Major Players
*Disclaimer: Major Players sorted in no particular order Image © Mordor Intelligence. Reuse requires attribution under CC BY 4.0. |
|
India Oil and Gas Market Analysis by Mordor Intelligence
The India Oil And Gas Market size is expected to grow from USD 23.28 billion in 2025 to USD 24.42 billion in 2026 and is forecast to reach USD 31.24 billion by 2031 at 5.05% CAGR over 2026-2031.
Growth reflects policy momentum under the Open Acreage Licensing Policy, a widening city-gas distribution footprint that now covers 530 million people, and refinery throughputs that climbed to 257 million t in fiscal 2025 while utilization hovered near 103%.[1]Ministry of Petroleum and Natural Gas, “Annual Report 2024-25,” mopng.gov.in Capital inflows continue despite ESG headwinds: private refiners committed USD 3.2 billion to brownfield upgrades in 2025, and international service firms secured USD 420 million in contracts for digital reservoir solutions that lift recovery from mature fields.[2]Schlumberger, "Digital Solutions for Mature Fields – India Case Study," slb.com Long-term demand visibility is underpinned by industrial clusters that locked in 4.2 bcm of annual gas supply and by 20-year LNG offtake deals, which together stabilize pipeline utilization even as domestic crude plateaus.[3]GAIL India, “Investor Presentation Q3 FY2026,” gailonline.com Headline risks persist around deep-water breakeven economics above USD 55/bbl, a fragmented indirect-tax regime that swings gas feedstock costs by up to 15%, and a USD 1.8 billion divestment wave that is raising project-finance spreads for independents.
Key Report Takeaways
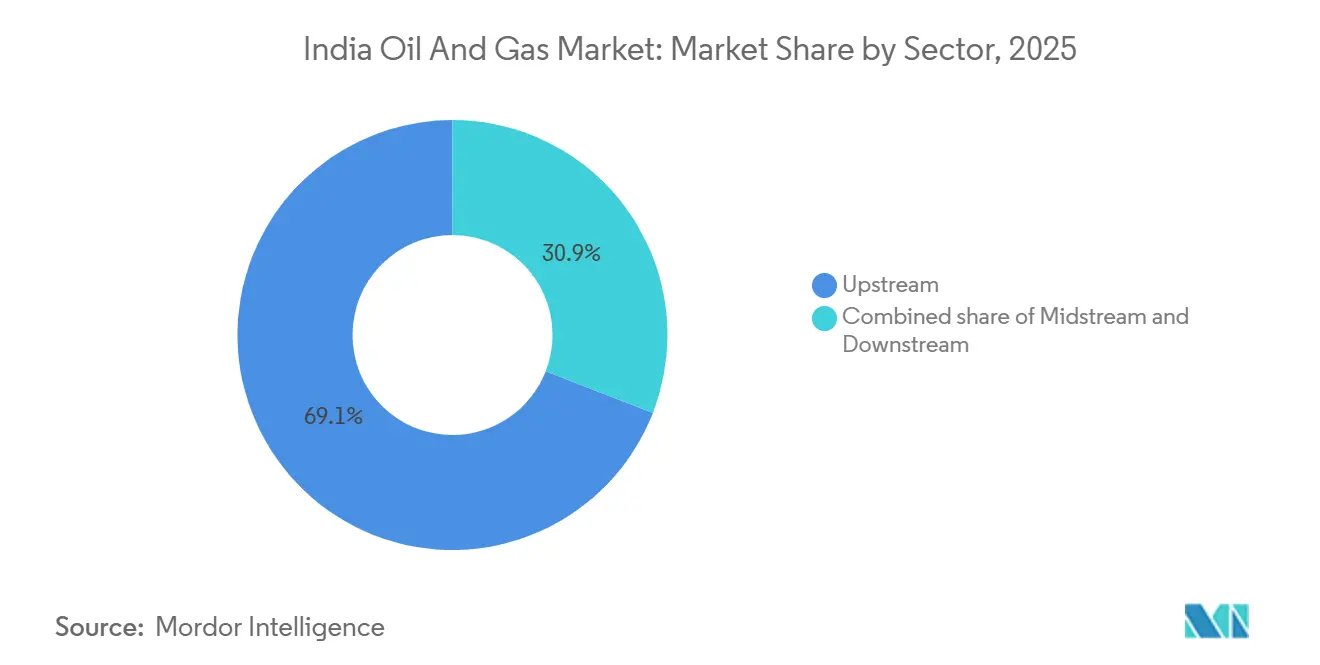
- By sector, upstream activities commanded 69.1% of the Indian oil and gas market share in 2025. Downstream refining and petrochemicals are projected to be the fastest-growing segment, advancing at a 5.4% CAGR through 2031.
- By location, onshore fields held 60.8% of 2025 revenue, whereas offshore developments are forecast to expand at a 7.1% CAGR to 2031.
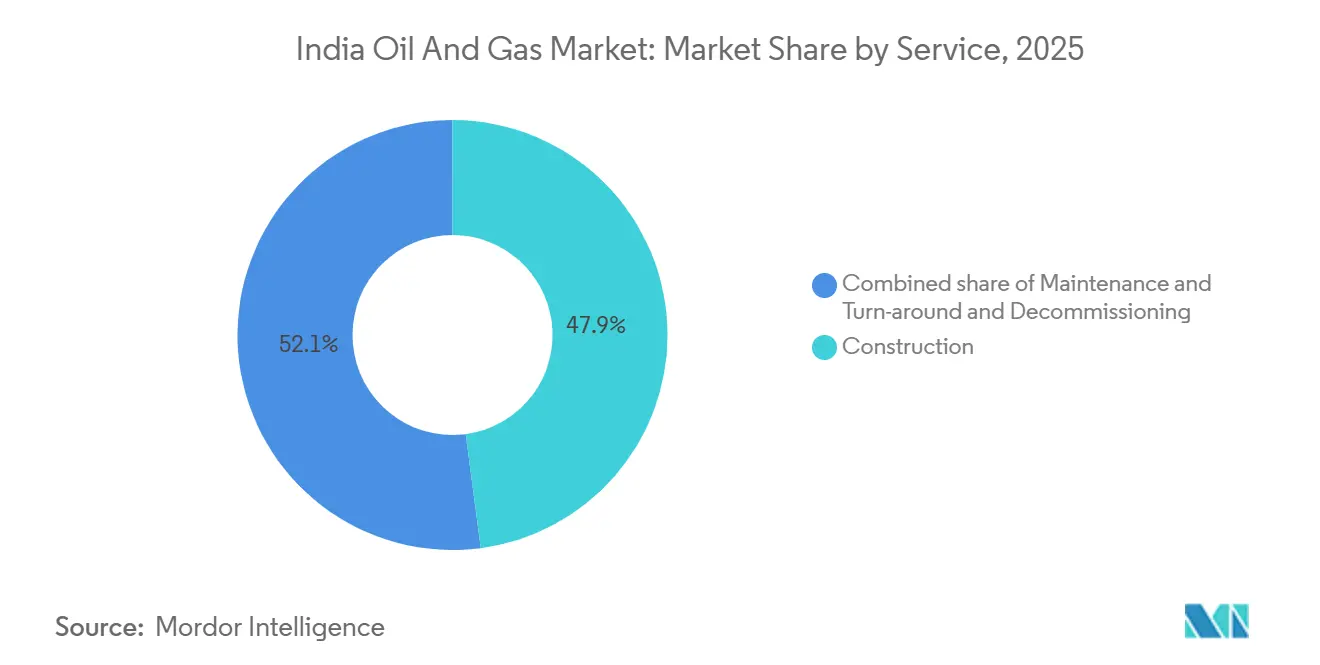
- By service, construction services delivered 47.9% of 2025 revenue, yet maintenance and turn-around activities are expected to grow at a 8.0% CAGR through 2031.
Note: Market size and forecast figures in this report are generated using Mordor Intelligence’s proprietary estimation framework, updated with the latest available data and insights as of 2026.
India Oil and Gas Market Trends and Insights
Drivers Impact Analysis*
| Driver | (~) % Impact on CAGR Forecast | Geographic Relevance | Impact Timeline |
|---|---|---|---|
| Tightening domestic E&P licensing rounds | +0.8% | National, with concentration in Rajasthan, Gujarat, Assam basins | Medium term (2-4 years) |
| Surge in gas-based industrial clusters | +1.2% | Western and Southern India, particularly Gujarat, Maharashtra, Tamil Nadu | Long term (≥4 years) |
| Expansion of city-gas distribution networks | +1.0% | Tier-2 and Tier-3 cities across all states under PNGRB authorization | Medium term (2-4 years) |
| Rising private investments in refinery upgrades | +0.6% | Coastal refining hubs—Gujarat, Maharashtra, Karnataka | Short term (≤2 years) |
| Digital oil-field adoption for mature basins | +0.5% | Mature onshore fields in Rajasthan, Assam, Gujarat | Medium term (2-4 years) |
| Methane-slip abatement mandates | +0.4% | National, with early compliance in ONGC and Oil India operated fields | Long term (≥4 years) |
| Source: Mordor Intelligence | |||
Tightening Domestic E&P Licensing Rounds
The Open Acreage Licensing Policy awarded 14 blocks in the OALP-VIII round during 2025, bringing private explorers into basins historically reserved for state-owned firms.[4]Directorate General of Hydrocarbons, “OALP-VIII Results,” dghindia.gov.in Cairn Oil & Gas and other independents now hold interests in 22 exploration blocks, compressing appraisal timelines and encouraging secondary-recovery pilots that raise near-term production. The revenue-sharing fiscal model lowers the government's take when crude prices soften, improving frontier basin economics. Regulators enforce strict work-program milestones, so operators rely on machine-learning seismic tools to finish data acquisition within three-year windows. These developments collectively lift drilling activity and underpin the positive impact on the Indian oil and gas market.
Surge in Gas-Based Industrial Clusters
New methanol-to-olefins and direct-reduced iron facilities added 12 million scm per day of gas demand by 2027, broadening the buyer base beyond legacy fertilizer offtakers. Gujarat’s Dahej-Hazira corridor alone locked in 4.2 bcm of annual supply under take-or-pay contracts, sustaining pipeline throughput for. Tamil Nadu’s Cuddalore complex will commission a 1.2 Mt ethylene cracker in 2026, absorbing regasified LNG from Ennore and tightening regional balances. A unified tariff cap of INR 70 per MMBtu keeps pipeline transport competitive with naphtha when Brent exceeds USD 70 per barrel. Higher thermal efficiency of gas-fired units relative to coal bolsters environmental compliance for energy-intensive manufacturers.
Expansion of City-Gas Distribution Networks
The Petroleum and Natural Gas Regulatory Board cleared 228 geographic areas by the end of 2025, extending potential service to 530 million residents and enlarging residential, commercial, and transport demand pools. Adani Total Gas and Indraprastha Gas invested INR 48 billion in networks that target 2.8 million household connections by 2026. Compressed natural gas now accounts for 62% of city-gas volumes, but piped natural gas for cooking is growing 14% per year as price parity narrows with subsidized. Performance benchmarks require licensees to connect 10% of authorized homes within three years, accelerating capital deployment. Stable residential load smooths seasonal swings, reducing working-capital burdens for suppliers.
Rising Private Investments in Refinery Upgrades
Private refiners pledged USD 3.2 billion for brownfield expansions in 2025, emphasizing residue upgradation and petrochemical integration to lift gross refining margins above Asian benchmarks. Reliance’s Jamnagar complex added a 0.6 Mt polypropylene train that raised petrochemical intensity to 18% of crude throughput. Nayara Energy’s delayed coker project will lift middle-distillate yield by three percentage points when it enters service in 2026. Hindustan Petroleum’s Visakhapatnam hydrocracker retrofit cuts fuel-oil output by 28% and meets Bharat Stage VI sulfur norms. Private capital is thus underwriting clean-fuel capability without direct public funding, though it heightens potential stranded-asset risk if electric-vehicle uptake accelerates.
Restraints Impact Analysis*
| Restraint | (~) % Impact on CAGR Forecast | Geographic Relevance | Impact Timeline |
|---|---|---|---|
| Feedstock volatility under Indirect Tax regime | -0.7% | National, with acute impact on gas-consuming industries in Gujarat, Maharashtra | Short term (≤2 years) |
| Slow land-acquisition for trunk pipelines | -0.5% | Eastern and Central India—Uttar Pradesh, Madhya Pradesh, Chhattisgarh | Medium term (2-4 years) |
| High breakeven of deep-water prospects | -0.9% | Offshore blocks in Krishna-Godavari and Cauvery basins | Long term (≥4 years) |
| ESG-driven capital flight from fossil assets | -1.1% | National, affecting all upstream and midstream project financing | Long term (≥4 years) |
| Source: Mordor Intelligence | |||
ESG-Driven Capital Flight from Fossil Assets
Institutional investors divested roughly USD 1.8 billion from Indian fossil equities in 2025 as net-zero mandates took hold. Equity markets had historically supplied one-third of upstream project capital, so private operators now pay 150-200 basis-point spreads above benchmarks to secure debt, eroding project economics. GAIL’s USD 2.1 billion Jagdishpur-Haldia pipeline struggled to attract international lenders, pushing the firm toward domestic banks that approach exposure ceilings. ESG screens also constrain midstream and downstream projects because disclosure frameworks force companies to quantify Scope 3 emissions, which positions gas unfavorably for some global funds. The resulting capital scarcity delays final investment decisions and tempers growth in the Indian oil and gas market.
Slow Land-Acquisition for Trunk Pipelines Constrains Infrastructure Development
Deep-water projects in the Krishna-Godavari basin need breakeven prices above USD 55 per barrel, making development sensitive to price cycles. Reliance-BP deferred the next KG-D6 phase as well, as costs touched USD 180 million per well and subsurface complexities mounted. Oil and Natural Gas Corporation's KG-DWN-98/2 block redesign added 14 months to the schedule after reservoir pressures fell 15% below expectations. Deep-water lifecycles stretch 6-8 years, so delays compress economic returns by up to 12% due to capital compounding. Although revenue-sharing fiscal terms ease the government's take versus legacy contracts, operating expenditure above USD 18 per barrel still leaves thin margins when Brent trades near USD 75.
*Our forecasts treat driver/restraint impacts as directional, not additive. The impact forecasts reflect baseline growth, mix effects, and variable interactions.
Segment Analysis
By Sector: Profitability Migrates Downstream
Upstream held 69.1% of the Indian oil and gas market revenue in 2025, yet its operating margin fell to 34% as mature fields required more artificial lift, pushing lifting costs to USD 22 per barrel. Downstream refining and petrochemicals expanded at 5.4% a year, and Reliance’s FY2025 gross refining margin of USD 11.80 per barrel exceeded the Singapore benchmark by USD 7.30 because 18% of throughput became polymers. Midstream held the balance, but a unified tariff cap limits upside even as volumes grow.
Value capture is shifting: integrated players controlling molecules from the wellhead to the barrel of polymer command higher returns. Petrochemical add-ons boost margins while insulating refineries from motor-fuel cyclicality, making downstream assets increasingly strategic to the Indian oil and gas market. Upstream firms are responding with enhanced-oil-recovery pilots such as Cairn’s polymer flood that could add 140 million barrels, mirroring downstream process-optimization philosophies.


By Location: Offshore Growth Outpaces Onshore Dominance
Onshore assets delivered 60.8% of 2025 revenue, led by Rajasthan’s Mangala, Bhagyam, and Aishwariya fields that together supplied 35% of national crude. Offshore developments are advancing at 7.1% a year; KG-D6 alone lifted gas output to 29 million scm per day, adding headroom to the Indian oil and gas market size for gas between 2025 and 2026.
Onshore drilling remains cheaper at USD 8-12 million per well and benefits from quicker cycles, yet water cuts topping 85% in Assam point to geological maturity. Offshore wells cost roughly USD 180 million but yield six to ten times the productivity, which balances economics even with higher risk. Regulators awarded eight new offshore blocks in 2025, signaling ongoing policy support despite ESG headwinds.
By Service: Maintenance Leads Future Spend
Construction contributed 47.9% of 2025 service revenue, reflecting pipeline builds and refinery upgrades. Maintenance and turnaround activities, however, are expanding at 8.0% per year and are projected to overtake construction before 2029, a clear pivot within the Indian oil and gas market share of service budgets.
Refineries installed in the 1990s now face their fourth major turnaround, with intervals compressing from 48 months to 36 months as heavier crudes increase corrosion. Digital twins deployed at Bombay High cut unplanned downtime by 18%, delaying a USD 140 million refurbishment. Decommissioning remains embryonic because the removal costs of USD 50-80 million per platform outweigh current economics, so operators focus on life-extension projects that defer abandonment liabilities.
Geography Analysis
Rajasthan’s Barmer basin yielded 10.2 million t of crude in 2025, or 35% of national output, secured by a single 590-km export pipeline to Salaya that highlights regional concentration risk. Gujarat’s Cambay basin and the adjacent Bombay High produced 8.6 million t of crude plus 18 bcm of gas, leveraging proximity to the Jamnagar and Vadinar refineries for immediate off-take. Assam’s Upper Assam shelf supplied 4.8 million t of crude, yet 85% water cut necessitates enhanced-recovery pilots that elevate spending but temper volumetric upside.
Tamil Nadu’s Cauvery basin represents a frontier province where six exploratory wells drilled in 2025 delivered gas shows that await appraisal; monsoon weather limits drilling windows to seven months, inflating jack-up day rates to USD 95,000. The offshore Krishna-Godavari basin is the principal growth engine: KG-D6 reached 29 million scm per day in 2025 and targets 35 million by late 2026, accounting for 18% of national gas consumption.
Geographic policy asymmetries shape execution risk. Gujarat’s single-window land approvals helped commission the 1,670-km Mallavaram-Bhilwara-Vijaipur pipeline in 32 months, whereas fragmented processes in Uttar Pradesh added 18 months to the Barauni-Guwahati line. Rajasthan levies a 12.5% royalty plus 20% profit share that trims Cairn’s net realization to USD 52 per barrel when Brent trades at USD 75, discouraging marginal field work-overs. Assam’s 10-year tax holiday for coal-bed methane attracted 18 pilot wells in 2025, broadening the unconventional portfolio. These state differences create pockets of opportunity and bottleneck risk within the Indian oil and gas market.
Competitive Landscape
State-owned enterprises still control 70% of upstream, and 62% of refining capacity, yet private operators are gaining share in petrochemicals, offshore gas, and city-gas distribution, tilting competitive gravity within the Indian oil and gas market. Reliance Industries steered Jamnagar toward 42% non-fuel revenue in FY2025, insulating margins from motor-fuel volatility. Cairn Oil & Gas achieved lifting costs of USD 18.40 per barrel in Rajasthan, 22% below the national average, by automating well testing and deploying electric submersible pumps.
White-space opportunities are emerging in decommissioning, digital reservoir management, and unconventional gas. India has 42 offshore platforms older than 25 years, yet no domestic contractor offers integrated plug-and-abandonment services, opening the door for joint ventures with international specialists. Schlumberger’s cognitive platform at Bombay High cut seismic interpretation time by 40% and surfaced 18 million barrels of bypassed pay, underscoring software’s role in mature-field value extraction. Coal-bed methane output remains negligible at 2.8 million scm per day despite 92 Tcf in-place resources, chiefly because of water management and evacuation constraints.
Technology adoption reveals a stark divide. Private players invest 4-6% of capital outlays in digital tools, double the rate of state firms, which preserves their efficiency edge. Adani Total Gas built city-gas networks 30% faster than incumbents by coupling its logistics backbone with TotalEnergies’ technical expertise, seizing 14% of the compressed natural gas market within four years. The widening productivity gap is likely to push the government toward faster privatization or performance-linked incentives for state companies.
India Oil and Gas Industry Leaders
-
Oil and Natural Gas Corporation (ONGC)
-
Indian Oil Corporation Ltd. (IOCL)
-
Reliance Industries Ltd.
-
Bharat Petroleum Corporation Ltd.
-
GAIL (India) Ltd.
- *Disclaimer: Major Players sorted in no particular order

Recent Industry Developments
- February 2026: TIL Ltd's board approved the acquisition of a 60% stake in Tulip Compression Private Ltd, marking its entry into clean energy manufacturing, including CNG, LNG, and hydrogen equipment. This move expands its portfolio and supports backward integration. The transaction is subject to shareholder and regulatory approvals.
- January 2026: BPCL is actively seeking renewable energy acquisitions and global investments in solar, wind, and hydropower. Simultaneously, it continues refinery expansions to balance growing fuel demand with emissions reduction efforts, aligning with India’s sustainability targets.
- December 2025: India announced a new bid round offering 50 oil and gas exploration blocks to attract investment, boost domestic production, and reduce energy imports. This initiative is part of broader efforts to strengthen the upstream sector and enhance energy security amid global market dynamics.
- September 2025: ONGC announced plans to acquire 2.5–3 GW of renewable energy projects by 2030. This initiative is part of its strategy to diversify its portfolio and accelerate India’s transition from fossil fuels, reflecting a strategic shift toward clean energy in response to global decarbonization trends.


India Oil and Gas Market Report Scope
The oil and natural gas market is a major industry in the energy market and plays an influential role in the global economy as the world's primary fuel source. The processes and systems involved in producing and distributing oil and gas are highly complex, capital-intensive, and require state-of-the-art technology. The oil and gas value chain includes extraction of petroleum, refining, transportation, and retailing. The scope of the Indian oil and gas market includes:
By Sector
| Upstream |
| Midstream |
| Downstream |
By Location
| Onshore |
| Offshore |
By Service
| Construction |
| Maintenance and Turn-around |
| Decommissioning |
| By Sector | Upstream |
| Midstream | |
| Downstream | |
| By Location | Onshore |
| Offshore | |
| By Service | Construction |
| Maintenance and Turn-around | |
| Decommissioning |


Key Questions Answered in the Report
What is the current value of the India oil and gas market?
The India oil and gas market size stood at USD 24.42 billion in 2026 and is projected to reach USD 31.24 billion by 2031.
How fast will India's offshore oil and gas segment grow?
Offshore developments are set to expand at a 7.1% CAGR through 2031, driven by deep-water projects in the Krishna-Godavari basin.
Which sector will add the most value over the next five years?
Downstream refining and petrochemicals are forecast to grow at 5.4% annually, outpacing upstream and midstream segments.
How are ESG trends affecting investment?
Institutional divestments of about USD 1.8 billion in 2025 raised financing costs by up to 200 basis points for private operators.
Why are maintenance services gaining importance?
Aging refineries and offshore platforms require more frequent turn-arounds, driving maintenance revenues to grow at 8.0% per year.
What policy changes support gas demand growth?
Authorization of 228 city-gas areas and tariff caps on pipeline transport are expanding residential and industrial gas consumption.
Page last updated on:


