
India Hydrogen Peroxide Market Size and Share
Market Overview
| Study Period | 2020 - 2031 |
|---|---|
| Forecast Data Period | 2026 - 2031 |
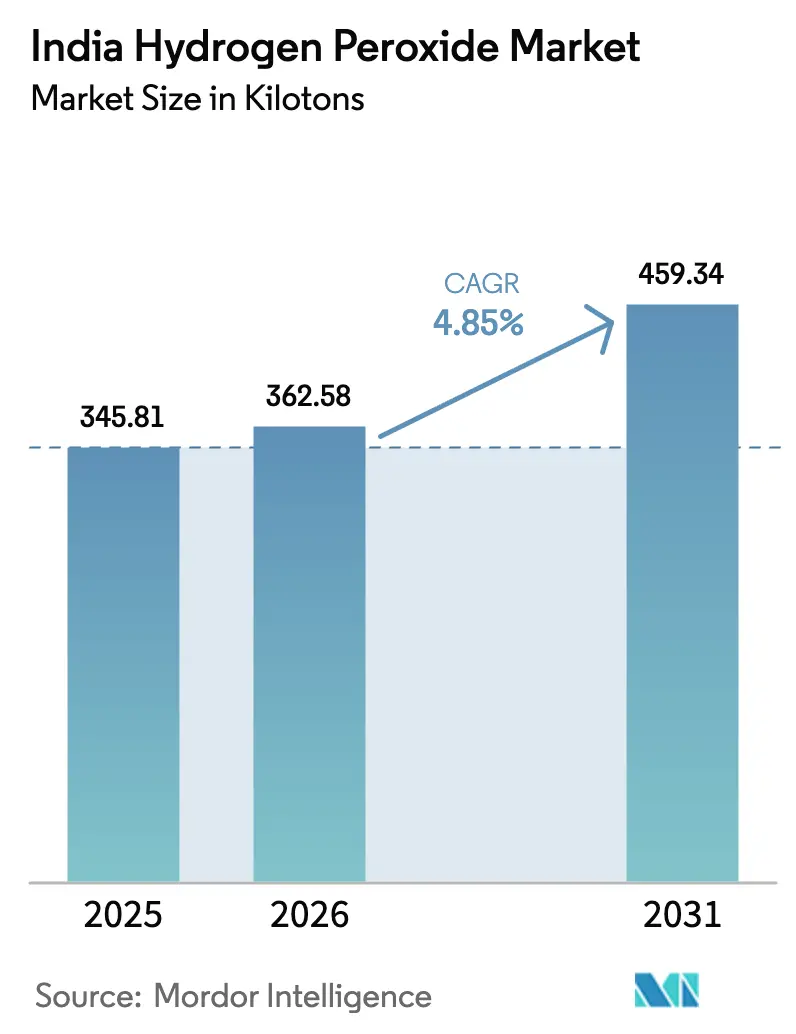
| Base Year Market Size (2025) | 345.81 kilotons |
| Market Volume (2026) | 362.58 kilotons |
| Market Volume (2031) | 459.34 kilotons |
| Growth Rate (2026 - 2031) | 4.85% CAGR |
| Market Concentration | Medium |
Major Players
*Disclaimer: Major Players sorted in no particular order Image © Mordor Intelligence. Reuse requires attribution under CC BY 4.0. |
|
India Hydrogen Peroxide Market Analysis by Mordor Intelligence
The India Hydrogen Peroxide Market size in 2026 is estimated at 362.58 kilotons, growing from 2025 value of 345.81 kilotons with 2031 projections showing 459.34 kilotons, growing at 4.85% CAGR over 2026-2031. Capacity additions anchored in Gujarat, Tamil Nadu, and Maharashtra are sustaining supply, while demand is gradually tilting toward specialty-grade uses in healthcare, wastewater treatment, and semiconductor fabrication. Green-hydrogen projects under the National Green Hydrogen Mission are lowering long-term carbon intensity, reducing dependence on anthraquinone imports, and creating a two-tier pricing structure that rewards low-emission grades. At the same time, tighter zero-liquid-discharge rules in the textiles industry and continued use of recycled fibers in pulp and paper are stabilizing base-load consumption. Import competition from Bangladesh and small-scale domestic plants keeps pricing power muted; yet, premium margins are emerging in the electronics, food-grade, and vapor-sterilization segments. Overall, the India hydrogen peroxide market now offers parallel growth avenues: volume defense in bleaching and value creation in high-purity applications.
Key Report Takeaways
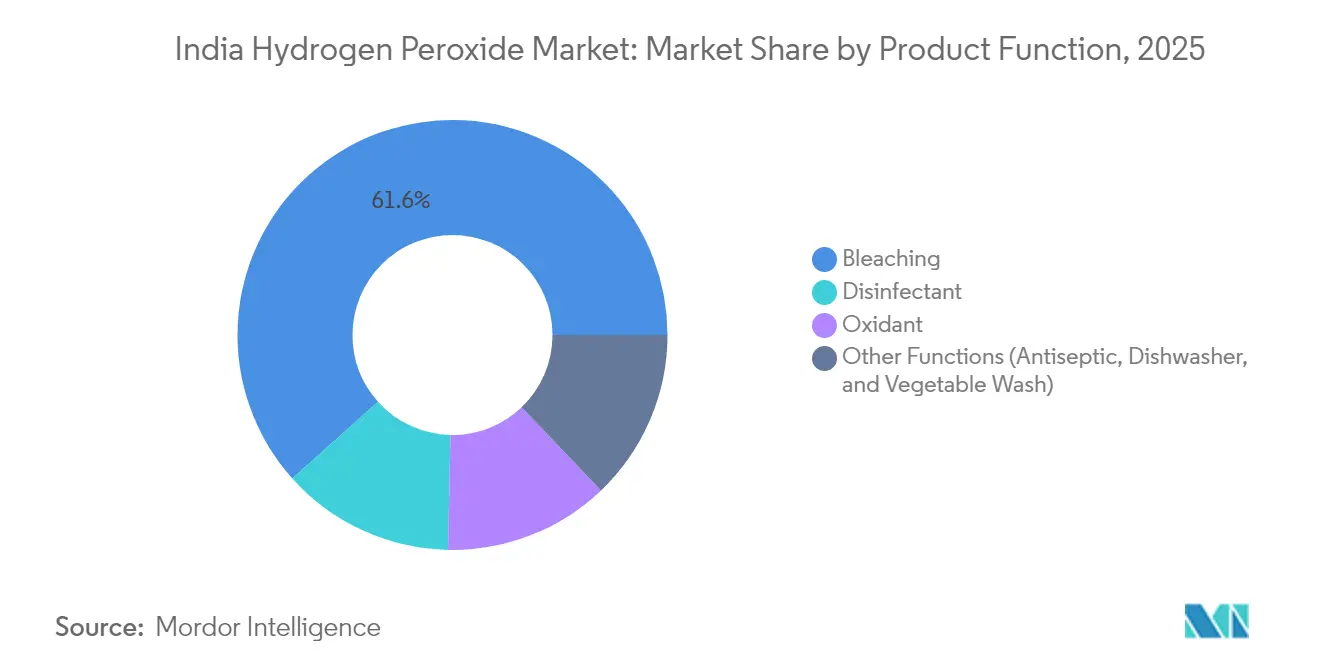
- By product function, bleaching led with 61.62% of the India hydrogen peroxide market share in 2025; disinfectant applications are projected to expand at a 5.12% CAGR through 2031.
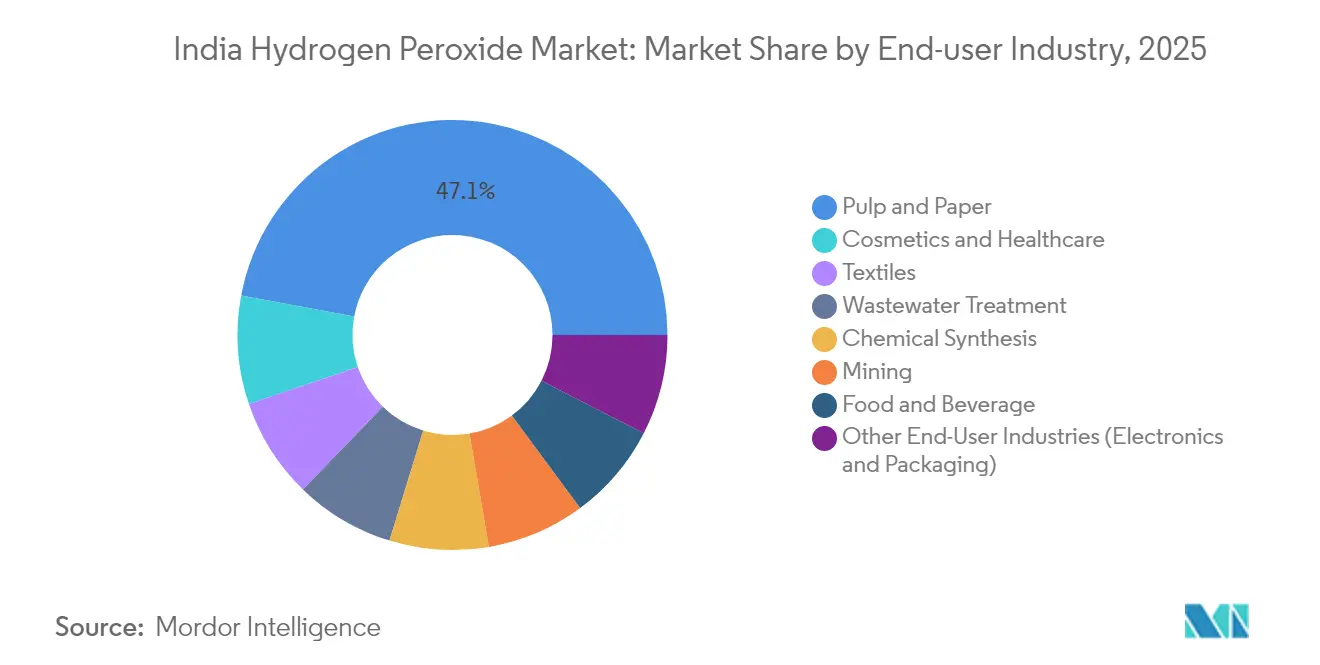
- By end-user industry, the pulp and paper sector accounted for a 47.05% share of the India hydrogen peroxide market size in 2025, while the cosmetics and healthcare sectors are projected to advance at a 5.27% CAGR through 2031.
Note: Market size and forecast figures in this report are generated using Mordor Intelligence’s proprietary estimation framework, updated with the latest available data and insights as of 2026.
Global valuation is built by aggregating outputs from multiple countries and regions, with India being one of the contributors. Our global hydrogen peroxide market size represents that cumulative total.
India Hydrogen Peroxide Market Trends and Insights
Drivers Impact Analysis*
| Driver | (~) % Impact on CAGR Forecast | Geographic Relevance | Impact Timeline |
|---|---|---|---|
| Growing domestic pulp-and-paper bleaching demand | +1.2% | Gujarat, Tamil Nadu, Andhra Pradesh, Odisha | Medium term (2-4 years) |
| Rising wastewater AOP installations in Tier-2/3 cities | +0.8% | Nationwide Tier-2/3 urban centers | Long term (≥ 4 years) |
| Capacity expansion by new entrants using green-hydrogen feedstock | +1.0% | Gujarat and Maharashtra industrial corridors | Medium term (2-4 years) |
| Textile mills’ switch from chlorine to peroxide | +0.9% | Tamil Nadu, Gujarat, Maharashtra textile hubs | Short term (≤ 2 years) |
| Semiconductor-grade peroxide demand from new fabs | +0.6% | Gujarat, Karnataka, Tamil Nadu semiconductor clusters | Long term (≥ 4 years) |
| Source: Mordor Intelligence | |||
Growing Domestic Pulp-and-Paper Bleaching Demand
India’s 25 million-tonne pulp and paper sector relies on 52-75% recycled fiber, which requires intensive peroxide bleaching to achieve ISO brightness levels[1]Indian Paper Manufacturers Association, “Annual Report 2024-25,” ipma.co.in. Bleaching already absorbs 62.23% of the hydrogen-peroxide volume, providing producers with a predictable base-load offtake aligned with mill locations in Gujarat, Tamil Nadu, Andhra Pradesh, and Odisha. Freight savings accrue when peroxide units are located near paper clusters, as UN 2014 regulations limit long-haul movements of solutions with concentrations greater than 35%. Incremental recycled-fiber capacity continues to grow, even as total paper output plateaus, ensuring that bleaching demand remains resilient against fluctuations in virgin-pulp imports.
Rising Wastewater AOP Installations in Tier-2/3 Cities (Under AMRUT 2.0)
Municipalities upgrading under AMRUT 2.0 are adopting advanced-oxidation systems that dose hydrogen peroxide with UV or ozone to degrade dyes, pharmaceuticals, and micro-pollutants. Textile centers, such as Tiruppur and Surat, are early movers because zero-liquid-discharge mandates penalize chlorinated effluents. Decentralized project roll-outs create numerous mid-sized demand nodes, favoring distributors with regional depots that can supply 35% grades safely. Service-oriented suppliers that help calibrate peroxide feed rates in AOP plants are capturing loyalty and commanding a premium above commodity bleaching prices.
Capacity Expansion by New Entrants Using Green-Hydrogen Feedstock
DCM Shriram commissioned a 52,500 tpa plant in August 2024, which integrates electrolytic hydrogen and targets a 20-25% share by 2027. The National Green Hydrogen Mission’s 5 million-tonne target by 2030 ensures a scalable domestic feedstock pool, thereby undermining the 95% share that anthraquinone currently holds in legacy processes. Early adopters can monetize carbon-footprint differentials as downstream users track Scope 3 emissions, although the delivered cost of green hydrogen in 2025 is still two to three times that of conventional hydrogen.
Textile Mills’ Switch from Chlorine to Peroxide for Zero-Liquid-Discharge Compliance
India’s USD 165 billion textile complex is retrofitting peroxide bleaching lines to replace chlorine, which forms banned organochlorines. Tamil Nadu, Gujarat, and Maharashtra, which represent over 60% of the national fabric output, are installing peroxide storage and dosing skids in existing plants. Although regulatory clarity varies by state, early movers report reduced wastewater treatment costs because peroxide decomposes into water and oxygen, eliminating the need for downstream dechlorination. Freight rules that restrict bulk shipments above 35% force more frequent deliveries, but suppliers offset higher logistics costs by bundling technical services and achieving faster turnaround.
Restraints Impact Analysis*
| Restraint | (~) % Impact on CAGR Forecast | Geographic Relevance | Impact Timeline |
|---|---|---|---|
| Freight-hazard regulations tightening cylinder transport above 35 % strength | -0.5% | Nationwide remote industrial clusters | Short term (≤ 2 years) |
| Volatility in anthraquinone import prices | -0.4% | Producers without backward integration | Medium term (2-4 years) |
| Persistent sub-scale plants (<20 ktpa) battling power tariffs | -0.3% | Tamil Nadu, Maharashtra high-tariff states | Long term (≥ 4 years) |
| Source: Mordor Intelligence | |||
Freight-Hazard Regulations Tightening Cylinder Transport Above 35 % Strength
UN 2014 rules classify hydrogen peroxide as an oxidizer with a corrosive sub-risk, limiting tanker loads to above 35% and banning concentrations above 40% on aircraft[2]National Peroxide Ltd., “Safety Data Sheet Hydrogen Peroxide 35 %,” naperol.com. Producers must either dilute before shipment, which raises the freight cost per active kilogram, or build regional depots, locking up working capital. Logistics expenses to Tier-3 textile towns now run 15-20% above those for bulk chemicals, favoring incumbents that own certified tanker fleets.
Volatility in Anthraquinone Import Prices
Roughly 95 % of global output still relies on the anthraquinone auto-oxidation loop. Indian buyers face opaque pricing linked to crude derivatives, with no hedge instruments available. When anthraquinone spiked during the 2024 oil rallies, domestic peroxide margins narrowed because downstream buyers resisted spot price hikes. Interest in green hydrogen or electrochemical routes is therefore accelerating as producers seek feedstock diversification.
*Our forecasts treat driver/restraint impacts as directional, not additive. The impact forecasts reflect baseline growth, mix effects, and variable interactions.
Segment Analysis
By Product Function: Bleaching Dominates, Disinfectant Accelerates
Bleaching captured 61.62% of the hydrogen-peroxide volume in 2025 because recycled-fiber paper mills dose higher loadings to meet brightness targets. Disinfectant usage, although smaller in tonnage, is rising at a 5.12% CAGR as hospitals deploy vapor-phase systems and pharmaceutical plants convert to low-residue sanitizers. Oxidant grades serve mining and chemical syntheses, enhancing gold and copper recovery by 10-15 %. Niche household, vegetable-wash, and dishwasher formulations round out demand, but require Food Chemical Codex compliance and attract premium pricing.
The India hydrogen peroxide market size for bleaching is projected to rise steadily in lockstep with the addition of recycled-paper capacity, while disinfectant demand is set to carve out a larger value share, despite its lower tonnage base. Oxidant applications will stay cyclical, mirroring metal prices, yet deliver attractive margins in up-cycles. High-purity vapor grades provide a bridgehead for suppliers pivoting from commodity bleaching. The India hydrogen peroxide industry participants that combine bulk output with specialty purification stand to widen EBITDA spreads as customer audits tighten.



By End-User Industry: Pulp and Paper Leads, Cosmetics and Healthcare Surges
Pulp and paper accounted for 47.05% of total consumption in 2025, due to India’s 25 million-tonne capacity and high reliance on recycled fibers. Cosmetics and healthcare exhibit the fastest growth trajectory at 5.27% CAGR, supported by a USD 20 billion beauty sector that is growing at 25% annually. Chemical synthesis, wastewater treatment, mining, and food packaging form a diversified second tier of demand.
Within the pulp and paper industry, recycled mills will continue to dose higher peroxide volumes, ensuring baseline stability. Cosmetics and healthcare create opportunities for value-added grades, including 6-12% solutions for hair dyes and 35% liquids for tooth-whitening gels. The India hydrogen peroxide market size allocated to cosmetics is forecast to double by 2031 if current spending patterns persist. Chemical synthesis demand increases from domestic propylene oxide capacity expansions utilizing hydrogen peroxide-to-propylene oxide (HPPO) technology. Wastewater treatment volumes hinge on the execution of AMRUT 2.0, but Tier-2/3 cities already represent a material incremental tonnage. Cost-sensitive food and beverage sterilization is facing substitution from eBeam technology, yet suppliers offering ultra-low-residue grades are maintaining their market share.
Geography Analysis
Gujarat has emerged as the nucleus of the India hydrogen peroxide market, hosting DCM Shriram’s 52,500 tpa Jhagadia plant, Gujarat Alkalies’ 14,000 tpa Dahej unit, and several chlor-alkali downstream ventures. Proximity to refinery feedstocks, deep-water ports and recycled-paper mills keeps freight low and utilization high. Tamil Nadu and Maharashtra absorb large volumes in textiles and pharmaceuticals but impose higher electricity tariffs that compress margins for sub-scale producers.
Andhra Pradesh and Odisha pulp mills provide coastal outlets for imported recycled fiber and sustain bleaching demand, but rely on shipments from western Indian suppliers, incurring 10-15% freight premiums. Tier 2/3 cities across these states are beginning to operate AOP wastewater plants, thereby widening the customer base beyond legacy industrial hubs. Semiconductor clusters subsidized under the PLI scheme in Gujarat, Karnataka, and Tamil Nadu are expected to create pockets of UHP peroxide demand post-2026, although initial tonnage will be modest.
Bangladeshi imports enter through eastern corridors yet face antidumping probes that may narrow arbitrage over time. States with planned green-hydrogen corridors—Gujarat, Maharashtra, Karnataka—will gradually host new peroxide units integrated with electrolyzer parks, further reinforcing the west-coast dominance of production.
Coverage of the hydrogen peroxide market by Mordor Intelligence spans a wide geographic footprint, with regional analysis available for North America, Asia, and Europe.
Competitive Landscape
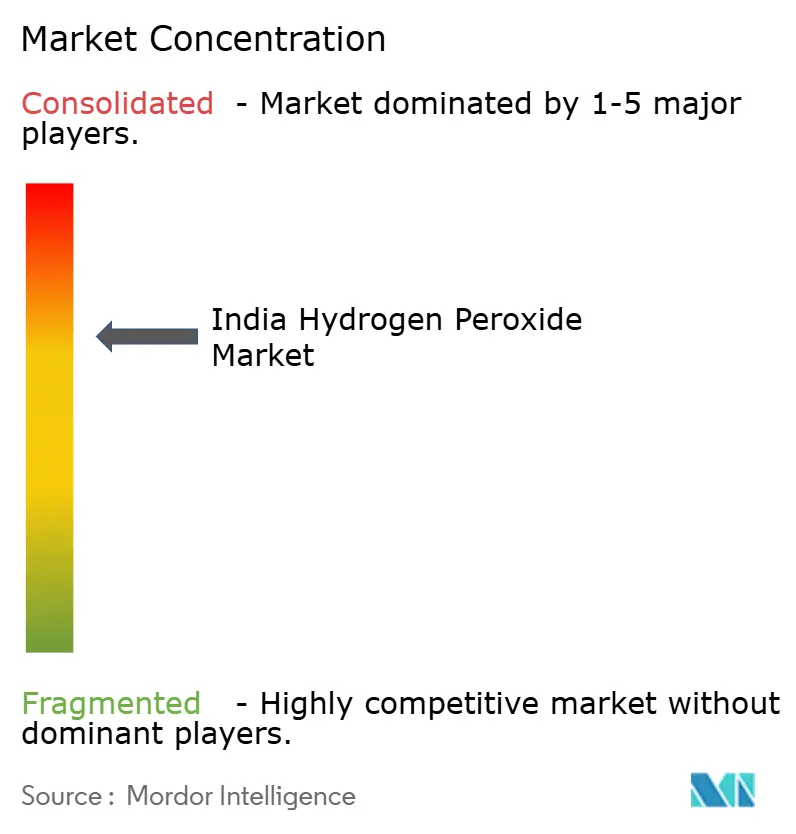
The Indian Hydrogen Peroxide market is moderately consolidated. Large incumbents defend their commodity bleaching share through plant scale and captive logistics, whereas new entrants pursue high-margin segments, such as semiconductor-grade or green-credential peroxide. Domestic supply still vies with Bangladeshi imports during high-run periods, capping spot price rallies. Producers that integrate power, logistics, and purification are widening EBITDA gaps over fragmented peers.
India Hydrogen Peroxide Industry Leaders
-
Aditya Birla Chemicals
-
Gujarat Alkalies and Chemical Limited
-
Indian Peroxide Limited
-
Meghmani Finechem Limited (MFL)
-
National Peroxide Limited
- *Disclaimer: Major Players sorted in no particular order

Recent Industry Developments
- May 2025: The Indian hydrogen peroxide market witnessed a sharp upward price movement between March and May 2025, with rates climbing from around INR 22/kg (~USD 0.26/kg) in mid-March to INR 26.5/kg (~USD 0.31/kg) in the last week of May 2025 and remaining almost stable in the weeks of May. This significant increase reflected a tightening supply situation in the market.
- August 2024: DCM Shriram commissioned its hydrogen peroxide (H2O2) plant in Jhagadia, Bharuch district, Gujarat. The 52,500 tpa plant is a downstream facility for hydrogen production.


India Hydrogen Peroxide Market Report Scope
Hydrogen peroxide is a colorless liquid at room temperature with a bitter taste. Small amounts of gaseous hydrogen peroxide occur naturally in the air. Hydrogen peroxide is unstable, decomposing readily to oxygen and water with the release of heat. Although nonflammable, it is a powerful oxidizing agent that can cause spontaneous combustion when it comes in contact with organic material.
The market is segmented by product function and end-user industry. By product function, the market is segmented into disinfectant, bleaching, oxidant, and other product functions (antiseptic, dishwasher, and vegetable wash). By end-user industry, the market is segmented into pulp and paper, chemical synthesis, wastewater treatment, mining, food and beverage, cosmetics and healthcare, textiles, and other end-user industries (electronics, packaging). For each segment, the market sizing and forecasts have been done based on volume (tons).
| Disinfectant |
| Bleaching |
| Oxidant |
| Other Functions (Antiseptic, Dishwasher, and Vegetable Wash) |
| Pulp and Paper |
| Chemical Synthesis |
| Wastewater Treatment |
| Mining |
| Food and Beverage |
| Cosmetics and Healthcare |
| Textiles |
| Other End-User Industries (Electronics and Packaging) |
| By Product Function | Disinfectant |
| Bleaching | |
| Oxidant | |
| Other Functions (Antiseptic, Dishwasher, and Vegetable Wash) | |
| By End-user Industry | Pulp and Paper |
| Chemical Synthesis | |
| Wastewater Treatment | |
| Mining | |
| Food and Beverage | |
| Cosmetics and Healthcare | |
| Textiles | |
| Other End-User Industries (Electronics and Packaging) |


Key Questions Answered in the Report
What is the projected volume for India’s hydrogen peroxide demand in 2031?
The India Hydrogen Peroxide Market demand is forecast to reach 459.34 kilotons by 2031, reflecting a 4.85% CAGR during 2026-2031.
Which application leads hydrogen peroxide consumption in India?
Bleaching in pulp and paper remains dominant, representing 61.62 % of 2025 volume.
Why are textiles shifting from chlorine to peroxide bleaching?
Zero-liquid-discharge regulations prohibit organochlorine effluent, and peroxide decomposes into water and oxygen, easing compliance costs.
How will green hydrogen reshape domestic peroxide production?
Plants integrated with green hydrogen cut anthraquinone imports and lower carbon intensity, supporting premium pricing in sustainability-focused end-markets.
Which end-user is growing the fastest through 2031?
Cosmetics and healthcare show the highest CAGR at 5.27 % through 2031 owing to rapid expansion of India’s beauty and medical sectors.
Page last updated on:






