
India Fintech Market Analysis by Mordor Intelligence
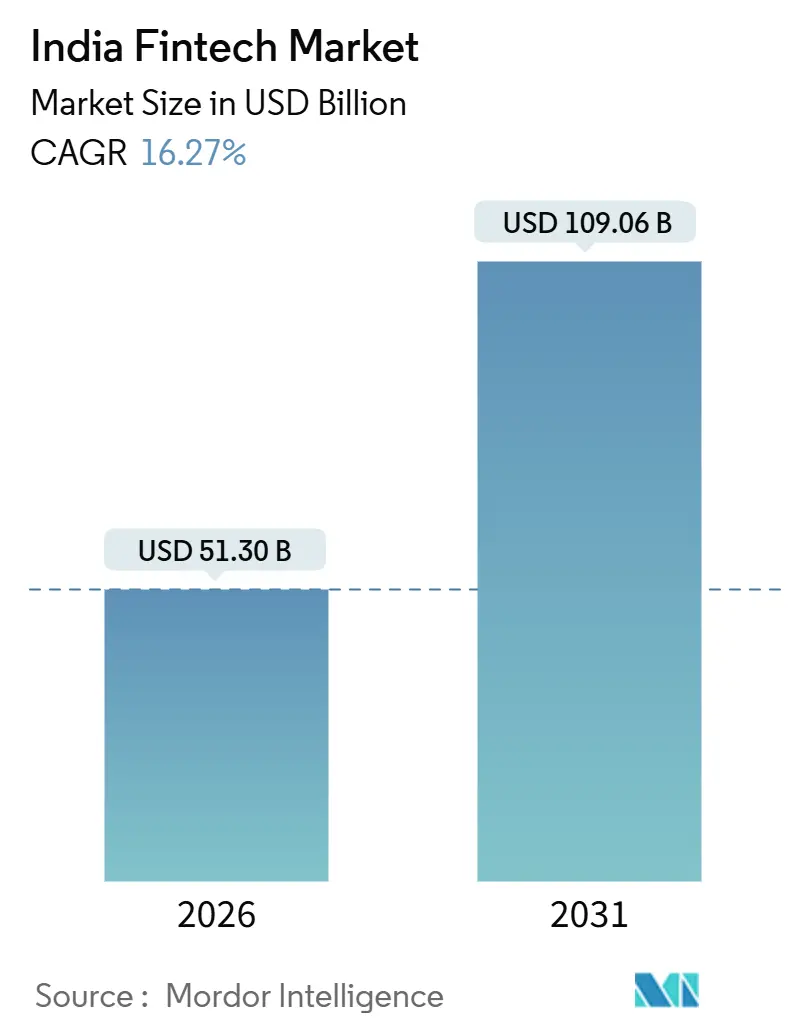
The India fintech market size is expected to increase from USD 51.3 billion in 2026 to USD 59.65 billion in 2027 and reach USD 127.6 billion by 2032, growing at a CAGR of 16.42% over 2027-2032.
India's shared payment and identity infrastructure supports digital lending by connecting customers, transaction records and financial institutions. Embedded checkout credit and GST-linked working-capital services extend that reach into specific purchasing and business-financing tasks. India's select-UPI merchant-fee framework, announced in September 2026 to support system sustainability while protecting individuals and small merchants, keeps small-value merchant payments free of merchant fees while applying a merchant fee above a set threshold. With fees restricted on small-value merchant payments, providers can broaden their role through checkout integration, while expansion into digital lending brings continuing oversight duties.
Key Report Takeaways
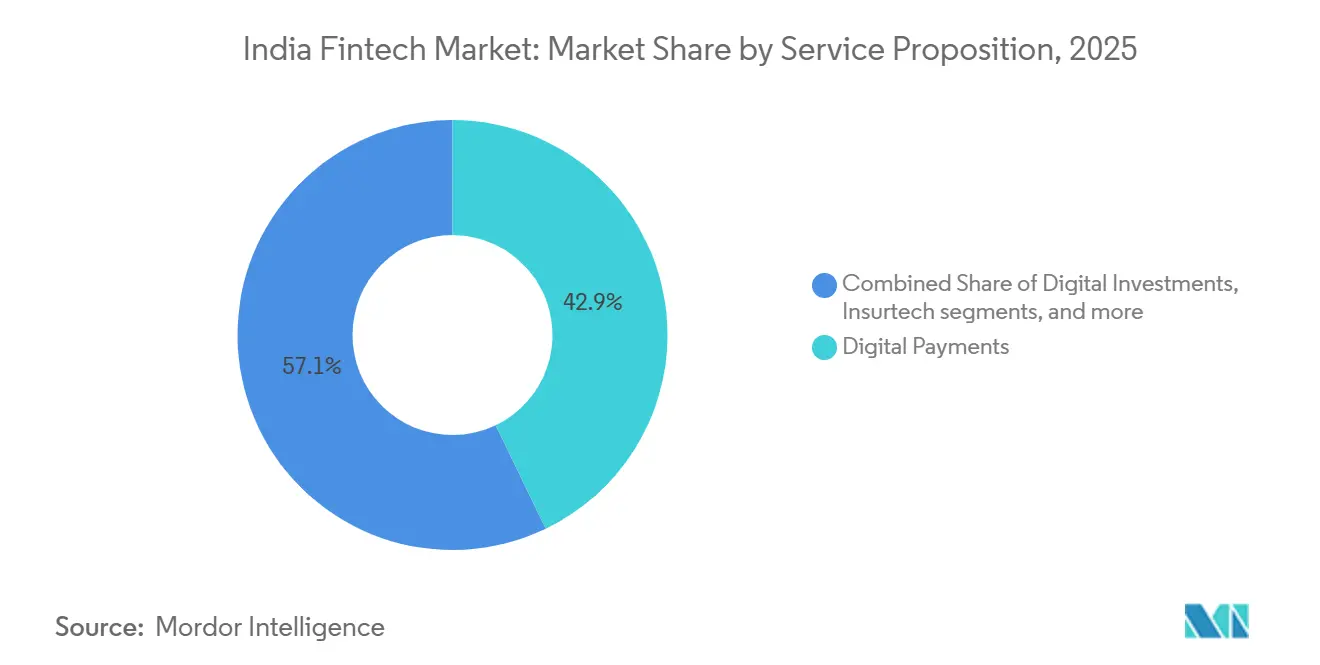
- By service proposition, digital payments held a 42.69% India fintech market share in 2026, while neobanking is forecast to be the fastest-growing segment at a CAGR of 19.8% over 2027-2032.
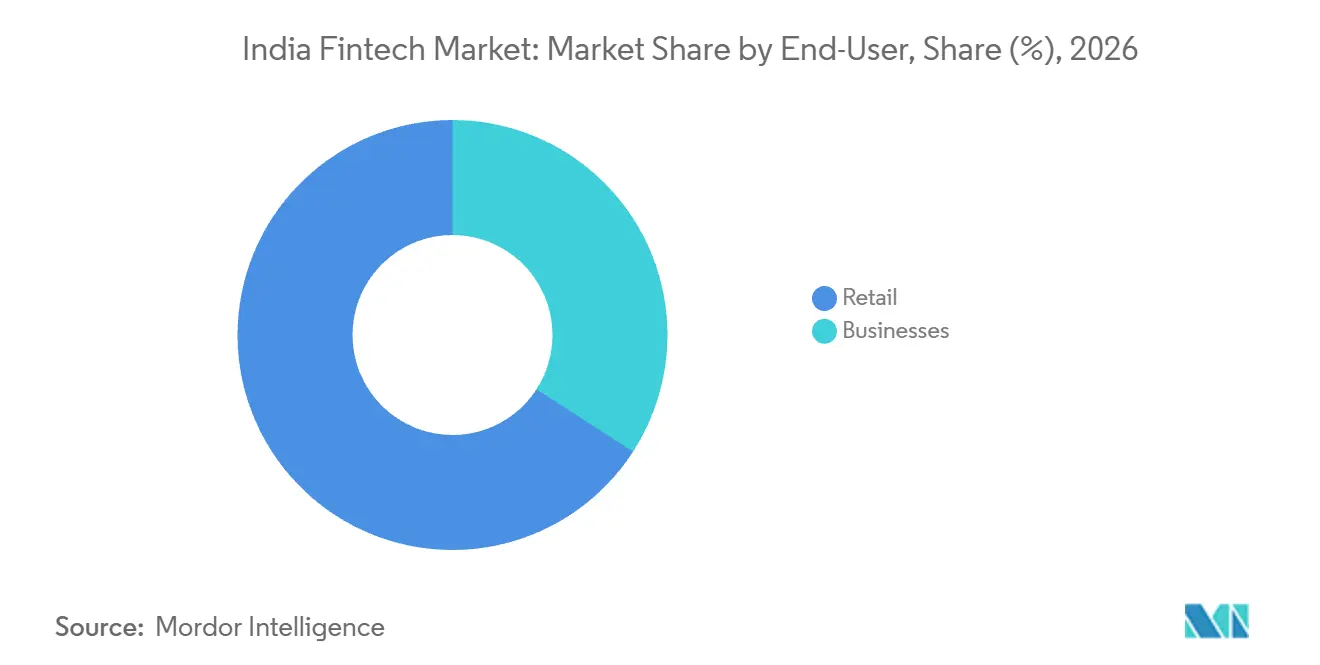
- Among end users, retail accounted for a 65.87% share of the India fintech market size in 2026, and businesses are projected to grow fastest at a CAGR of 17.65% over 2027-2032.
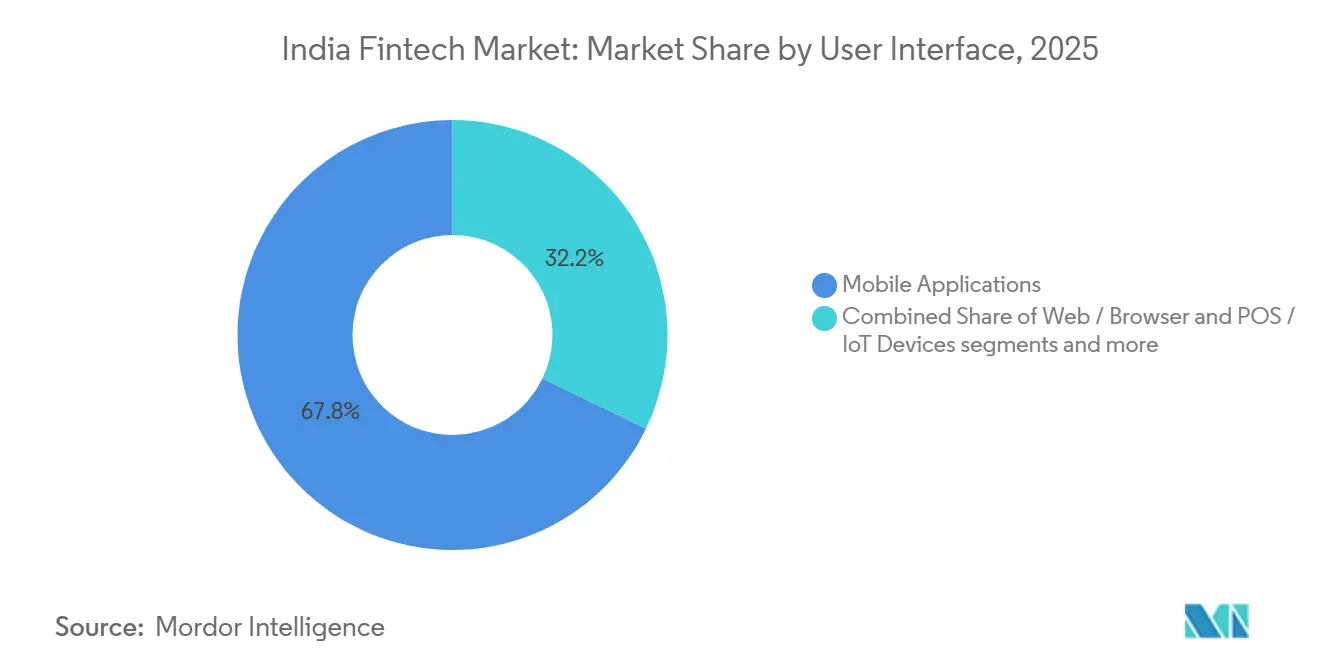
- For user interfaces, mobile applications led with a 68.99% share of the market in 2026 and are forecast to grow fastest at a CAGR of 18.45% over 2027-2032.
Note: Market numbers in this report are based on Mordor Intelligence's proprietary estimation framework, which combines nine months of actuals with Q4 projections for base year 2026.
India Fintech Market Trends and Insights
Drivers Impact Analysis*
| Driver | (~) % Impact on CAGR Forecast | Geographic Relevance | Impact Timeline |
|---|---|---|---|
| Digital Public Infrastructure (UPI, Aadhaar, OCEN) Accelerating Mass-Market Adoption | +6.5% | Nationwide | Long term (≥ 4 years) |
| Account Aggregator Framework Unlocking Data-Driven Credit Underwriting | +5% | Nationwide | Medium term (2-4 years) |
| Embedded-Finance Demand from E-commerce & Gig-Economy Platforms | +4% | Nationwide | Short term (≤ 2 years) |
| Formalization of MSMEs post-GST Creating New SME Fintech Demand Pools | +3.5% | Nationwide | Medium term (2-4 years) |
| Millennial & Gen-Z Wealth Creation Driving Low-Cost Robo-Advisory Uptake | +0.5% | Nationwide | Long term (≥ 4 years) |
| Cross-Border UPI Linkages (e.g., Singapore, UAE) Opening New Remittance Revenues | +1.5% | Nationwide | Medium term (2-4 years) |
| Source: Mordor Intelligence | |||
Digital Public Infrastructure (UPI, Aadhaar, OCEN) Accelerating Mass-Market Adoption
Digital identity and transaction-data infrastructure expand the range of financial services that can use a paperless customer journey. The Unique Identification Authority of India (UIDAI) reported 185.6 billion Aadhaar authentication transactions across all sectors in India in FY2025-26. The GST Sahay program of the Small Industries Development Bank of India (SIDBI) combined Open Credit Enablement Network (OCEN) and Account Aggregator frameworks with GST trade data and bank information for paperless invoice-based credit. Its GST Sahay portfolio grew 345% year over year in FY2025-26.[1] SIDBI added 2,261 customers during FY2025-26, taking cumulative sanctioned customers to 3,512 by March 31, 2026. Most of the sanctioned-customer base was added in FY2025-26, indicating that shared rails supported recent credit adoption beyond their role in identity verification.
Account Aggregator Framework Unlocking Data-Driven Credit Underwriting
Account Aggregator (AA) connects permissioned financial data with lenders' underwriting workflows. Sahamati and CRIF estimated that India's Account Aggregator ecosystem facilitated 36.8 million loan disbursals in FY2025-26.[2] Banks accounted for 47.3% of AA-enabled lending by value in H2 FY2025-26, with nonbank finance companies accounting for the remainder. For home loans and loans against property, predominantly AA-using lender cohorts with AA underwriting penetration above 30% recorded an outstanding-portfolio CAGR of 32.9% over June 2024-June 2026, versus 14.3% for non-AA cohorts. That activity places reusable data integration within established credit products, giving technology suppliers a role in underwriting rather than only borrower-facing interfaces.
Embedded-Finance Demand from E-commerce & Gig-Economy Platforms
Checkout credit makes financing part of the purchase decision, creating demand for services embedded within a retailer's transaction journey. Amazon reported that Amazon Pay Later's user base expanded 80% year over year during its 2026 Great Indian Festival in India. Pay Later installment transactions also doubled year over year during the event. Together, these measures show both a broader user base and increased transaction activity within that specific checkout product. For financing providers, checkout links product distribution to a purchase already under consideration, concentrating the service relationship around that transaction.
Formalization of MSMEs post-GST Creating New SME Fintech Demand Pools
Formal records for micro, small and medium enterprises (MSME) can connect business identification with financing a specific trading activity. Combined registrations under Udyam and the Udyam Assist Platform reached approximately 97.8 million as of October 6, 2026. Indian Bank's GST Sahay working-capital product, accessed through its IND SMART app, targets individual and proprietorship MSMEs registered for GST for at least 12 months. Loan assessment uses GST sales invoices no more than 45 days old. This design gives recorded sales a direct role in a digital credit journey, creating a financing application for formal business data. Udyam registration alone therefore cannot establish eligibility for this product, which requires an established GST history and recent sales invoices.
Restraints Impact Analysis*
| Restraint | (~) % Impact on CAGR Forecast | Geographic Relevance | Impact Timeline |
|---|---|---|---|
| RBI's Stricter Digital-Lending & FLDG Norms Raising Compliance Cost | -2% | Nationwide | Short term (≤ 2 years) |
| Zero-MDR Policy on RuPay Debit and Most UPI Merchant Payments Compressing Payment-Gateway Profit Pools | -1.5% | Nationwide | Long term (≥ 4 years) |
| Escalating Cyber-Fraud Incidents Undermining Consumer Trust | -0.8% | Nationwide | Short term (≤ 2 years) |
| Post-2022 Funding Winter Constraining Scale-Up Capital | -0.4% | Nationwide | Medium term (2-4 years) |
| Source: Mordor Intelligence | |||
RBI's Stricter Digital-Lending & FLDG Norms Raising Compliance Cost
Outsourcing digital lending does not remove the regulated lender's responsibility for the service delivered to borrowers. The Reserve Bank of India's NBFC Credit Facilities Directions require applicable nonbank lenders to conduct enhanced due diligence before contracting digital-lending service providers. That review covers technical capabilities, data privacy, storage systems, borrower treatment and regulatory compliance. The lender must also review provider conduct periodically and remains responsible for the provider's acts and omissions. These obligations make partner selection and ongoing oversight part of the cost of expanding digital distribution, particularly when a lender adds providers with different systems. Faster customer acquisition therefore cannot substitute for the continuing expense of supervising each contracted lending relationship.
Zero-MDR Policy on RuPay Debit and Most UPI Merchant Payments Compressing Payment-Gateway Profit Pools
India announced its select-UPI merchant-fee framework in September 2026 to support UPI's long-term sustainability while protecting individuals and small merchants. From October 15, 2026, UPI merchant payments up to INR 2,000 (USD 21.04) remain free of merchant discount rate (MDR) charges, a tier representing more than 95% of UPI merchant transaction volume. Above that threshold, the framework sets a 0.4% MDR. RuPay debit transactions also retain zero MDR under the rule effective since January 2020. In FY2025-26, MobiKwik (One MobiKwik Systems Ltd) reported that diversification, cost optimization and value-added offerings supported monetization despite zero-MDR pressure. Providers must still cover processing and service costs where transaction volume itself earns no merchant discount revenue.
*Our forecasts treat driver/restraint impacts as directional, not additive. The impact forecasts reflect baseline growth, mix effects, and variable interactions.
Segment Analysis
By Service Proposition: Payment Scale and Enterprise Banking Workflows
Digital payments accounted for a 42.69% share of the India fintech market size in 2026. UPI processed 241.6 billion transactions in FY2025-26, according to figures from the National Payments Corporation of India (NPCI) reported by the Ministry of Finance.[3] This transaction scale supports the largest segment's position by making payment execution a recurring service requirement across a substantial flow of financial activity. The competitive task is to deliver dependable payment execution while developing chargeable services around it, because high throughput alone does not secure payment-provider revenue.
Neobanking is the fastest-growing segment, with a forecast CAGR of 19.8% over 2027-2032. Open, an enterprise neobanking platform, reported connections to more than 40 Indian banks in one corporate banking workspace in 2026. For State Bank of India (SBI) business current accounts, Open Money provides real-time balance visibility, automatic statement syncing and payout initiation. SBI transactions on Open Money use non-STP mode, meaning that every payout initiated on Open Money must be authorized on SBI before it executes. A business with accounts at several banks therefore gains one view of balances and payouts, while execution on SBI accounts follows SBI's authorization step.

By End-User: Consumer Reach and Merchant Relationships
Retail represented a 65.87% India fintech market share in 2026. NPCI reported that 554.9 million users were onboarded on UPI as of June 2026, illustrating the reach of a major consumer-facing financial service. This broad entry population supports Retail's position as the largest segment, while making the depth of each customer relationship commercially significant. Reach alone does not produce revenue, so a consumer platform's return depends on the further financial services each onboarded user adopts.
Businesses are the fastest-growing segment, with a projected CAGR of 17.65% over 2027-2032. MobiKwik (One MobiKwik Systems Ltd) reported 4.9 million merchant partners across India as of March 2026, providing a concrete example of business-side platform adoption. For business customers, payment acceptance can be an entry point to financial workflows used in day-to-day operations. Razorpay said in June 2026 that Cashflow Insights and the Payout Agent were available in beta to RazorpayX Connected Banking+ users, with a few businesses already using them. Such tools extend the merchant relationship from payment acceptance to cash-flow monitoring and payout preparation.
By User Interface: App Execution and Browser Access
Mobile applications held the largest segment share at 68.99% of the market in 2026 and are the fastest-growing segment, with an 18.45% CAGR forecast over 2027-2032. The Reserve Bank of India recorded 222.7 billion transactions in its mobile app-based payments channel in FY2025-26. In FY2025-26, more than 240,000 microbanking customers digitally acknowledged loans through Ujjivan Small Finance Bank's Hello Ujjivan app. Such acknowledgment brings a lending-administration task into the mobile channel, extending the app's role across the credit relationship. The commercial opening is to deliver more of the lending relationship through the same type of mobile interface that supports substantial payment activity.
Web / browser access reaches customers through websites, with netbanking and bank-website payments forming a measured part of that activity. The Reserve Bank of India recorded 4.45 billion internet-payment transactions in FY2025-26, covering e-commerce through netbanking and financial transactions on banks' internet-banking websites. The mobile app-based channel discussed above handled about 50 times as many transactions in the same fiscal year, placing this bank-website activity well below mobile payments in volume. For providers serving these transactions, browser access therefore offers a complementary route for completing netbanking purchases and bank transfers alongside app-based payment execution.
Geography Analysis
Urban UPI transaction activity provides a basis for considering additional financial services in several named urban districts. NPCI's district-level UPI data identify concentrations of activity in Bengaluru Urban, Mumbai Suburban and Pune. A significant portion of UPI transactions lacks geographic tags, so that district pattern gives an indicative view of urban activity. In that data, Bengaluru Urban ranks first among districts by UPI transaction volume, followed by Mumbai Suburban and Pune, making these reported payment flows a potential base for distributing lending, insurance or investment services.
Smaller-center infrastructure broadens the physical acceptance footprint through which digital financial services can reach merchants and their customers. The Payments Infrastructure Development Fund recorded 15.04 million digital devices in Tier 3 and 4 centers combined as of November 30, 2025. The same deployment table recorded 2.58 million digital devices in the northeastern states as a group on that date. These installed acceptance points support transaction services across different center categories and state groups, with commercial value depending on sustained merchant relationships that convert device availability into repeated customer payment activity.
Access to a digital-payment mode and active use of a payment instrument are separate development tasks. By March 31, 2025, 514 districts across India, more than 60% of the total, had achieved RBI program coverage that provided every eligible individual with at least one digital-payment mode. The Department of Financial Services' 2026 impact analysis recommended targeted measures to strengthen RuPay debit-card usage in rural and semi-urban areas. That recommendation makes the use of an available payment instrument a distinct commercial issue alongside extending access to additional customers. For providers serving rural and semi-urban areas, the next gain comes from turning existing access into repeat RuPay debit-card use, the focus of the DFS recommendation.
Regulatory Framework and Outlook
The comparison covers selected jurisdictions from the perspective of regulated digital nonbank lenders and their loan-origination service partners. The RBI's NBFC Credit Facilities Directions, updated as of July 15, 2026, organize digital-lending requirements around service-provider arrangements, borrower protection, technology, data and reporting. The state comparison distinguishes that national origination framework from the statutory scope of borrower-collection protections, since these affect different operating decisions.
Regulatory Table
| Decision factor | India | Tamil Nadu |
|---|---|---|
| Primary authority | Reserve Bank of India | Reserve Bank of India for NBFC origination; State Government for Act 40 of 2025 |
| Key instruments or direction | NBFC Credit Facilities Directions, 2025, updated July 2026 | RBI framework; enacted Act 40 of 2025 generally excludes RBI-registered NBFCs but preserves coercive-action provisions |
| Commercial effect | Service-partner, borrower-protection, data and reporting requirements | National NBFC origination framework; state statute retains a coercive-action scope for NBFCs |
| Current policy attractiveness | Medium | Medium |
| Future direction of policy attractiveness | No change | No change |
| Source: Mordor Intelligence | ||
India's Medium rating reflects continuing service-provider and borrower-protection duties under the November 2025 consolidated Directions, updated through July 15, 2026, after the 2025 phase-in dates passed. Origination merits No change despite February 13, 2026 expected credit loss relief for qualifying default loss guarantees, conditional on Indian Accounting Standards, integration into loan terms, no separate recognition and recalculation as invocation reduces cover. Tamil Nadu's Medium rating and No change direction concern digital origination under the national framework, alongside the enacted Act's general exclusion for RBI-registered NBFCs. The Act provides for its coercive-action provisions to apply to those lenders from a commencement date appointed by State Government notification.
Value Chain Stages
The comparison follows merchant acceptance, payment execution and the financial-product services that can branch from a digital customer relationship. Paytm's card machines serve mid-sized and large offline retailers, while Policybazaar Insurance Brokers combines website-generated leads with offline policy solicitation. These roles place acceptance hardware and insurance distribution at different stages of the chain, each with its own service obligations.
Value Chain Analysis Table
| Primary activity | Key participants | Value capture | Bottleneck | Resilience response |
|---|---|---|---|---|
| Deploy merchant acceptance | Acceptance-device suppliers such as Paytm (One 97 Communications Ltd) | Card-machine subscriptions and MDR revenue | Supporting deployed equipment across retailer locations | Pair deployment with service support and subscription renewal |
| Execute payment transactions | Payment-platform operators such as Paytm (One 97 Communications Ltd) | MDR and user convenience fees where applicable | Matching processing expense to transactions eligible for fees | Track economics by payment type and applicable fee mechanism |
| Distribute and service insurance | Insurance brokers such as Policybazaar Insurance Brokers | Policy-solicitation commissions and rewards; outsourced insurer-service fees | Connecting digital leads with completed solicitation and service delivery | Link lead handling to broker execution and insurer-service operations |
| Source: Mordor Intelligence | ||||
A card-machine subscription and an insurer-service fee reward different work, separately from transaction processing. Adding either revenue stream would broaden a payment provider's work beyond transaction execution into hardware provision or services delivered for insurers. In payment execution, earnings depend on the transactions eligible for a merchant discount or convenience fee, so that stage's economics follow fee eligibility rather than payment volume.
Competitive Landscape
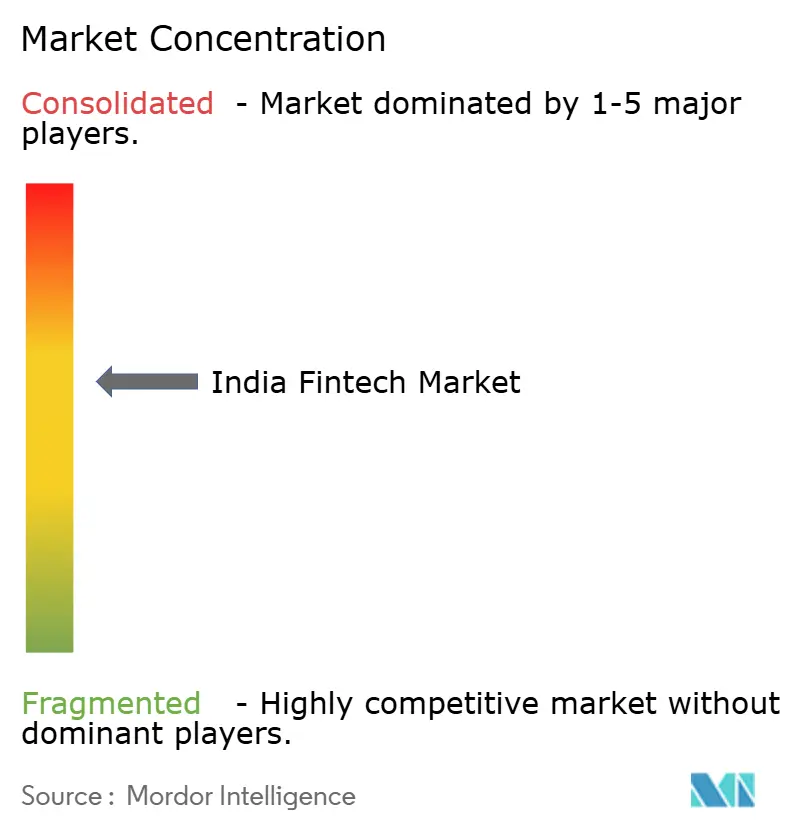
Several sizable platforms coexist with specialized merchant infrastructure providers, giving competition a mix of broad distribution and narrower operating expertise. Paytm (One 97 Communications Ltd) spans digital payments and financial services, while PhonePe Ltd offers consumer and merchant payments alongside lending and insurance distribution. Razorpay Payments Pvt Ltd operates the online and cross-border aggregation business transferred from Razorpay Software Ltd (formerly Razorpay Software Pvt Ltd) effective January 1, 2026. Pine Labs Ltd provides payments and commerce infrastructure, and PayU Payments Pvt Ltd operates in online payment aggregation. A merchant payment connection and a broader financial distribution platform create different service relationships and integration requirements.
Pine Labs completed its acquisition of 100% of Shopflo Technologies on June 10, 2026, adding direct-to-consumer checkout technology and e-commerce enablement services to its merchant payments business. Pine Labs said at its April 25, 2026, announcement that Shopflo's checkout platform served more than 1,000 e-commerce brands and powered experiences for more than 60 million consumers. The acquisition therefore adds an established brand-facing checkout relationship to Pine Labs' payment-acceptance offering. For payment-only providers, competition for these retailers can include the checkout layer, increasing the range of merchant workflows a rival can address.
Payment aggregator authorizations determine which channels a provider can serve for merchants. PayU Payments Pvt Ltd received final RBI authorization to operate as an online payment aggregator in May 2025. The RBI granted Paytm Payments Services Limited, a wholly owned subsidiary of One 97 Communications Limited, a certificate to operate as a payment aggregator on November 26, 2025. Razorpay announced on December 2, 2025, that it had secured the RBI Payment Aggregator-Cross-Border license, and Razorpay POS announced the Payment Aggregator-Physical license on January 22, 2026. For a merchant selling online and in stores, provider selection therefore turns partly on whether its authorizations cover the channels through which customers pay.
India Fintech Industry Leaders
-
Paytm (One 97 Communications Ltd)
-
PhonePe Ltd
-
Razorpay Software Ltd
-
Pine Labs Ltd
-
PayU Payments Pvt Ltd
- *Disclaimer: Major Players sorted in no particular order
Key Opportunities for Market Participants
The comparison considers digital-credit opportunities for micro and small enterprises and for retail borrowers, distinguishing lender origination from data integration. Credit Guarantee Fund Trust for Micro and Small Enterprises (CGTMSE) increased the credit-guarantee coverage ceiling for micro and small enterprises effective April 1, 2025, through a circular to banks and select financial institutions. The Ministry of MSME confirmed in July 2026 that the revision applies to guarantees approved on or after that date. Separately, lending enabled by the Account Aggregator (AA) framework accounted for 11.8% of retail and MSME lending by volume in FY2025-26, establishing an operating channel around which specialized credit services can develop.
Market Opportunities Table
| Opportunity | Why now | Buyer / lead segment | Recommended play | Main barrier | Likely beneficiaries |
|---|---|---|---|---|---|
| Guarantee-linked digital enterprise credit | Implemented increase in the MSE guarantee ceiling | Micro and small enterprises served by eligible lenders | Connect digital origination to participating lenders' guarantee workflows | Integrating borrower assessment with bank-partner processes | Participating banks and select financial institutions |
| MSME underwriting integration | AA-enabled lending provides an operating retail and MSME channel | MSME lenders and their business borrowers | Connect financial-data access with business credit assessment | Fitting shared data into each lender's credit decisions | Lenders using the AA ecosystem and their technology partners |
| Retail credit-assessment services | The established AA lending channel also serves retail credit | Retail lenders and individual borrowers | Embed financial-information review within the loan application | Completing data access and assessment within the borrower journey | Retail lenders using the AA ecosystem and integration providers |
| Source: Mordor Intelligence | |||||
Public-sector banks sanctioned over 396,000 MSME loan applications from April through December 2025 under digital credit underwriting programs that used Account Aggregator bank-statement analysis among several inputs. The same model also uses GST data analysis, tax return verification and credit information company data to run automated appraisal journeys. For banks using data-based appraisal, integrating guarantee-eligibility checks for micro and small enterprises would connect credit assessment and guarantee processing within the same borrower workflow.
Recent Industry Developments
- Oct 2026: PhonePe announced the evolution of Share.Market into PhonePe Invest and launched a Portfolio Optimiser to help new-to-market investors build, review and optimize portfolios through research insights.
- Sep 2026: PhonePe planned more than 20,000 frontline sales hires and over 5 million payment-device deployments in the following 12 months, including SmartSpeakers and POS devices, with approximately half targeted at rural India.
- Jun 2026: Pine Labs completed its acquisition of 100% of Shopflo Technologies Private Limited, adding a direct-to-consumer checkout platform and e-commerce enablement services to its merchant payments business.
Research Methodology Framework and Report Scope
Market Definition and Coverage
The India fintech market measures annual provider revenue from digital-first financial products and services delivered in India through mobile applications, web or browser interfaces, and POS or IoT devices. These services are sold to retail customers and businesses.
Scope exclusions: Generic IT services, core banking implementation projects, and back-office enterprise software that does not directly enable a financial product or customer transaction are excluded.
Segmentation Overview
- By Service Proposition
- Digital Payments
- Digital Lending and Financing
- Digital Investments
- Insurtech
- Neobanking
- By End-User
- Retail
- Businesses
- By User Interface
- Mobile Applications
- Web / Browser
- POS / IoT Devices
Data Sources, Market Sizing, and Validation
Desk Research
The Reserve Bank of India's annual reporting and regulatory publications, SIDBI's annual report, government releases carried by the Press Information Bureau, and Indian payment-system statistics provide examples of sources for tracking regulation, credit programs, digital-payment activity, and financial-service adoption. These materials help analysts distinguish market drivers and operating indicators from provider revenue, which remains the measure used in the market estimate.
Company annual reports, investor presentations, regulatory filings and reputable Indian business press can supplement those public sources by clarifying product activity, revenue recognition, partnerships and material changes in providers' business mix. The named sources are illustrative and not exhaustive, and further sources inform collection, validation and clarification.
Primary Interviews and Surveys
Interviews and structured questionnaires would target India-based fintech executives, payments, lending, investment, insurtech and neobanking product leaders, and managers responsible for revenue, risk or distribution. Respondents would help test secondary-source interpretations, explain differences in revenue recognition and identify gaps in proposition coverage. Analysts would compare those explanations with company disclosures and independent market indicators, then seek clarification where material estimates or definitions remain inconsistent.
Distribution of primary research fieldwork respondents
| Company type | Respondent position | Region |
|---|---|---|
| Top tier: 31% | CXOs: 20% | |
| Mid tier: 45% | Functional/Unit leaders: 35% | |
| Smaller Players: 24% | Managers: 45% |
Market-Sizing & Forecasting
The model estimates annual revenue earned by providers from the defined digital-first services in India, then separates the total by service proposition, end user and interface. Analysts would build a top-down revenue estimate from disclosed financial results and service-level evidence, using UPI transaction activity and digital-payment indicators to assess payment adoption, digital lending and Account Aggregator activity to gauge credit reach, digital investment participation and insurtech distribution activity to assess adjacent propositions, and provider disclosures to distinguish recurring fees, commissions and interest revenue from customer funds or transaction principal. Evidence on customers served, product mix, revenue sources and delivery channels would inform segment shares, with each revenue item assigned once across the 3 classification axes. Forecasts would use scenario analysis informed by historical growth, digital adoption, regulatory changes and proposition-specific monetization. Sampled provider roll-ups and channel checks would serve as selective bottom-up checks, while gaps would be recorded and bounded with disclosed financials and relevant operating indicators. Primary respondents would be asked to check the direction and practical drivers of variable-level forecasts, and analysts would reconcile differences against independent evidence before using them.
Data Validation & Update Cycle
Analysts would triangulate provider disclosures, official payment and regulatory indicators, and proposition-level evidence, checking independent signals for consistency with the revenue estimate and segment shares. Variances, outliers, unit mismatches and shifts in accounting or product mix would be investigated, documented and reviewed through analyst checks before sign-off. Re-contact would be triggered when a material gap, unclear revenue attribution or contradictory respondent explanation could change the estimate. The model would be refreshed annually, reviewed between cycles after material regulatory or market events, and given a fresh pre-delivery review.
Mordor Intelligence's India Fintech Market Size Measured Against Other Published Estimates
Published estimates can differ in the transactions and products they count and the inputs used to model demand. The India fintech market measures annual provider revenue from digital-first financial products and services delivered in India through mobile applications, web or browser interfaces, and POS or IoT devices.
Key Gap Drivers include the study's defined coverage and market-specific modeling choices. Analysts would build a top-down revenue estimate from disclosed financial results and service-level evidence, using UPI transaction activity and digital-payment indicators to assess payment adoption, digital lending and Account Aggregator activity to gauge credit reach, digital investment participation and insurtech distribution activity to assess adjacent propositions, and provider disclosures to distinguish recurring fees, commissions and interest revenue from customer funds or transaction principal.
Benchmark comparison
| Source | Market Size | Gaps in Research Methodology |
|---|---|---|
| Mordor Intelligence | USD 59.65 B (2027) | |
| Global Consultancy A | USD 44.1 B (2025) | At its 2025 base, this estimate is 26.1% below this report's 2027 value of USD 59.65 B, 2 years later. |
| Global Consultancy B | USD 147.6 B (2027) | At its 2027 base, this estimate is 147.4% above this report's 2027 value of USD 59.65 B. |
Mordor Intelligence's analysts would triangulate provider disclosures, official payment and regulatory indicators, and proposition-level evidence, checking independent signals for consistency with the revenue estimate and segment shares.
Key Questions Answered in the Report
What is the India fintech market size and growth outlook?
The size is expected to rise from USD 51.3 billion in 2026 to USD 59.65 billion in 2027 and USD 127.6 billion by 2032, with a CAGR of 16.42% over 2027-2032.
What is driving demand for digital financial services in India?
Shared infrastructure and embedded credit support adoption. SIDBI's GST Sahay portfolio grew 345% year over year in FY2025-26.
Which service proposition leads India's fintech sector?
Digital payments held the largest share at 42.69% in 2026, while neobanking is forecast to grow fastest at a CAGR of 19.8% over 2027-2032.
Which companies compete in India's digital financial-services industry?
Major participants include Paytm, PhonePe, Razorpay Payments, Pine Labs and PayU Payments.
What limits payment-provider monetization in India?
UPI merchant payments up to INR 2,000 (USD 21.04) remain MDR-free under the framework effective October 15, 2026, with that tier representing more than 95% of UPI merchant transaction volume.
How do fintech opportunities differ across Indian locations?
Bengaluru Urban, Mumbai Suburban and Pune led incompletely geotagged NPCI district UPI volumes, suggesting payment-linked service opportunities. Tier 3 and 4 centers combined had 15.04 million Payments Infrastructure Development Fund digital devices as of November 30, 2025.