
Financial Services and Investment Intelligence
29th JulyWealth Management Intelligence for the Middle East
4 Min Read
The RegTech Market is Segmented by Component (Solutions and Services), by Application (Compliance Management, Regulatory Intelligence and Reporting, and More), by End User (Large Enterprises, Small and Medium-Sized Enterprises, and Individuals), by Sector (ICT, Financial Services, Healthcare, and More), and by Region (North America, Europe, and More). The Market Forecasts are Provided in Terms of Value (USD).
Market Overview
| Study Period | 2019 - 2030 |
|---|---|
| Market Size (2025) | USD 20.67 Billion |
| Market Size (2030) | USD 44.11 Billion |
| Growth Rate (2025 - 2030) | 16.37 % CAGR |
| Fastest Growing Market | Asia-Pacific |
| Largest Market | North America |
| Market Concentration | Medium |
Major Players *Disclaimer: Major Players sorted in no particular order. Image © Mordor Intelligence. Reuse requires attribution under CC BY 4.0. |
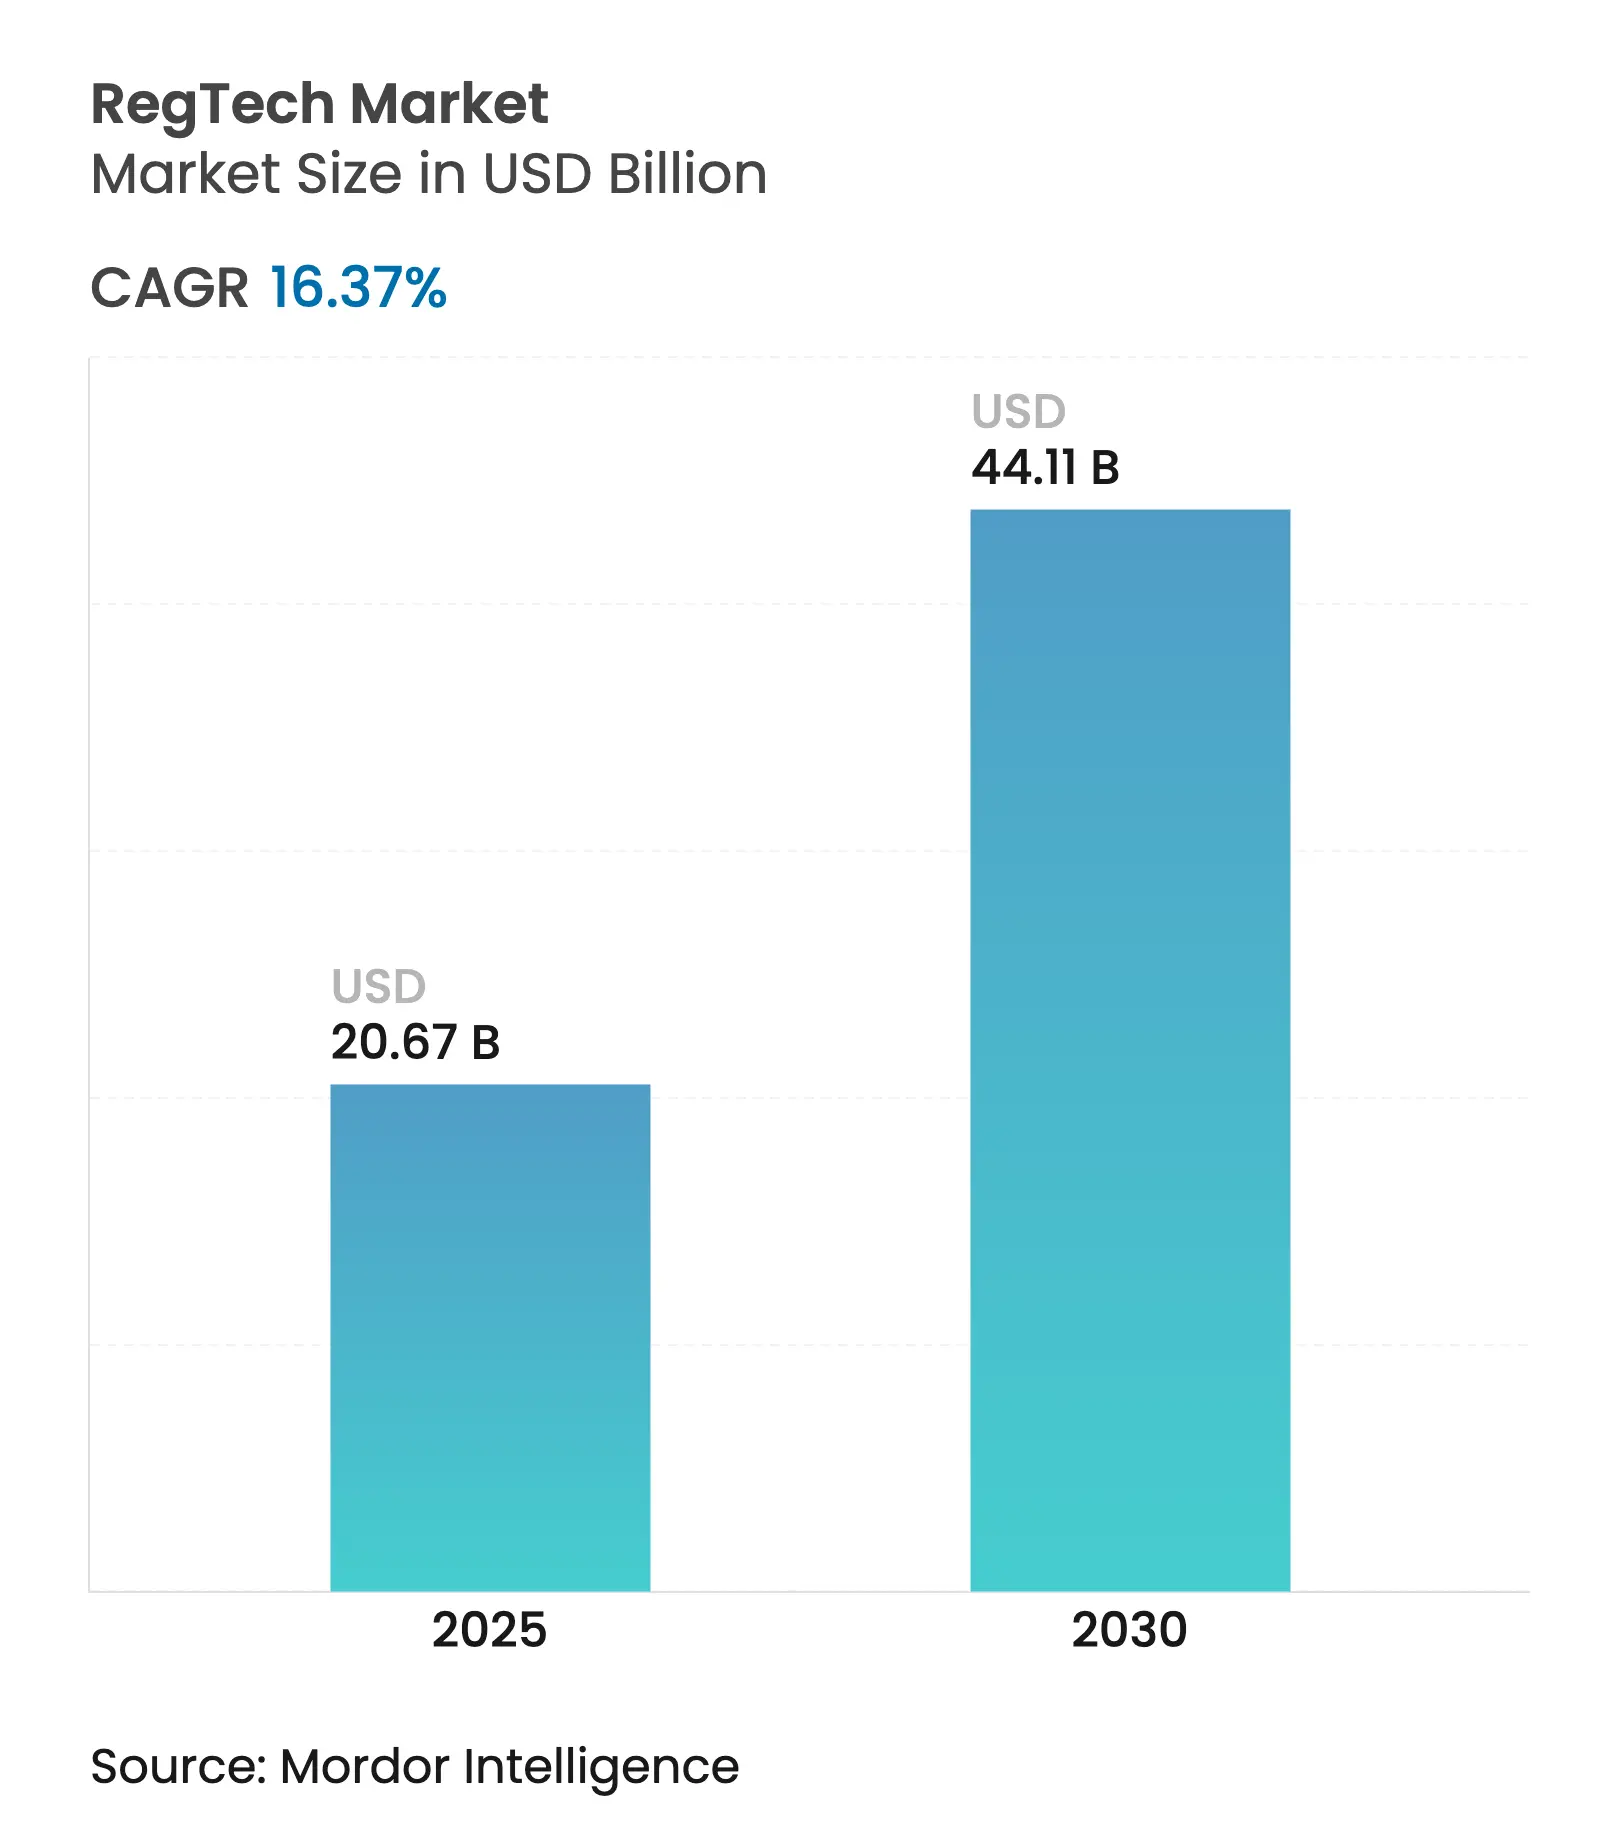
The RegTech market is valued at USD 20.67 billion in 2025 and is on course to reach USD 44.11 billion by 2030, advancing at a 16.37% CAGR. Sustained growth reflects the shift from basic rules-based compliance engines to AI-enabled, quantum-safe platforms that interpret dynamic regulations in real time. Escalating enforcement—95% of 2024’s USD 4.6 billion global fines originated in North America—pushes financial institutions toward proactive solutions that cut false positives while shrinking manual workloads[1]Fenergo, “Financial Crime Report 2025,” fenergo.com. Convergence of governance, risk, and compliance with ESG reporting, together with the EU Digital Operational Resilience Act taking effect in January 2025, further propels demand for integrated toolsets. Rapid regional uptake, notably in Asia-Pacific, where fines rose 266% in 2024, underscores the appeal of cloud-native, managed offerings over on-premise systems. Ongoing pilots of quantum-safe cryptography by global banks signal a new compliance frontier that favors vendors able to orchestrate cryptographic transitions.
Key Report Takeaways
Drivers Impact Analysis
| Driver | (~) % Impact on CAGR Forecast | Geographic Relevance | Impact Timeline | |||
|---|---|---|---|---|---|---|
Heightened global AML/KYC enforcement
Heightened global AML/KYC enforcement
| +3.2% | Global, North America leading | Short term (≤ 2 years) |
(~) % Impact on CAGR Forecast
:
+3.2%
|
Geographic Relevance
:
Global, North America leading
|
Impact Timeline
:
Short term (≤ 2 years)
|
RegTech mandates in digital-asset markets
RegTech mandates in digital-asset markets
| +2.8% | EU, North America, Asia-Pacific | Medium term (2-4 years) | |||
Convergence of GRC & ESG platforms
Convergence of GRC & ESG platforms
| +2.1% | EU primary, North America secondary | Medium term (2-4 years) | |||
AI-driven cost-to-comply reduction
AI-driven cost-to-comply reduction
| +4.3% | Global | Short term (≤ 2 years) | |||
Quantum-safe cryptography requirements
Quantum-safe cryptography requirements
| +1.9% | North America & EU, spill-over to APAC | Long term (≥ 4 years) | |||
Privacy-enhancing computation adoption
Privacy-enhancing computation adoption
| +1.4% | Global, EU leadership | Medium term (2-4 years) | |||
| Source: Mordor Intelligence | ||||||
Heightened Global AML/KYC Enforcement
Regulators levied USD 263 million in AML penalties in H1 2024 alone, a 31% surge year-on-year, with Asia-Pacific fines jumping 266% and a single enforcement action topping USD 65 million. Banks in the United States and Canada now spend USD 61 billion annually on compliance, 99% of which report rising costs. Institutions shift from retroactive remediation to predictive analytics, adopting AI-driven monitoring that ingests vast data streams and suppresses false alerts, thereby reducing manual case reviews and accelerating suspicious-activity reporting.
Escalating RegTech Adoption Mandates in Digital-Asset Markets
Europe’s MiCA regime became fully operational in January 2025, imposing licensing, capital, and disclosure rules[2]EUR-Lex, “Markets in Crypto-Assets Regulation,” eur-lex.europa.eu. Parallel U.S. executive orders from the March 2025 Crypto Summit authorized national-bank custody of digital assets and established a Strategic Bitcoin Reserve. California’s Digital Financial Assets Law, effective July 2025, layers state oversight atop federal guidance. Standardized templates for crypto-asset white papers—effective December 2025—further formalize reporting requirements. Collectively, these measures fuel demand for automated surveillance and real-time reporting platforms purpose-built for digital-asset compliance.
Convergence of GRC & ESG Reporting Platforms
The EU Corporate Sustainability Reporting Directive, effective in 2024, compels large corporates to disclose ESG metrics. MetricStream’s 2025 study urges firms to turn compliance into a strategic advantage. Unified platforms that meld financial and non-financial obligations break down data silos, streamline evidence gathering and enable simultaneous reporting to multiple authorities—positioning vendors that deliver holistic solutions for outsized growth.
AI-Driven Cost-to-Comply Reduction Imperatives
Analysts at Ernst & Young estimate that AI can trim false positives while bolstering data quality and risk responsiveness. Two-thirds of firms already deploy generative AI, projecting transformational impact within two years[3]The RegTech Association, “2024 Industry Report,” regtech.org.au. IBM’s WatsonX maps obligations to governance controls, continuously scanning regulatory amendments and highlighting gaps. These capabilities re-allocate human effort from rule coding to strategic oversight and accelerate policy updates across global operations.
Restraints Impact Analysis
| Restraint | (~) % Impact on CAGR Forecast | Geographic Relevance | Impact Timeline | |||
|---|---|---|---|---|---|---|
Fragmented regulatory taxonomies across
jurisdictions
Fragmented regulatory taxonomies across
jurisdictions
| -2.1% | Global, particularly cross-border operations | Medium term (2-4 years) |
(~) % Impact on CAGR Forecast
:
-2.1%
|
Geographic Relevance
:
Global, particularly cross-border
operations
|
Impact Timeline
:
Medium term (2-4 years)
|
Vendor accreditation bottlenecks at
Tier-1 banks
Vendor accreditation bottlenecks at
Tier-1 banks
| -1.8% | North America & EU primary | Short term (≤ 2 years) | |||
Scarcity of labelled compliance data for
model training
Scarcity of labelled compliance data for
model training
| -1.4% | Global, with APAC facing acute shortages | Short term (≤ 2 years) | |||
Rising "reg-tech debt" from
legacy GRC platforms
Rising "reg-tech debt" from
legacy GRC platforms
| -1.6% | North America & EU, spill-over to APAC | Medium term (2-4 years) | |||
| Source: Mordor Intelligence | ||||||
Fragmented Regulatory Taxonomies Across Jurisdictions
Multinationals confront divergent classifications for crypto assets, data privacy, and cybersecurity, averaging 234 regulatory events per day in 2025. Differences between MiCA and U.S. rules oblige firms to run parallel workflows. Customizing software for each jurisdiction inflates costs, dilutes ROI, and slows deployment, limiting the immediate scalability of even the most advanced RegTech market offerings.
Vendor Accreditation Bottlenecks at Tier-1 Banks
Average RegTech deployments take 8.1 months, yet tier-1 banks layer additional penetration tests, model-risk validations, and board approvals. Around 90% of sponsor banks struggle to supervise fintech partners, exposing misaligned policies[4]Wolters Kluwer, “Fintech Partnership Oversight Challenges,” wolterskluwer.com. Extended procurement cycles stretch startup resources, inhibiting rapid innovation diffusion and delaying the benefits of cutting-edge RegTech market solutions.
By Component: Services Accelerate Despite Solutions Dominance
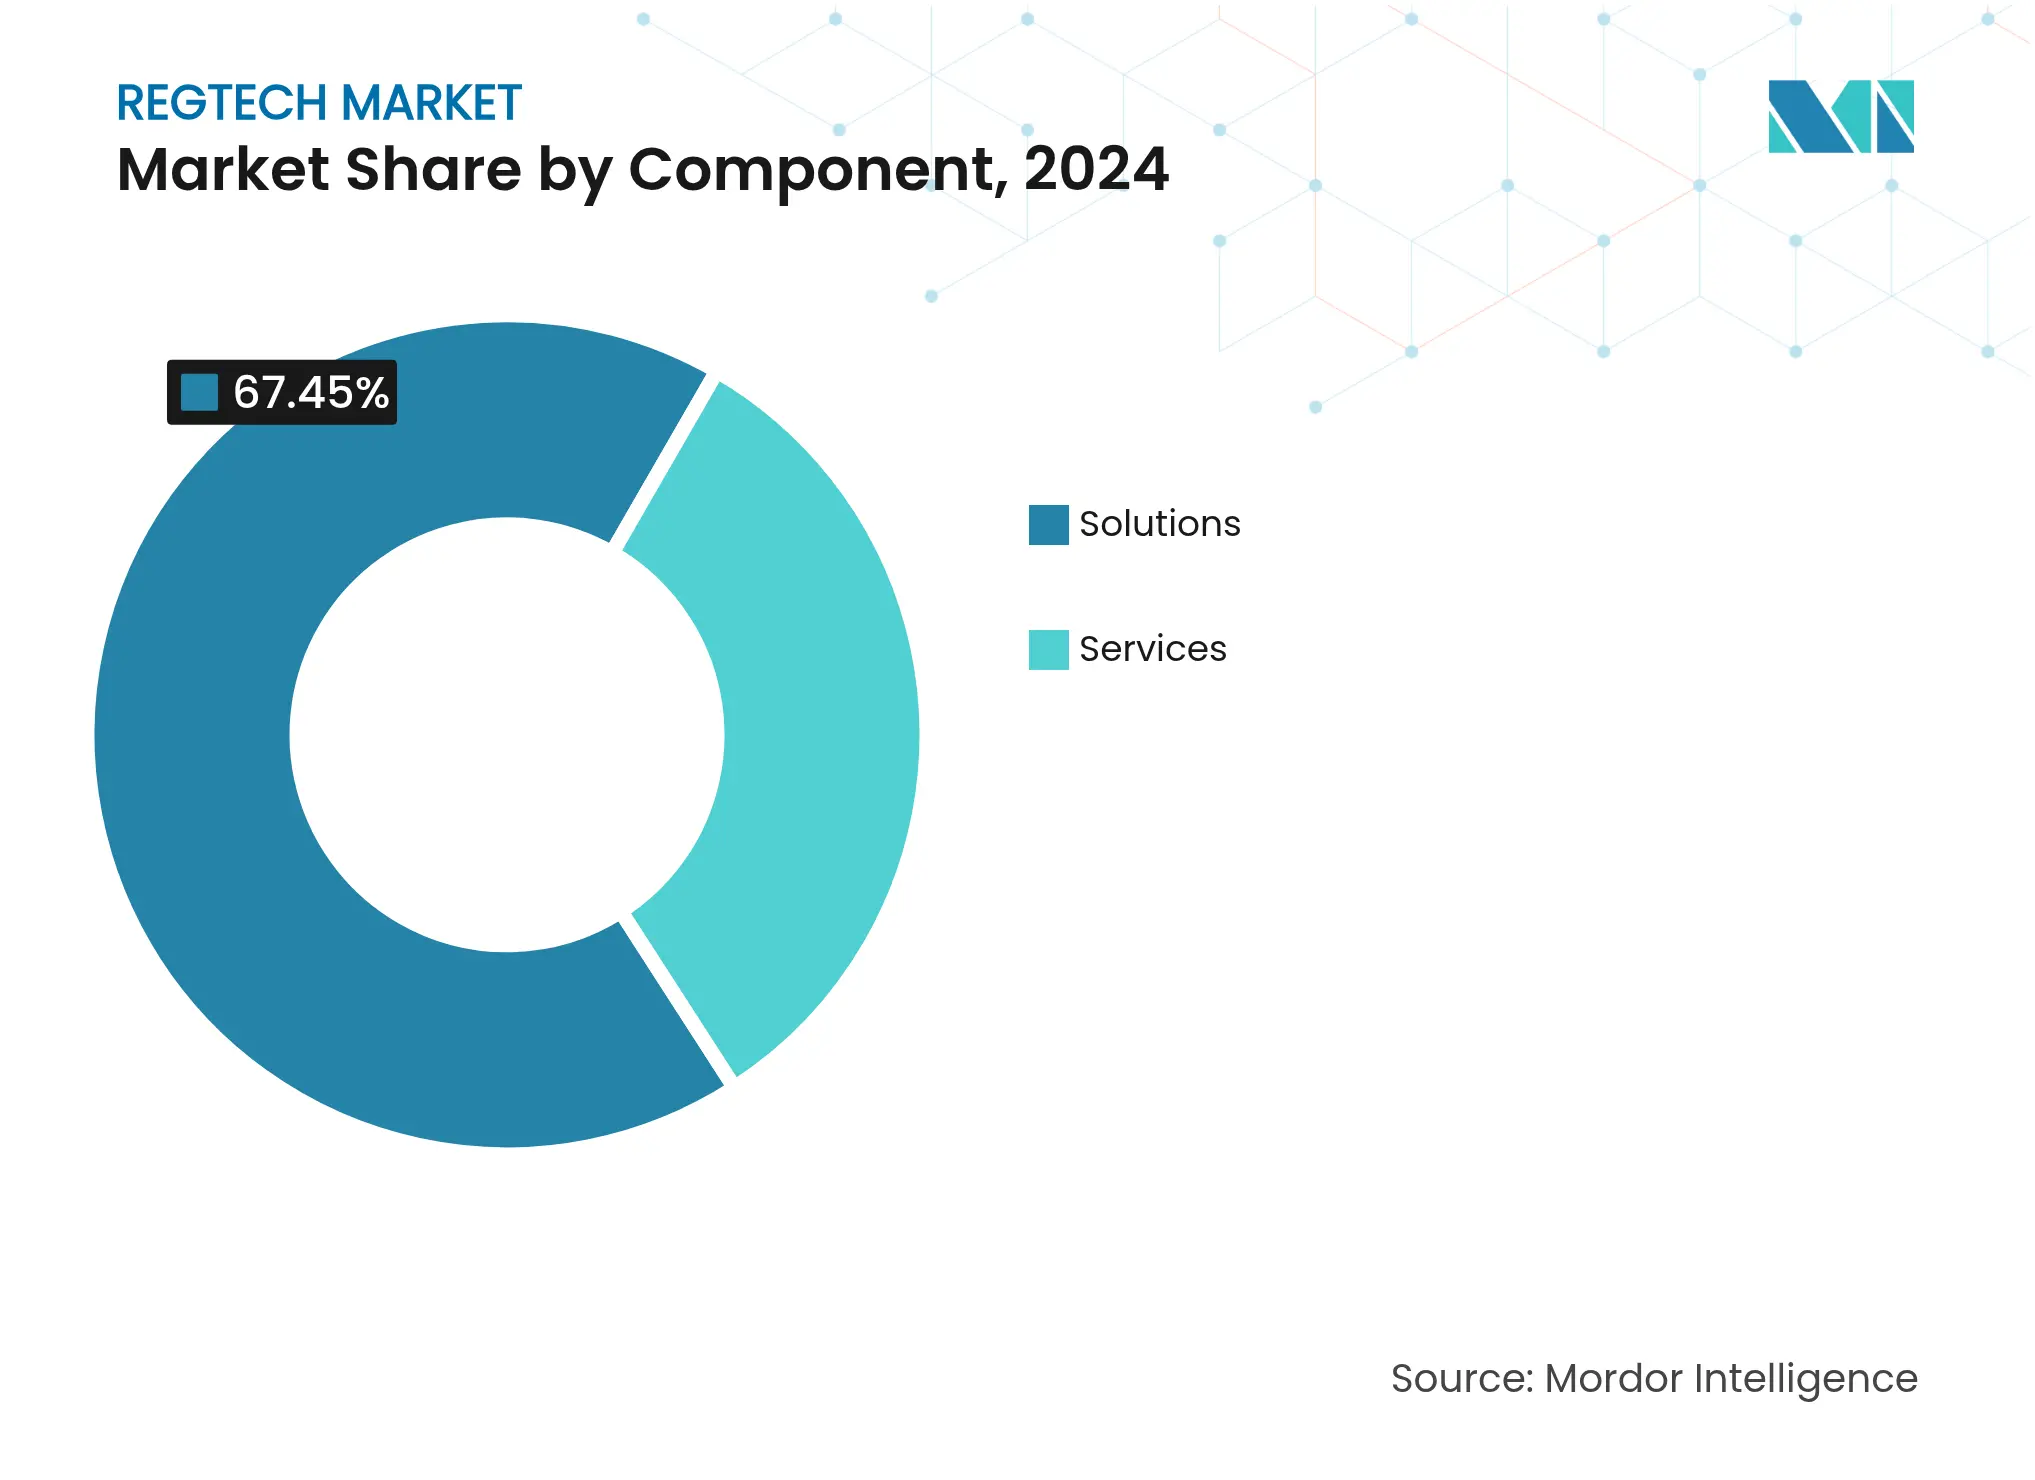
Solutions retained a 67.45% RegTech market share in 2024 as banks relied on established rule engines and case-management software. Growth moderates, however, as buyers gravitate toward outcome-based engagements. Services are set to climb at an 18.56% CAGR through 2030, led by managed client lifecycle and KYC outsourcing. Vistra’s June 2024 tie-up with Fenergo illustrates the pivot to SaaS-delivered expertise that scales across 200,000 corporate entities. Vendors blending license fees with advisory packages position themselves to capture a growing slice of the RegTech market size gains in the forecast period.
Demand for specialized know-how—spanning quantum-safe migration and cross-border ESG audits—puts service providers at the center of complex transformation roadmaps. By absorbing regulatory updates centrally and disseminating best practices, they mitigate talent shortages and fast-track compliance modernization for mid-tier institutions.
By Application: Fraud Management Outpaces Traditional Compliance
Compliance Management logged a 27.78% share of the RegTech market size in 2024, cementing its role as table stakes for regulated entities. Yet Fraud Management is projected to soar at a 20.19% CAGR, propelled by synthetic-ID abuse and AI-generated mule activity. Real-time analytics and pattern recognition outstrip legacy rules engines, prompting institutions to upgrade transaction-monitoring stacks.
Regulatory Intelligence suites automate horizon scanning and impact assessments, as showcased by 4CRisk’s workflow engine. Identity Management adopts behavioral biometrics to counter deep-fake account openings, while Risk Management embeds quantum-safe libraries to safeguard long-retention data sets. Integrated platforms stitching these functions into a single dashboard are gaining traction, offering one-click reporting across multiple regulators and boosting the overall appeal of the RegTech market.
By End User: Individual Adoption Transforms Market Dynamics
Large Enterprises accounted for 58.37% of the RegTech market share in 2024, exploiting sizeable budgets to overhaul siloed compliance architectures. The Individuals segment, however, is forecasted to compound at 23.67% annually, underscoring the democratization trend. Retail crypto investors now face personal reporting obligations under MiCA and California’s new law. Lightweight apps that auto-populate tax forms and flag suspicious wallet activity resonate with gig-economy traders.
Small and Medium Enterprises tap cloud subscriptions for instant onboarding checks and cross-border VAT compliance without hiring dedicated staff. Heightened KYC scrutiny by the UK FCA prompts consumers to adopt personal identity wallets that synchronize with merchant systems. User-centric design and multilingual support thus represent fresh battlegrounds for RegTech market innovators.
By Sector: Healthcare Emerges as Regulatory Technology Frontier
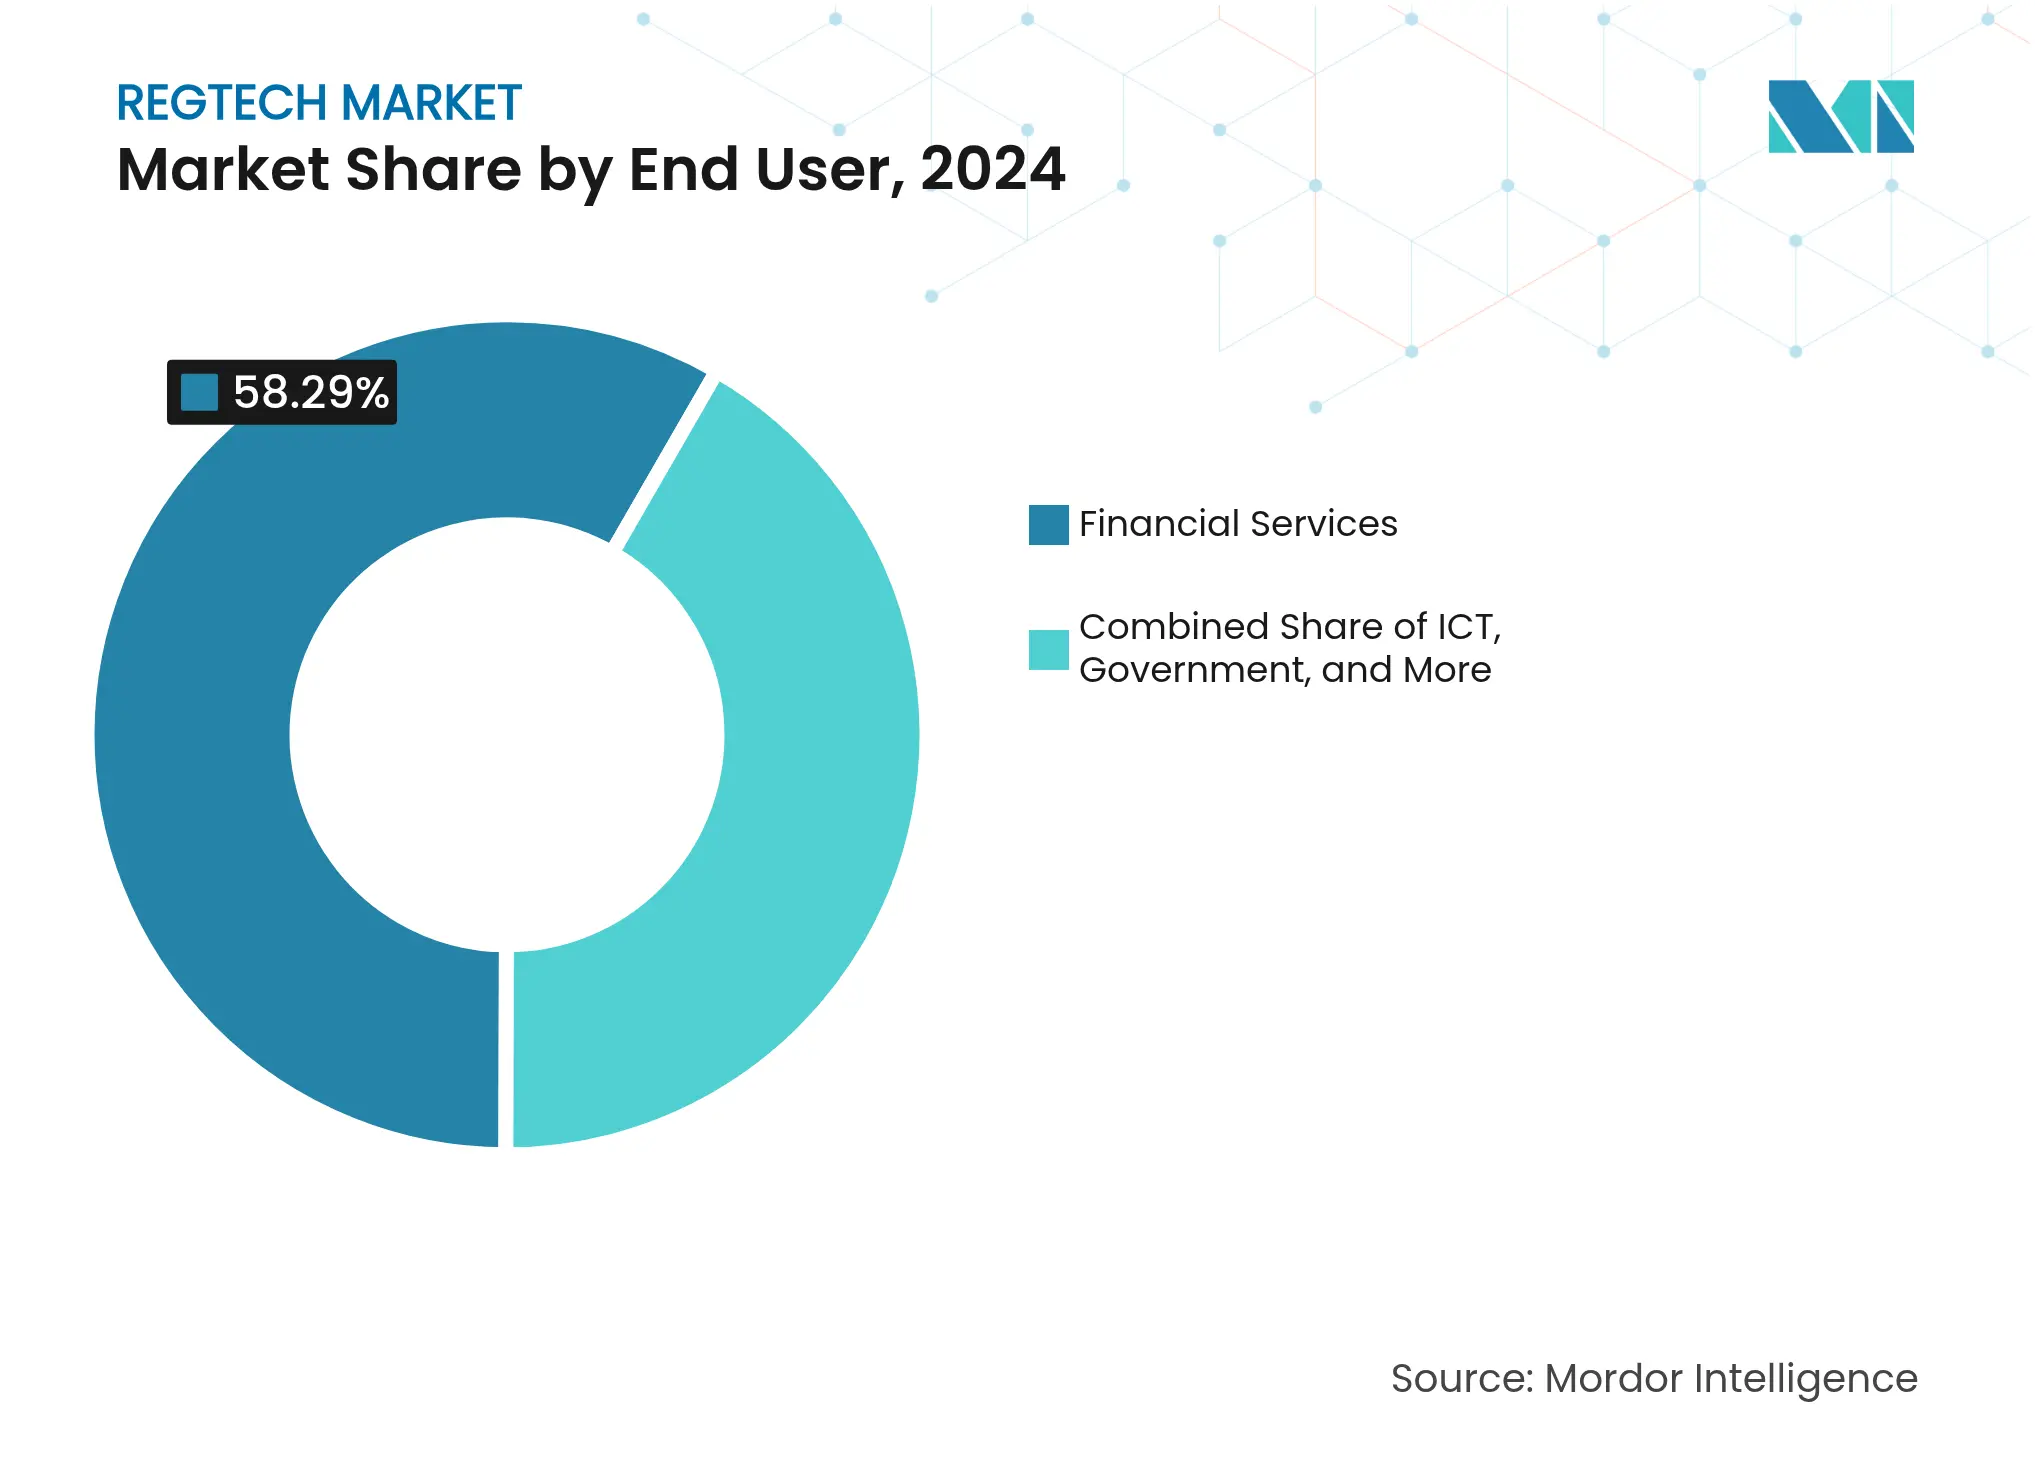
Financial Services led the RegTech market in 2024 with 58.29% share, reflecting long-standing AML and Basel mandates. Healthcare, projected to grow 19.34% per year, comes under the spotlight as FDA guidance governs AI-enabled medical devices. Predetermined Change Control Plans streamline post-market algorithm updates, provided manufacturers furnish audit trails.
Insurance regulators in the Philippines recently advocated privacy-enhancing technologies for claims analytics. Energy & Utilities adopt ESG trackers to log Scope 2 emissions, while transportation firms deploy automated incident-reporting modules. The cross-sector spread widens the total addressable RegTech market, rewarding suppliers that tailor taxonomies and control libraries beyond finance.
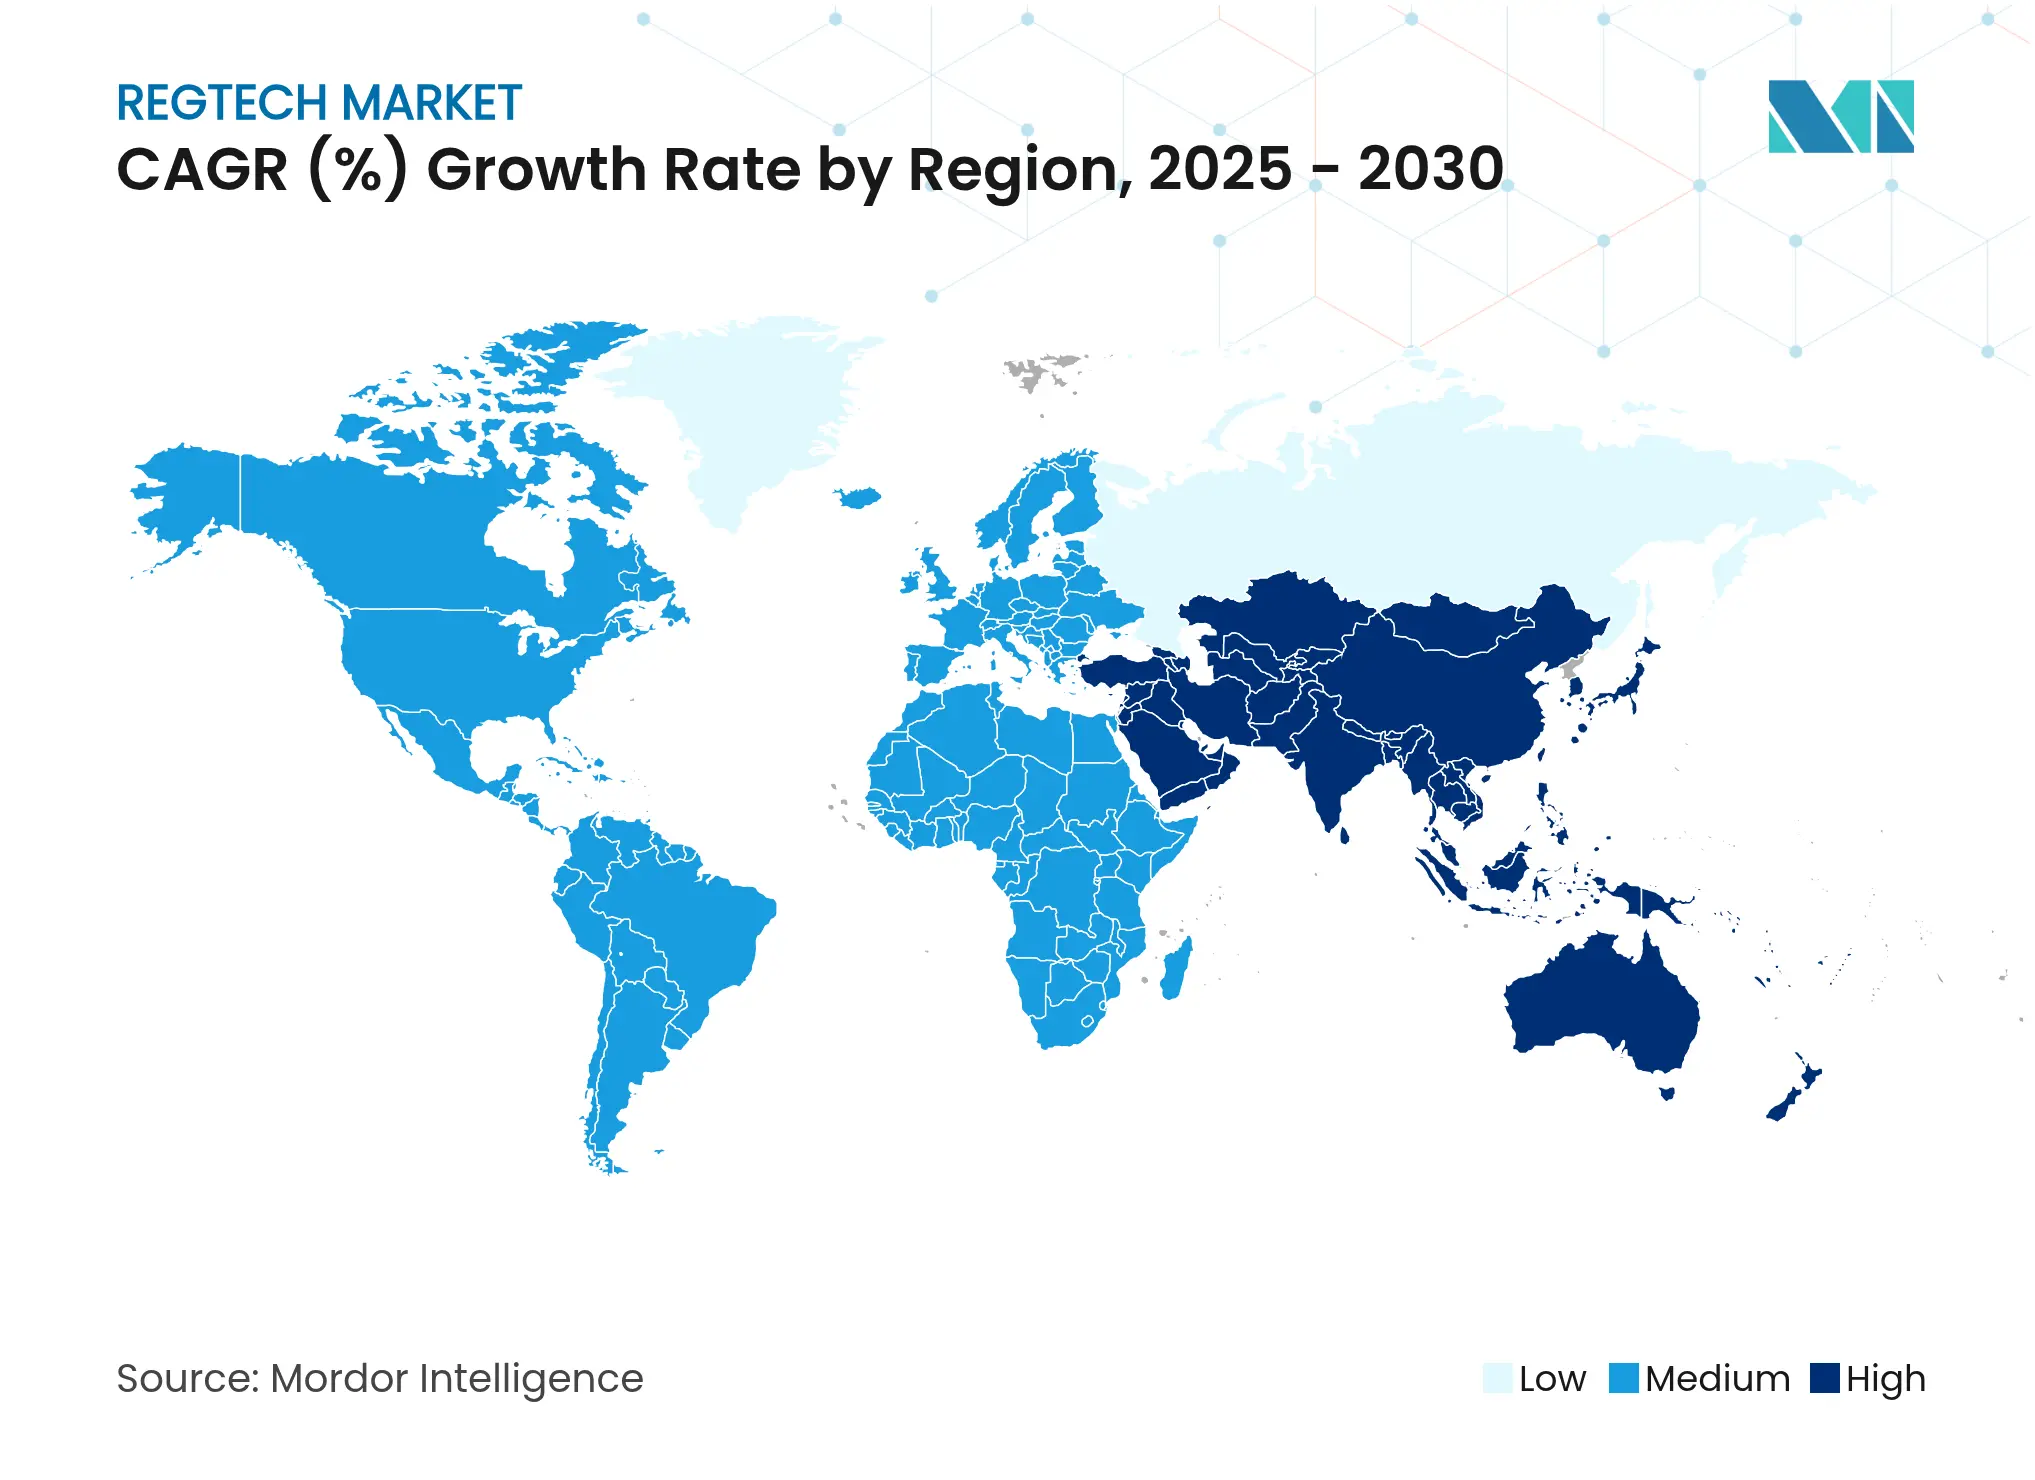
North America held 38.64% of the RegTech market size in 2024, amid USD 4.3 billion in fines and USD 61 billion yearly compliance spend. Early endorsement of post-quantum standards by NIST empowers local banks to pilot quantum-secure channels ahead of global peers, cementing regional leadership.
Asia-Pacific is forecasted to log a 20.77% CAGR through 2030, buoyed by Singapore’s 22% fine escalation in 2024 and sandbox incentives for RegTech experimentation. Japan’s FSA pushes crowdfunding oversight revisions, while Australia’s Financial Accountability Regime heightens board liability. Vendors able to harmonize multi-jurisdiction workflows will unlock disproportionate RegTech market growth across this fragmented region.
Europe pioneers rule-making in crypto assets, digital resilience, and privacy. MiCA’s phased rollout grants providers until July 2026 to comply, sparking a wave of XBRL-ready disclosures. Cross-border data-sharing accords such as the Atlantic Declaration foster privacy-enhancing computation pilots. Meanwhile, Middle East & Africa leverage financial-inclusion drives to adopt lightweight e-KYC, and South America accelerates adoption through regional harmonization efforts—both presenting greenfield opportunities for nimble RegTech market entrants.
Market Concentration
The field remains moderately fragmented: tech majors extend portfolios via acquisition while AI-native challengers win niche mandates. CUBE’s December 2024 purchase of Thomson Reuters’ regulatory intelligence arm grew its client base to roughly 1,000 and staff to 600, fusing deep content with machine reasoning. IBM pairs WatsonX analytics with sovereign cloud regions purpose-built for EU DORA compliance. Deloitte and PwC wrap advisory layers around third-party platforms, monetizing integration and change-management expertise.
Start-ups such as Hawk: AI and Lucinity exploit explainable AI to slash review queues, often integrating via API marketplaces to side-step lengthier vendor-risk questionnaires. White-space persists in quantum-safe orchestration, personal compliance apps, and healthcare-grade control libraries—segments where first movers can achieve premium pricing before incumbents scale equivalents.

*Disclaimer: Major Players sorted in no particular order
1. Introduction
2. Research Methodology
3. Executive Summary
4. Market Landscape
5. Market Size & Growth Forecasts (Value)
6. Competitive Landscape
7. Market Opportunities & Future Outlook
Market Definitions and Key Coverage
Our study frames the RegTech market as the worldwide revenue generated by software platforms and allied implementation services that automate regulatory monitoring, compliance reporting, identity verification, risk analytics, and anti-money-laundering controls for financial institutions and other highly regulated sectors (healthcare, energy, gambling, and crypto among others). Activities geared only to general accounting or standalone audit trail tools are outside this scope.
Scope Exclusion: Pure-play internal audit software that lacks external regulatory functionality is not included.
Segmentation Overview
Detailed Research Methodology and Data Validation
Primary Research
Mordor analysts held structured interviews and short surveys with compliance officers, RegTech vendors, big-four consultants, and regional regulators across North America, Europe, and Asia-Pacific. These conversations clarified annual license fees, deployment hurdles, and typical seat counts, letting us fine-tune penetration assumptions and stress-test desk findings.
Desk Research
We began with open datasets issued by bodies such as the Financial Action Task Force, the European Banking Authority, the U.S. OCC, and the Monetary Authority of Singapore, which map rule changes and enforcement volumes. Country-level ICT spend, cloud-migration statistics from the World Bank and OECD, and banking asset tables from the BIS helped size potential compliance budgets. Company filings, investor presentations, and reputable press releases were mined to benchmark average selling prices and recent contract wins. Paid resources, D&B Hoovers for vendor financials, Dow Jones Factiva for deal flow, and Questel for patent velocity added depth. This list is illustrative; many additional sources informed our desk work.
Market-Sizing & Forecasting
A top-down build traced the regulated entity universe, mapped current adoption rates, and applied average annual spend to derive 2025 revenue. Select bottom-up checks, supplier roll-ups, channel partner volumes, and sampled ASP × active seats validated totals and highlighted gaps. Core variables included global regulatory fines, number of new directives per year, cloud adoption in BFSI, suspicious activity reports filed, and average cost-of-compliance ratios. Forecasts to 2030 apply multivariate regression paired with scenario analysis, linking spend growth to the trajectory of fines, rule issuances, and digital-banking penetration. Where supplier data were thin, conservative interpolation using region-specific adoption curves bridged the gaps.
Data Validation & Update Cycle
Outputs pass a two-step analyst review, variance checks against external benchmarks, and rejection thresholds for outliers. Reports update yearly, with mid-cycle refreshes triggered by material events such as landmark regulations or multi-billion-dollar fines. A fresh validation sweep is completed just before publication so clients receive the latest view.
Why Mordor's Regtech Baseline Inspires Buyer Confidence
Benchmark comparison
Published estimates frequently diverge because publishers pick different scopes, anchor years, or pricing assumptions, and some refresh their models only sporadically.
Key gap drivers include whether non-financial verticals are counted, how SaaS implementation fees are treated, the pace at which cloud migration is assumed, and currency conversion timing.
| Market Size | Anonymized source | Primary gap driver | ||
|---|---|---|---|---|
USD 20.67 B (2025) | Mordor Intelligence | Anonymized source:Mordor Intelligence | Primary gap driver: | |
USD 19.60 B (2025) | Global Consultancy A | Excludes healthcare & energy; uses fixed 15% discounting on services | ||
USD 20.32 B (2024) | Trade Journal B | Counts license revenue only; omits onboarding services and APAC start-ups | ||
USD 19.50 B (2026) | Industry Analytics C | Older base year; assumes flat ASP despite rising AI premium |
Wealth Management Intelligence for the Middle East
4 Min Read
Driving Growth in the Embedded Insurance Market
4 Min Read
Wealth Management Intelligence for the Middle East
4 Min Read
When decisions matter, industry leaders turn to our analysts. Let’s talk.