Market Overview
| Study Period | 2018 - 2031 |
|---|---|
| Forecast Data Period | 2026 - 2031 |
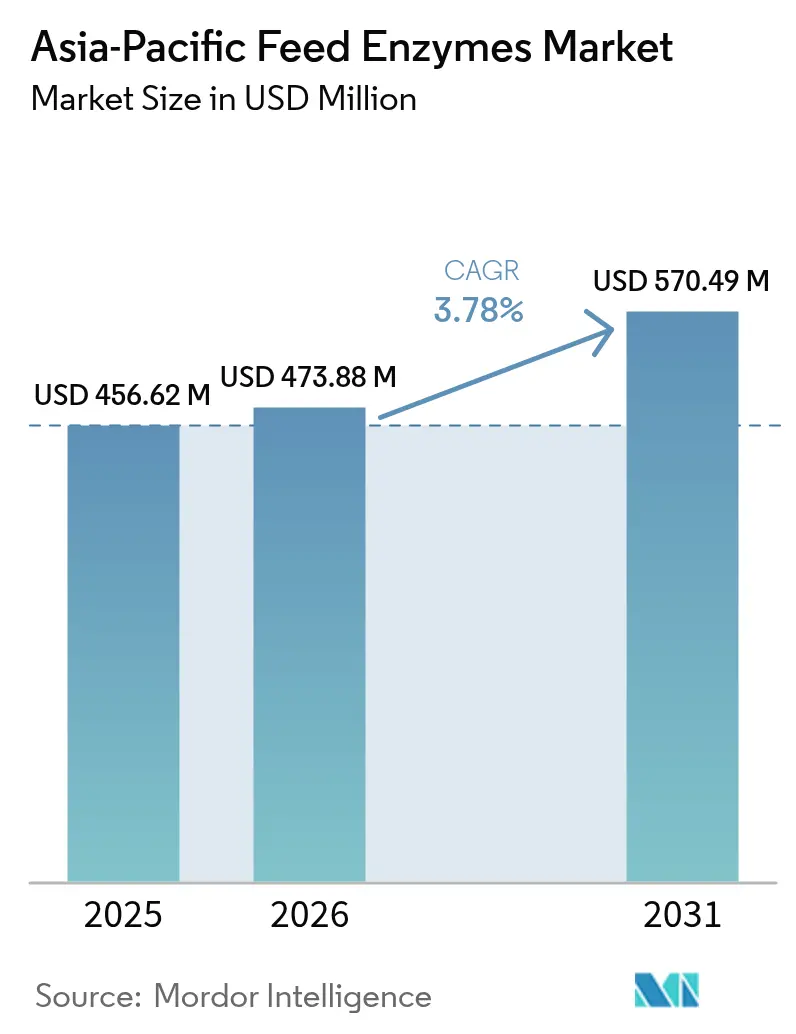
| Base Year Market Size (2025) | USD 456.62 Million |
| Market Size (2026) | USD 473.88 Million |
| Market Size (2031) | USD 570.49 Million |
| Growth Rate (2026 - 2031) | 3.78% CAGR |
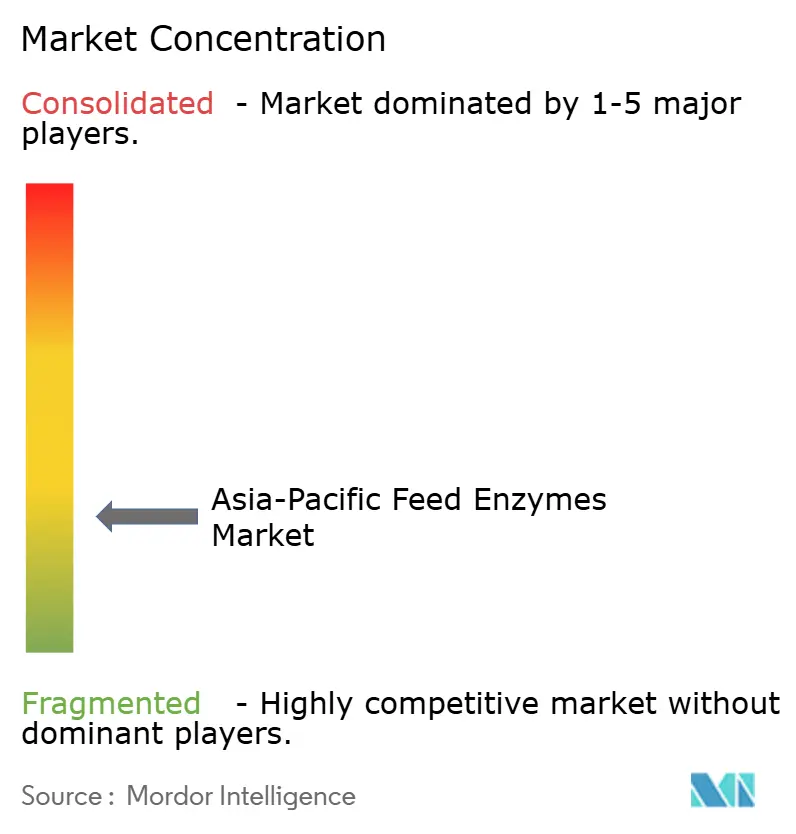
| Market Concentration | Low |
Major Players
*Disclaimer: Major Players sorted in no particular order Image © Mordor Intelligence. Reuse requires attribution under CC BY 4.0. |
|
Asia-Pacific Feed Enzymes Market Analysis by Mordor Intelligence
The Asia-Pacific feed enzymes market size is expected to grow from USD 456.62 million in 2025 to USD 473.88 million in 2026 and is forecast to reach USD 570.49 million by 2031 at 3.78% CAGR over 2026-2031. Robust poultry and aquaculture production, grain price volatility, and antibiotic-growth-promoter (AGP) restrictions are steering enzyme adoption into mainstream precision‐feeding programs. Producers view carbohydrases, proteases, and phytases as cost-effective levers for feed conversion gains in cereal-heavy rations, while large integrators in China and Thailand use tax incentives and digital formulation tools to tailor inclusion rates. Tier-one suppliers are consolidating fermentation capacity to stabilize costs and to serve increasingly harmonized regulatory requirements across Southeast Asia. At the same time, probiotics are positioning as partial substitutes in premium aquaculture, forcing enzyme companies to sharpen value propositions around nutrient yield, environmental compliance, and health support.
Key Report Takeaways
- By sub-additive, carbohydrases captured 43.55% of the Asia-Pacific feed enzymes market share in 2025, and other enzymes are forecast to record the fastest 4.02% CAGR to 2031.
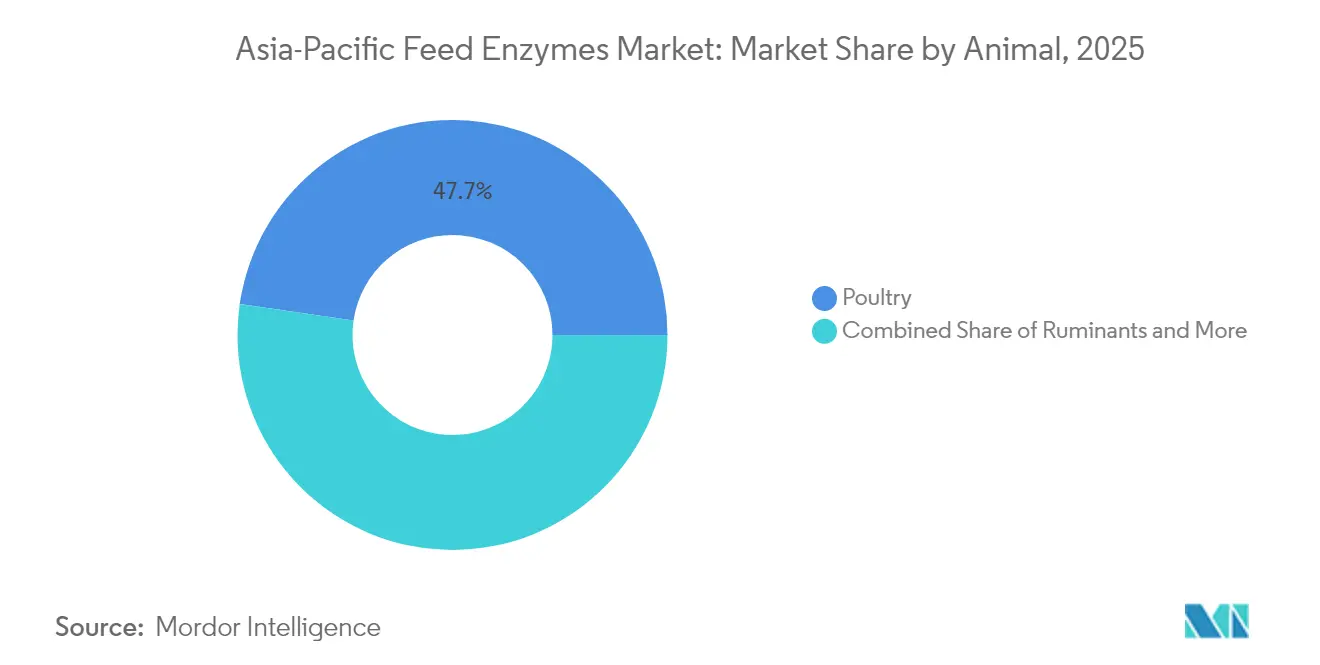
- By animal, poultry held a 47.70% share of the Asia-Pacific feed enzymes market size in 2025, while other animals are projected to expand at a 4.37% CAGR through 2031.
- By geography, China led with 43.25% revenue share in 2025; Thailand is forecast to achieve the highest 4.58% CAGR through 2031.
Note: Market size and forecast figures in this report are generated using Mordor Intelligence’s proprietary estimation framework, updated with the latest available data and insights as of 2026.
Asia-Pacific Feed Enzymes Market Trends and Insights
Drivers Impact Analysis*
| Driver | (~) % Impact on CAGR Forecast | Geographic Relevance | Impact Timeline |
|---|---|---|---|
| Accelerating livestock production output | +1.2% | China, India, Thailand, and Vietnam | Medium term (2-4 years) |
| Antibiotic-growth-promoter (AGP) bans and restrictions | +0.9% | Southeast Asia core, spill-over to China | Short term (≤ 2 years) |
| Escalating feed-grain prices pushing efficiency gains | +0.7% | Global Asia-Pacific, concentrated in import-dependent markets | Short term (≤ 2 years) |
| Shrimp-cluster boom in Southeast Asia | +0.5% | Thailand, Vietnam, Indonesia, and the Philippines | Medium term (2-4 years) |
| China's phosphorus-tax credits for phytase adoption | +0.4% | China mainland, Hong Kong processing facilities | Long term (≥ 4 years) |
| Digital precision-feeding platforms integrating enzyme matrices | +0.3% | Advanced markets: Japan, South Korea, and urban China | Long term (≥ 4 years) |
| Source: Mordor Intelligence | |||
Accelerating Livestock Production Output
Asia-Pacific's livestock sector expansion continues driving enzyme demand, with regional feed production reaching 475.33 million metric tons in 2024, representing a 1.40% year-over-year increase[1]Source: A. P. Sinurat et al., “Effectivity of Dry and Liquid BS4 Enzymes in Improving Performance of Broiler Chickens Fed Different Nutrient Density Diet,” JITV, medpub.litbang.pertanian.go.id. This production scale creates substantial enzyme market opportunities, as each percentage point improvement in feed conversion efficiency translates to millions of dollars in cost savings across the region's intensive farming operations. The broiler segment particularly benefits from this trend, with Asia-Pacific broiler feed production growing annually, necessitating advanced enzyme formulations to optimize nutrient utilization in high-density production systems. Indonesia's Ministry of Agriculture has streamlined feed additive approvals to support this expansion, reducing regulatory approval timelines for enzyme products.
Antibiotic-Growth-Promoter (AGP) Bans and Restrictions
Regulatory restrictions on antibiotic growth promoters are accelerating enzyme adoption across Southeast Asia, with Malaysia's colistin ban and China's revised feed additive catalogs creating immediate market opportunities for enzyme alternatives. The European Food Safety Authority's approval of endo-β-1,4-xylanase for avian species and porcine applications provides a regulatory template that Asia-Pacific authorities are adapting for local enzyme approval[2]Source: EFSA Panel on FEEDAP, “Safety and efficacy of a feed additive consisting of endo-β-1,4-xylanase,” PubMed, pubmed.ncbi.nlm.nih.gov. This regulatory convergence reduces development costs for multinational enzyme suppliers while ensuring consistent safety standards across jurisdictions. Vietnam's recent implementation of AGP restrictions in aquaculture feeds has created particularly strong demand for protease and carbohydrase combinations that maintain growth performance without antimicrobial supplementation.
Escalating Feed-Grain Prices Pushing Efficiency Gains
Volatile commodity prices are intensifying focus on feed conversion optimization, with corn and soybean meal price fluctuations directly impacting enzyme adoption economics across the region. Feed cost pressures have reached critical thresholds in import-dependent markets, where grain price volatility can swing feed costs within quarterly periods. This economic reality drives systematic enzyme adoption as producers seek to maintain margins through improved nutrient extraction rather than ingredient substitution. The economic benefits become particularly pronounced in aquaculture applications, where feed represents of total production costs and enzyme-mediated improvements in feed conversion ratios generate immediate bottom-line impacts.
Shrimp-Cluster Boom in Southeast Asia
Southeast Asia's shrimp aquaculture expansion is creating specialized enzyme demand, with Thailand, Vietnam, and Indonesia collectively increasing production capacity by over 200,000 metric tons annually. Pacific white shrimp cultivation requires precise nutritional management to prevent disease outbreaks and optimize growth rates, creating opportunities for targeted enzyme formulations that address species-specific digestive physiology. Recent studies demonstrate that protease supplementation at 250 grams per metric ton improves feed conversion ratios by 0.4-0.5 points while enhancing frozen meat quality during extended storage periods. Bromelain-based systems also reduce the risk of Acute Hepatopancreatic Necrosis Disease, allowing producers to secure premium export contracts.
Restraints Impact Analysis*
| Restraint | (~) % Impact on CAGR Forecast | Geographic Relevance | Impact Timeline |
|---|---|---|---|
| Fermentation-substrate cost volatility | -0.8% | Global Asia-Pacific, concentrated in China and India production hubs | Short term (≤ 2 years) |
| Lengthy multi-country regulatory approval cycles | -0.6% | Asia-Pacific markets, fragmented approval systems | Medium term (2-4 years) |
| Cold-chain gaps for liquid enzymes in tropical interiors | -0.4% | Indonesia, Philippines, Vietnam rural markets | Long term (≥ 4 years) |
| Probiotics positioning as enzyme substitutes | -0.3% | Aquaculture-focused markets, premium segments | Medium term (2-4 years) |
| Source: Mordor Intelligence | |||
Fermentation-Substrate Cost Volatility
Enzyme production costs fluctuate significantly with corn and soybean meal prices, creating margin pressures that limit adoption in price-sensitive market segments. Fermentation substrate costs can represent 40-60% of total enzyme production expenses, making enzyme pricing highly sensitive to agricultural commodity cycles[3]Tanpong, Sirisak, "Citric Acid By-Product Fermentation by Bacillus subtilis I9: A Promising Path to Sustainable Animal Feed," doi.org. This cost structure creates particular challenges in developing markets where feed mills operate on thin margins and cannot absorb enzyme price increases without compromising competitiveness. Alternative substrate development, including citric acid production by-products and agricultural waste streams, offers potential cost mitigation strategies, though these approaches require substantial process validation and regulatory approval investments.
Lengthy Multi-Country Regulatory Approval Cycles
Fragmented regulatory frameworks across Asia-Pacific markets create substantial time and cost barriers for enzyme commercialization, with approval timelines ranging from 12 months in streamlined jurisdictions to over 36 months in complex regulatory environments. The lack of mutual recognition agreements between national authorities requires duplicate safety and efficacy studies for identical enzyme products, increasing development costs and delaying market entry. Japan's Ministry of Agriculture, Forestry and Fisheries maintains particularly stringent requirements for genetically modified microbial enzyme sources, requiring comprehensive environmental risk assessments that can extend approval timelines by 6-12 months beyond standard safety evaluations.
*Our forecasts treat driver/restraint impacts as directional, not additive. The impact forecasts reflect baseline growth, mix effects, and variable interactions.
Segment Analysis
By Sub Additive: Carbohydrases Lead Cereal-Heavy Formulations
Carbohydrases held 43.55% of the Asia-Pacific feed enzymes market in 2025. Wide use of wheat, broken rice, and sorghum across regional poultry and swine diets elevates viscosity issues that xylanase and cellulase resolve. Other enzymes are forecast to grow at a 4.02% CAGR through 2031. The Asia-Pacific feed enzymes market reflects adoption in shrimp diets that require targeted protein hydrolysis. Approval pathways in Japan still favor single-activity products; yet feed mills increasingly demand three-in-one matrices that simplify logistics and lower micro-ingredient handling errors.
Ongoing reform of national additive catalogs now allows enzyme makers to fast-track modifications when new analytical data prove equal or greater efficacy, shortening amendment cycles and encouraging investment in research packages tailored to domestic raw-material profiles. Heat-stable granulation technology remains a differentiator, enabling carbohydrase blends to survive pelleting at 90 °C without post-pellet liquid coating.


By Animal: Poultry Industrialization Drives Enzyme Adoption
Poultry accounted for 47.70% of the Asia-Pacific feed enzymes market in 2025 and continues to anchor volume growth as broiler integrators upgrade medication-free programs. Layers follow with shell-quality concerns that benefit phytase and protease co-inclusion. The Asia-Pacific feed enzymes market share in poultry is projected to slip marginally as aquaculture climbs, yet absolute tonnage rises in line with a projected uptick in regional chicken meat output. Aquaculture enzymes, primarily aimed at Pacific white shrimp and tilapia. Other Animals will record the fastest 4.37% CAGR on a smaller base. Enzyme matrices that minimize fecal phosphorus leach into ponds gain traction because they cut water-exchange frequency and support environmental permits.
Ruminant uptake remains gradual but gains visibility in South Asia, where dairy cooperatives explore fibrolytic enzymes to offset variable forage quality and support methane-intensity targets. Swine demand benefits from China’s sustained pork recovery and from Southeast Asian bans on colistin that accelerate protease adoption in weaned-piglet feeds.
Geography Analysis
China held 43.25% of the Asia-Pacific feed enzymes market in 2025, equivalent to more than USD 200 million in sales. Phosphorus credits worth up to CNY 30 per metric ton of feed (USD 4.1) make phytase nearly cost-neutral for large integrators, driving volume despite modest livestock output growth. India’s double-digit expansion in compound-feed tonnage promises future upside, though heterogeneous farm sizes slow uniform enzyme inclusion. The Asia-Pacific feed enzymes market size in Thailand is smaller but accelerating, buoyed by a 4.58% CAGR through 2031 as shrimp processors demand protease-rich blends that improve meat yield and freezer stability.
Southeast Asia, led by Thailand, Vietnam, and Indonesia, shows dynamic growth as aquaculture investments blossom. The Asia-Pacific feed enzymes market benefits from Thailand’s cluster approach, where hatcheries, feed mills, and processing plants co-locate, creating predictable demand forecasts. Vietnam’s new AGP restrictions shifted 25% of shrimp-feed reformulations toward dual-activity protease and lipase complexes within 12 months of launch. Indonesia’s rural cold-chain gaps remain a bottleneck, but exporters of pelleted shrimp feed continue to adopt heat-stable enzyme coatings to serve clients in landlocked provinces. North Asia’s mature markets Japan and South Korea offer premium pricing, with buyers valuing rigorous efficacy data and integration into proprietary feed-formulation engines. Both countries subsidize on-farm environmental sensors that feed directly into nutrient-adjustment platforms, ensuring real-time enzyme cost-benefit transparency. Australia’s grazing systems adopt fibrolytic enzymes for extensive beef herds, especially during drought-induced hay shortages that compromise fiber digestibility.
Competitive Landscape
The Asia-Pacific feed enzymes market is low concentrated. IFF(Danisco Animal Nutrition), Novonesis (DSM-Firmenich), Kerry Group Plc, Elanco Animal Health Inc., and BASF SE headline suppliers with vertically integrated capacity, robust strain libraries, and multi-continent distribution. Novonesis closed its EUR 1.5 billion (USD 1.6 billion) acquisition of DSM-Firmenich’s Feed Enzyme Alliance stake in February 2025, creating a portfolio spanning xylanase to next-generation protease platforms. The enlarged entity now enjoys scale economies in microbiology, fermentation, and regulatory dossier management across twelve Asia-Pacific jurisdictions.
Regional champions such as Bio-Chem Tech and Beijing Challenge Group exploit domestic registration agility to hold share within China’s massive swine and poultry segments. They increasingly partner with university labs to tailor enzyme ratios to local grain inclusions, offsetting Western multinationals’ brand equity. Joint ventures between Western technology licensors and Asian fermentation specialists, exemplified by Evonik and Vland Biotech’s 2025 Wuhan facility, bridge the gap between advanced strain engineering and low-cost production.
Competitive intensity centers on technical service rather than headline enzyme potency. Suppliers embed formulation software modules and on-farm sampling kits that verify nutrient digestibility improvements, differentiating offers without relying solely on price. Heat-stable delivery formats, smartphone-connected dosage pumps, and blockchain-verified emission reports emerge as new battlefields.
Asia-Pacific Feed Enzymes Industry Leaders
-
BASF SE
-
Elanco Animal Health Inc.
-
IFF(Danisco Animal Nutrition)
-
Kerry Group PLC
-
Novonesis (DSM-Firmenich)
- *Disclaimer: Major Players sorted in no particular order

Recent Industry Developments
- February 2025: Novonesis completed its EUR 1.5 billion (USD 1.6 billion) purchase of DSM-Firmenich’s Feed Enzyme Alliance stake, integrating global fermentation assets.
- October 2024: Kerry Group opened a USD 15 million enzyme application center in Bangkok to customize blends for tropical climates.
- March 2024: Evonik and Vland Biotech opened a joint venture plant in Wuhan to produce probiotics and enzymes for China’s livestock sector.


Asia-Pacific Feed Enzymes Market Report Scope
Carbohydrases, Phytases are covered as segments by Sub Additive. Aquaculture, Poultry, Ruminants, Swine are covered as segments by Animal. Australia, China, India, Indonesia, Japan, Philippines, South Korea, Thailand, Vietnam are covered as segments by Country.
Additive
| By Sub Additive | Carbohydrases |
| Phytases | |
| Other Enzymes |
Animal
| Aquaculture | By Sub Animal | Fish |
| Shrimp | ||
| Other Aquaculture Species | ||
| Poultry | By Sub Animal | Broiler |
| Layer | ||
| Other Poultry Birds | ||
| Ruminants | By Sub Animal | Beef Cattle |
| Dairy Cattle | ||
| Other Ruminants | ||
| Swine | ||
| Other Animals |
Geography
| Australia |
| China |
| India |
| Indonesia |
| Japan |
| Philippines |
| South Korea |
| Thailand |
| Vietnam |
| Rest of Asia-Pacific |
| Additive | By Sub Additive | Carbohydrases | |
| Phytases | |||
| Other Enzymes | |||
| Animal | Aquaculture | By Sub Animal | Fish |
| Shrimp | |||
| Other Aquaculture Species | |||
| Poultry | By Sub Animal | Broiler | |
| Layer | |||
| Other Poultry Birds | |||
| Ruminants | By Sub Animal | Beef Cattle | |
| Dairy Cattle | |||
| Other Ruminants | |||
| Swine | |||
| Other Animals | |||
| Geography | Australia | ||
| China | |||
| India | |||
| Indonesia | |||
| Japan | |||
| Philippines | |||
| South Korea | |||
| Thailand | |||
| Vietnam | |||
| Rest of Asia-Pacific | |||


Market Definition
- FUNCTIONS - For the study, feed additives are considered to be commercially manufactured products that are used to enhance characteristics such as weight gain, feed conversion ratio, and feed intake when fed in appropriate proportions.
- RESELLERS - Companies engaged in reselling feed additives without value addition have been excluded from the market scope, to avoid double counting.
- END CONSUMERS - Compound feed manufacturers are considered to be end-consumers in the market studied. The scope excludes farmers buying feed additives to be used directly as supplements or premixes.
- INTERNAL COMPANY CONSUMPTION - Companies engaged in the production of compound feed as well as the manufacturing of feed additives are part of the study. However, while estimating the market sizes, the internal consumption of feed additives by such companies has been excluded.
| Keyword | Definition |
|---|---|
| Feed additives | Feed additives are products used in animal nutrition for purposes of improving the quality of feed and the quality of food from animal origin, or to improve the animals’ performance and health. |
| Probiotics | Probiotics are microorganisms introduced into the body for their beneficial qualities. (It maintains or restores beneficial bacteria to the gut). |
| Antibiotics | Antibiotic is a drug that is specifically used to inhibit the growth of bacteria. |
| Prebiotics | A non-digestible food ingredient that promotes the growth of beneficial microorganisms in the intestines. |
| Antioxidants | Antioxidants are compounds that inhibit oxidation, a chemical reaction that produces free radicals. |
| Phytogenics | Phytogenics are a group of natural and non-antibiotic growth promoters derived from herbs, spices, essential oils, and oleoresins. |
| Vitamins | Vitamins are organic compounds, which are required for normal growth and maintenance of the body. |
| Metabolism | A chemical process that occurs within a living organism in order to maintain life. |
| Amino acids | Amino acids are the building blocks of proteins and play an important role in metabolic pathways. |
| Enzymes | Enzyme is a substance that acts as a catalyst to bring about a specific biochemical reaction. |
| Anti-microbial resistance | The ability of a microorganism to resist the effects of an antimicrobial agent. |
| Anti-microbial | Destroying or inhibiting the growth of microorganisms. |
| Osmotic balance | It is a process of maintaining salt and water balance across membranes within the body's fluids. |
| Bacteriocin | Bacteriocins are the toxins produced by bacteria to inhibit the growth of similar or closely related bacterial strains. |
| Biohydrogenation | It is a process that occurs in the rumen of an animal in which bacteria convert unsaturated fatty acids (USFA) to saturated fatty acids (SFA). |
| Oxidative rancidity | It is a reaction of fatty acids with oxygen, which generally causes unpleasant odors in animals. To prevent these, antioxidants were added. |
| Mycotoxicosis | Any condition or disease caused by fungal toxins, mainly due to contamination of animal feed with mycotoxins. |
| Mycotoxins | Mycotoxins are toxin compounds that are naturally produced by certain types of molds (fungi). |
| Feed Probiotics | Microbial feed supplements positively affect gastrointestinal microbial balance. |
| Probiotic yeast | Feed yeast (single-cell fungi) and other fungi used as probiotics. |
| Feed enzymes | They are used to supplement digestive enzymes in an animal’s stomach to break down food. Enzymes also ensure that meat and egg production is improved. |
| Mycotoxin detoxifiers | They are used to prevent fungal growth and to stop any harmful mold from being absorbed in the gut and blood. |
| Feed antibiotics | They are used both for the prevention and treatment of diseases but also for rapid growth and development. |
| Feed antioxidants | They are used to protect the deterioration of other feed nutrients in the feed such as fats, vitamins, pigments, and flavoring agents, thus providing nutrient security to the animals. |
| Feed phytogenics | Phytogenics are natural substances, added to livestock feed to promote growth, aid in digestion, and act as anti-microbial agents. |
| Feed vitamins | They are used to maintain the normal physiological function and normal growth and development of animals. |
| Feed flavors and sweetners | These flavors and sweeteners help to mask tastes and odors during changes in additives or medications and make them ideal for animal diets undergoing transition. |
| Feed acidifiers | Animal feed acidifiers are organic acids incorporated into the feed for nutritional or preservative purposes. Acidifiers enhance congestion and microbiological balance in the alimentary and digestive tracts of livestock. |
| Feed minerals | Feed minerals play an important role in the regular dietary requirements of animal feed. |
| Feed binders | Feed binders are the binding agents used in the manufacture of safe animal feed products. It enhances the taste of food and prolongs the storage period of the feed. |
| Key Terms | Abbreviation |
| LSDV | Lumpy Skin Disease Virus |
| ASF | African Swine Fever |
| GPA | Growth Promoter Antibiotics |
| NSP | Non-Starch Polysaccharides |
| PUFA | Polyunsaturated Fatty Acid |
| Afs | Aflatoxins |
| AGP | Antibiotic Growth Promoters |
| FAO | The Food And Agriculture Organization of the United Nations |
| USDA | The United States Department of Agriculture |


Research Methodology
Mordor Intelligence follows a four-step methodology in all our reports.
- Step-1: IDENTIFY KEY VARIABLES: In order to build a robust forecasting methodology, the variables and factors identified in Step-1 are tested against available historical market numbers. Through an iterative process, the variables required for market forecast are set and the model is built on the basis of these variables.
- Step-2: Build a Market Model: Market-size estimations for the forecast years are in nominal terms. Inflation is not a part of the pricing, and the average selling price (ASP) is kept constant throughout the forecast period.
- Step-3: Validate and Finalize: In this important step, all market numbers, variables and analyst calls are validated through an extensive network of primary research experts from the market studied. The respondents are selected across levels and functions to generate a holistic picture of the market studied.
- Step-4: Research Outputs: Syndicated Reports, Custom Consulting Assignments, Databases & Subscription Platforms


