India Feed Amino Acids Market Size and Share
Market Overview
| Study Period | 2021 - 2031 |
|---|---|
| Forecast Data Period | 2026 - 2031 |
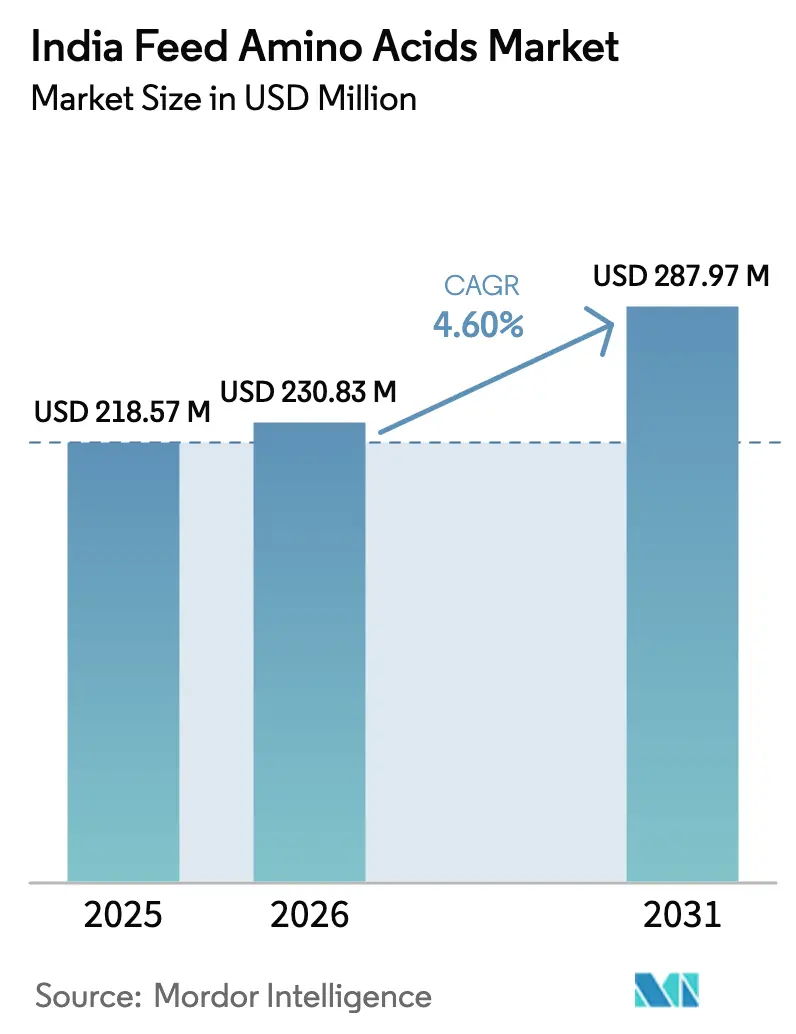
| Base Year Market Size (2025) | USD 218.57 Million |
| Market Size (2026) | USD 230.83 Million |
| Market Size (2031) | USD 287.97 Million |
| Growth Rate (2026 - 2031) | 4.60% CAGR |
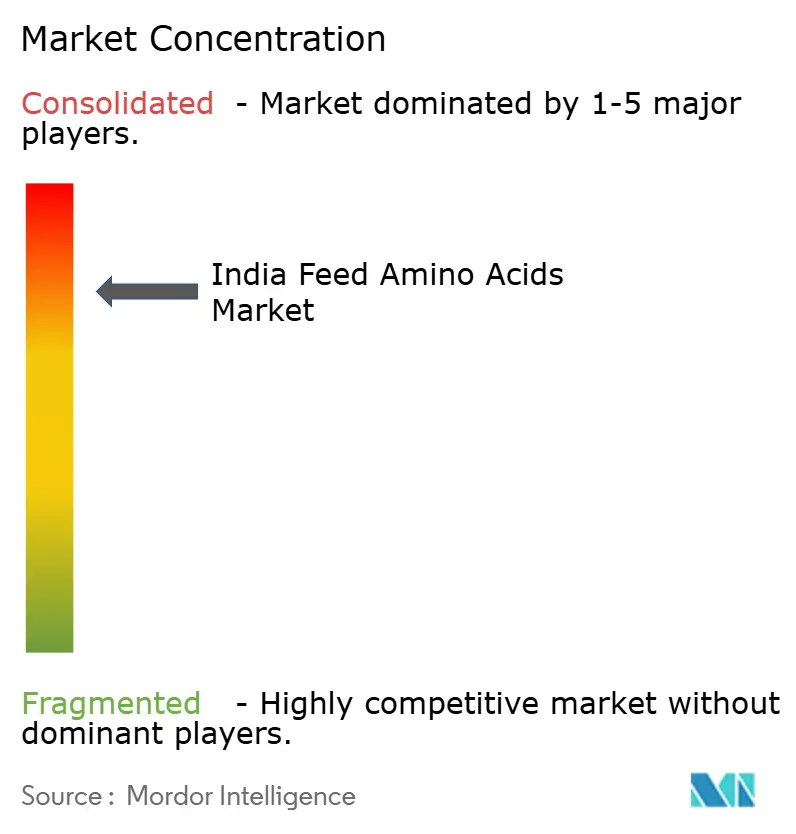
| Market Concentration | High |
Major Players *Disclaimer: Major Players sorted in no particular order Image © Mordor Intelligence. Reuse requires attribution under CC BY 4.0. | |
India Feed Amino Acids Market Analysis by Mordor Intelligence
The India feed amino acids market size is projected to increase from USD 218.57 million in 2025 to USD 230.83 million in 2026 and reach USD 287.97 million by 2031, growing at a CAGR of 4.60% over 2026-2031. A steady shift toward precision nutrition is quietly reshaping ration formulation as integrators substitute crystalline lysine, methionine, and threonine for soybean meal to save ingredient cost and curb nitrogen excretion. Regulatory tightening under IS 17010 has weeded out small importers, consolidating volumes among multinational producers and raising overall product purity. Regional feed manufacturers in South and West India now view amino acids as cost-arbitrage levers rather than specialty inputs, an attitude that underpins resilient demand even when soymeal prices swing. Technical service laboratories established by suppliers such as Evonik and Bluestar Adisseo are further anchoring usage by demonstrating feed conversion improvements in on-farm trials.
Key Report Takeaways
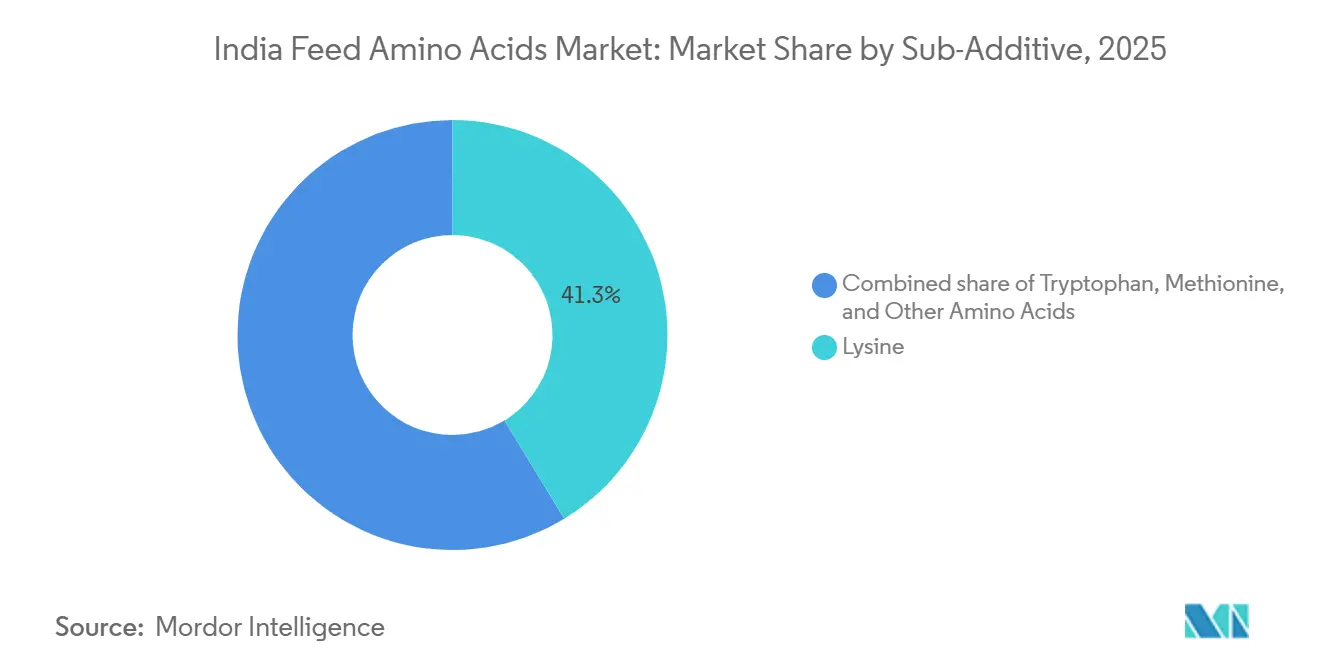
- By sub-additive, lysine held 41.3% of the India feed amino acids market share in 2025, while methionine is anticipated to grow at a 4.6% CAGR through 2031.
- By animal, Poultry accounted for 66.1% of India feed amino acids market size in 2025 and is anticipated to expand at a 4.6% CAGR through 2031.
- The five largest suppliers, including Evonik Industries AG, Adisseo, Ajinomoto Co., Inc., Archer Daniels Midland Co., and Novus International, Inc., together accounted for a significant share of the India feed amino acids market in 2025, underscoring a high-entry-barrier landscape.
Note: Market size and forecast figures in this report are generated using Mordor Intelligence’s proprietary estimation framework, updated with the latest available data and insights as of 2026.
India Feed Amino Acids Market Trends and Insights
Drivers Impact Analysis*
| Driver | (~) % Impact on CAGR Forecast | Geographic Relevance | Impact Timeline |
|---|---|---|---|
| Rising poultry meat and egg consumption | +1.2% | Andhra Pradesh, Telangana, Tamil Nadu, Maharashtra, and West Bengal | Medium term (2-4 years) |
| Organized aquaculture feed-mill expansion | +0.9% | Andhra Pradesh, Gujarat, Odisha, West Bengal, and Punjab | Medium term (2-4 years) |
| Government subsidies and import duty relief | +0.6% | National | Short term (≤ 2 years) |
| Low-protein diet reformulation with crystalline amino acids | +0.8% | National | Long term (≥ 4 years) |
| Carbon-credit eligible nitrogen-reduction diets | +0.3% | Punjab, Haryana, and Gujarat | Long term (≥ 4 years) |
| Expansion of molasses-based fermentation capacity in Maharashtra | +0.4% | Maharashtra and Karnataka | Medium term (2-4 years) |
| Source: Mordor Intelligence | |||
Rising Poultry Meat and Egg Consumption
Domestic broiler meat output rose to 6.77 million metric tons in 2024, a gain that strained conventional corn-soy formulations and highlighted the cost benefit of crystalline lysine and methionine. Integrators achieved 0.01-point feed conversion savings that translate into INR 0.50 per kilogram (USD 0.006) lower production cost, a margin lever in tight commodity cycles. The National Egg Coordination (NCC) Committee reported threonine usage in peak-lay rations climbed significantly across commercial flocks in 2025, demonstrating rapid mainstreaming beyond broiler starter diets. Split-sex feeding programs in Andhra Pradesh now tailor methionine levels to male and female growth curves, an innovation dependent on stable amino acid supply. Combined, these practices anchor baseline uptake, making poultry the structural demand pillar within the India feed amino acids market[1]Source: Department of Animal Husbandry and Dairying, “Livestock Production Statistics 2024,” dahd.nic.in.
Organized Aquaculture Feed-Mill Expansion
Shrimp feed production reached 1.82 million metric tons in 2024, and capacity additions funded under the Pradhan Mantri Matsya Sampada Yojana will lift output by another 500,000 metric tons by 2027. Modern mills formulate shrimp diets with up to 2.2% lysine and 1.1% methionine to hold feed conversion below 1.3, a metric that directly influences export competitiveness. Field reports from Gujarat show amino acid-fortified diets improved pond survival by up to 10%, boosting harvest yields by 300 kilograms per hectare. The reliability of these results accelerates adoption in inland pangasius and tilapia clusters that face rising density-linked stress. Consequently, aquaculture is evolving from an opportunistic to a programmed user segment, elevating its CAGR contribution to the India feed amino acids market[2]Source: Marine Products Export Development Authority, “Shrimp Feed Production 2024,” mpeda.gov.in.
Government Subsidies and Import Duty Relief
In the Union Budget 2024-25 and 2025 reviews, India retained a 7.5% Basic Customs Duty on lysine to support livestock and poultry. While duties on some aquatic feed inputs dropped to 5%, lysine's total landed cost remains around 25.8% as of early 2026. Parallel 50% purchase subsidies for marginal farmers widened access, lifting inclusion rates in Uttar Pradesh and Madhya Pradesh layer farms within six months. Concessional credit under the Fisheries and Aquaculture Infrastructure Development Fund (FIDF) earmarked 20% of disbursements for amino acid procurement, a facility that has already enabled five mid-size mills to commission liquid methionine dosing lines. Tamil Nadu’s targeted rebate program raised adoption in the Namakkal egg hub from 45% to 68% of farms, making export-class nutrient profiles economically viable for smallholders. The policy mix narrows the price gap versus soybean meal, reinforcing value perception even amid raw material volatility[3]Source: Ministry of Finance, “Union Budget Customs Duty Amendments 2024-25,” indiabudget.gov.in.
Low-Protein Diet Reformulation with Crystalline Amino Acids
Feed crude protein targets fell from 19% to 17.5% in broiler finisher rations between 2023 and 2025, with four-amino-acid supplementation delivering equal 42-day body weight and feed conversion. This shift lowers nitrogen output by up to 18%, easing litter management and improving in-house air quality, benefits that resonate with integrators seeking sustainability credentials. A 2024 controlled study published in the Indian Journal of Animal Nutrition validated identical performance at 17% crude protein, saving INR 1.80 per kilogram (USD 0.022) in feed cost. Layer producers extending cycles beyond 80 weeks adopt valine as a fifth limiting amino acid to keep egg weight above 58 grams. Such empirical proof drives a long-term structural trend that underpins the India feed amino acids market.
Restraints Impact Analysis*
| Restraint | (~) % Impact on CAGR Forecast | Geographic Relevance | Impact Timeline |
|---|---|---|---|
| Soymeal and corn price volatility | −0.5% | Kerala, Himachal Pradesh, and Uttarakhand | Short term (≤ 2 years) |
| Stringent BIS and FSSAI regulatory hurdles | −0.3% | Mumbai, Chennai, and Visakhapatnam ports | Medium term (2-4 years) |
| Grid-power shortages at fermentation plants | −0.2% | Pune, Nashik, Vadodara, and Ankleshwar | Short term (≤ 2 years) |
| Limited cold-chain for liquid methionine blends | −0.2% | Uttar Pradesh, Bihar, Chhattisgarh, and Jharkhand | Medium term (2-4 years) |
| Source: Mordor Intelligence | |||
Soymeal and Corn Price Volatility
Soybean meal touched INR 58,000 per metric ton (USD 696) in May 2025 after a 22% crop shortfall and rupee depreciation, triggering ration reformulations that temporarily sidelined crystalline amino acids. Corn values climbed in tandem because ethanol blending siphoned feed grain, adding INR 4,500 per metric ton (USD 54) to broiler diets during peak procurement months. A 2025 survey of 120 mills showed 68% halted amino acid inclusion once soymeal crossed INR 55,000 per metric ton (USD 660). Such on-and-off behavior hampers the transition toward standardized ideal protein formulations and caps overall penetration at about 45% of national compound feed tonnage. Until futures or risk-management tools mature, price swings will continue to weigh on the India feed amino acids market.
Stringent The Bureau of Indian Standards (BIS) and The Food Safety and Standards Authority of India (FSSAI) Regulatory Hurdles
Batch-wise certificates for purity, heavy metals, and microbiological safety add four to six weeks to clearance, delaying the arrival of time-sensitive imports. The Food Safety and Standards Authority of India (FSSAI) toxicology dossier demand for coated or encapsulated variants blocked 18 lysine sulfate consignments in 2025 alone because labeling deviated from Schedule II requirements. Compliance costs of INR 1.2 million (USD 14,400) per Stock Keeping Unit (SKU) deter small traders and squeeze brand variety, a scenario that keeps prices elevated in tier-2 markets. Although large players absorb these charges, new entrants face a steep barrier that slows competitive price discovery. In turn, downstream users delay adoption, tempering volume growth in the India feed amino acids market.
*Our forecasts treat driver/restraint impacts as directional, not additive. The impact forecasts reflect baseline growth, mix effects, and variable interactions.
Segment Analysis
By Sub-Additive: Lysine Leads, Methionine Spurs Growth
Lysine captured the largest share by sub-additive, accounting for 41.3% of the India feed amino acids market size in 2025 because broiler starter and grower diets in Andhra Pradesh, Telangana, and Tamil Nadu include up to 3.5 kilograms per metric ton to shave soybean meal costs. Methionine is forecast to log the fastest expansion, with a 4.6% CAGR between 2026 and 2031, as vertically integrated poultry complexes switch to liquid hydroxy analogs that raise feed conversion efficiency and lower crude protein targets. Together, these two amino acids illustrate how precision-nutrition strategies favor a digestible amino acid balance over bulk protein, a shift that keeps poultry the prime growth engine for the India feed amino acids market. Rising demand also reflects regulator-driven purity standards that concentrate supply among producers able to guarantee consistent assay values.
Threonine, tryptophan, and branched-chain amino acids such as valine form a smaller but steadily expanding tier as feed mills adopt fourth- and fifth-limiting-amino-acid concepts to bolster gut integrity and carcass yield during heat stress. Coastal shrimp and inland pangasius producers are gradually boosting threonine and lysine inclusion to achieve feed-conversion ratios below 1.3, indicating diversification beyond monogastric livestock. High-genetic-merit dairy herds in Punjab and Gujarat are testing rumen-protected lysine and methionine that lift daily milk output by up to 1.5 liters per cow, though absolute volumes still trail poultry requirements. Specialty coated or slow-release formulations for swine, pet, and backyard poultry complete the product mix and present incremental growth avenues for suppliers focused on value-added differentiation.


By Animal: Poultry Leads and Registers Fastest Growth
Poultry held 66.1% of the India feed amino acids market share in 2025 as broiler and layer integrators nationwide pursued ideal-protein formulations that rely on high lysine and methionine inclusions. Because these integrators continue to cut crude protein while protecting feed conversion ratios, the poultry segment is also projected to register the fastest growth at a 4.6% CAGR between 2026 and 2031, sustaining its primacy in sectoral demand. Typical broiler starter diets now contain up to 1.1% lysine and 0.55% methionine, benchmarks that are gradually spreading from South to East India. Layers employ threonine and valine to maintain egg mass through 80-week cycles, reinforcing poultry’s quantitative lead and qualitative sophistication.
Aquaculture remains the next-largest growth engine as shrimp and pangasius operators raise lysine and methionine levels to keep feed conversion ratios below 1.3, though its absolute share still trails poultry. Ruminant demand is climbing among high-yield dairy herds that supplement rumen-protected lysine and methionine to lift daily milk output by up to 1.5 liters per cow, yet overall penetration stays modest. Swine usage is confined to organized farms in the Northeast and peri-urban Karnataka, where balanced lysine and threonine improve lean gain and carcass yield. Pet and specialty livestock segments round out consumption through coated or slow-release formulations that withstand India’s warm distribution chain, offering niche but rising opportunities for suppliers.

Geography Analysis
South India held a commanding major share of the India feed amino acids market in 2025, underpinned by Andhra Pradesh’s expansive broiler and shrimp industries and Tamil Nadu’s egg powerhouse in Namakkal. The region’s integrators routinely deploy lysine and methionine inclusions that align with global best practice, reinforcing their leadership in consumption. In contrast, East India is projected to grow fastest at a 5.8% CAGR to 2031, as West Bengal and Odisha aquaculture ventures scale up compound feed capacity. Government infrastructure grants and private hatchery investments are accelerating the establishment of feed mills, setting the stage for rapid amino acid uptake.
West India, centered on Maharashtra and Gujarat, accounts for a significant share of the market owing to domestic fermentation plants and robust dairy and shrimp sectors. North India contributes a significant share, with Punjab and Haryana dairy clusters adopting rumen-protected amino acids, while Uttar Pradesh’s fragmented mills lag in technical formulations. The Northeast and Central belts collectively represent a modest slice but offer emerging poultry and pig feed opportunities as organized players enter.
Looking ahead, highway upgrades, port cold-chain projects, and rail freight subsidies will narrow regional price disparities and broaden product portfolios. South Indian integrators are piloting automated liquid methionine dosing systems, a model likely to diffuse eastward as cold-chain matures. West Indian fermentation expansion promises shorter lead times for inland users in Madhya Pradesh and Chhattisgarh. Cumulatively, these developments should enlarge the India feed amino acids market footprint in underserved hinterlands during the forecast horizon.
Competitive Landscape
The top five players controlled a major share of the India amino acid market in 2025, illustrating significant concentration in the India feed amino acids market. Evonik Industries AG led, leveraging Singapore production and buffer stocks at Chennai and Mumbai to provide just-in-time deliveries, while Bluestar Adisseo Company (China National Chemical Corporation) followed, differentiated by liquid methionine hydroxy analog distributed via temperature-controlled tankers. Both firms supplement their products with advisory services that fine-tune ideal amino acid ratios, deepening customer retention.
Ajinomoto Co. Inc., Archer Daniels Midland Company, and Novus International, Inc. (Mitsui & Co., Ltd.) round out the top tier, together accounting for a significant share and focusing on coated, rumen-protected, and premix innovations. Chinese challengers CJ CheilJedang Corporation and Meihua Holdings Group have eroded lysine and threonine prices through aggressive credit terms, forcing incumbents to pivot toward technical value rather than commodity cost. Patent activity, such as Ajinomoto’s spray-dried lysine formulation, signals a shift toward climate-adapted solutions that address India’s humid logistics environment.
Strategically, suppliers are localizing packaging, expanding ISO tank capacity, and investing in feed trial laboratories to lock in integrator loyalty. Fermentation joint ventures under evaluation in Gujarat could diversify sourcing and blunt currency fluctuation risks. Bundling amino acids with enzymes, mycotoxin binders, or trace minerals into single-SKU premixes also increases switching costs for buyers. Over the forecast window, such moves should reinforce high concentration even as new entrants nibble at low-margin commodity corners of the India feed amino acids market.
India Feed Amino Acids Industry Leaders
Evonik Industries AG
Adisseo
Ajinomoto Co., Inc.
Archer Daniels Midland Co.
Novus International, Inc.
- *Disclaimer: Major Players sorted in no particular order

Recent Industry Developments
- December 2025: Orffa introduced its branded amino acids and vitamins portfolio at Poultry India 2025 in Hyderabad, strengthening its presence in the India feed amino acids market and expanding its nutritional solutions portfolio for domestic feed manufacturers and integrators.
- September 2025: DSM-Firmenich inaugurated its first Indian feed additive plant in Gujarat, adding local production of vitamin and taste solutions for livestock feeds. The facility shortens supply chains and is anticipated to ease input costs for Indian premix blenders, thereby supporting wider amino-acid and micronutrient inclusion in compound feeds.
- January 2025: Jubilant Ingrevia commissioned a cGMP-compliant vitamin B3 (niacinamide) plant at Bharuch, Gujarat, with 5,000 metric tons of annual capacity aimed at food, nutrition, and cosmetics markets. The added domestic volume should improve vitamin availability for premium poultry and aqua premixes, encouraging formulators to pair crystalline amino acids with higher vitamin densities for better growth performance.


India Feed Amino Acids Market Report Scope
Feed amino acids are synthetic or naturally derived amino acids added to animal feed to improve protein quality and optimize animal nutrition. They help balance essential amino acid requirements such as lysine, methionine, threonine, and tryptophan, enhancing growth performance, feed conversion efficiency, and reducing excess nitrogen excretion in livestock and poultry production systems.
The report on the India Feed Amino Acids Market provides an in-depth analysis based on sub-additive categories, including lysine, tryptophan, methionine, threonine, and other amino acids, as well as animal type covering ruminants, poultry, swine, aquaculture, and other animals. Market estimates and forecasts are presented in USD value.
| Lysine |
| Tryptophan |
| Methionine |
| Threonine |
| Other Amino Acid |
| Ruminants | Sub-animal |
| Dairy Cattle | |
| Other Ruminants | |
| Poultry | Broiler |
| Layer | |
| Other Poultry Birds | |
| Aquaculture | Fishes |
| Shrimp | |
| Other Aquaculture Species | |
| Swine | |
| Other Animals |
| By Sub-Additive | Lysine | |
| Tryptophan | ||
| Methionine | ||
| Threonine | ||
| Other Amino Acid | ||
| By Animal | Ruminants | Sub-animal |
| Dairy Cattle | ||
| Other Ruminants | ||
| Poultry | Broiler | |
| Layer | ||
| Other Poultry Birds | ||
| Aquaculture | Fishes | |
| Shrimp | ||
| Other Aquaculture Species | ||
| Swine | ||
| Other Animals | ||


Market Definition
- FUNCTIONS - For the study, feed additives are considered to be commercially manufactured products that are used to enhance characteristics such as weight gain, feed conversion ratio, and feed intake when fed in appropriate proportions.
- RESELLERS - Companies engaged in reselling feed additives without value addition have been excluded from the market scope, to avoid double counting.
- END CONSUMERS - Compound feed manufacturers are considered to be end-consumers in the market studied. The scope excludes farmers buying feed additives to be used directly as supplements or premixes.
- INTERNAL COMPANY CONSUMPTION - Companies engaged in the production of compound feed as well as the manufacturing of feed additives are part of the study. However, while estimating the market sizes, the internal consumption of feed additives by such companies has been excluded.
| Keyword | Definition |
|---|---|
| Feed additives | Feed additives are products used in animal nutrition for purposes of improving the quality of feed and the quality of food from animal origin, or to improve the animals’ performance and health. |
| Probiotics | Probiotics are microorganisms introduced into the body for their beneficial qualities. (It maintains or restores beneficial bacteria to the gut). |
| Antibiotics | Antibiotic is a drug that is specifically used to inhibit the growth of bacteria. |
| Prebiotics | A non-digestible food ingredient that promotes the growth of beneficial microorganisms in the intestines. |
| Antioxidants | Antioxidants are compounds that inhibit oxidation, a chemical reaction that produces free radicals. |
| Phytogenics | Phytogenics are a group of natural and non-antibiotic growth promoters derived from herbs, spices, essential oils, and oleoresins. |
| Vitamins | Vitamins are organic compounds, which are required for normal growth and maintenance of the body. |
| Metabolism | A chemical process that occurs within a living organism in order to maintain life. |
| Amino acids | Amino acids are the building blocks of proteins and play an important role in metabolic pathways. |
| Enzymes | Enzyme is a substance that acts as a catalyst to bring about a specific biochemical reaction. |
| Anti-microbial resistance | The ability of a microorganism to resist the effects of an antimicrobial agent. |
| Anti-microbial | Destroying or inhibiting the growth of microorganisms. |
| Osmotic balance | It is a process of maintaining salt and water balance across membranes within the body's fluids. |
| Bacteriocin | Bacteriocins are the toxins produced by bacteria to inhibit the growth of similar or closely related bacterial strains. |
| Biohydrogenation | It is a process that occurs in the rumen of an animal in which bacteria convert unsaturated fatty acids (USFA) to saturated fatty acids (SFA). |
| Oxidative rancidity | It is a reaction of fatty acids with oxygen, which generally causes unpleasant odors in animals. To prevent these, antioxidants were added. |
| Mycotoxicosis | Any condition or disease caused by fungal toxins, mainly due to contamination of animal feed with mycotoxins. |
| Mycotoxins | Mycotoxins are toxin compounds that are naturally produced by certain types of molds (fungi). |
| Feed Probiotics | Microbial feed supplements positively affect gastrointestinal microbial balance. |
| Probiotic yeast | Feed yeast (single-cell fungi) and other fungi used as probiotics. |
| Feed enzymes | They are used to supplement digestive enzymes in an animal’s stomach to break down food. Enzymes also ensure that meat and egg production is improved. |
| Mycotoxin detoxifiers | They are used to prevent fungal growth and to stop any harmful mold from being absorbed in the gut and blood. |
| Feed antibiotics | They are used both for the prevention and treatment of diseases but also for rapid growth and development. |
| Feed antioxidants | They are used to protect the deterioration of other feed nutrients in the feed such as fats, vitamins, pigments, and flavoring agents, thus providing nutrient security to the animals. |
| Feed phytogenics | Phytogenics are natural substances, added to livestock feed to promote growth, aid in digestion, and act as anti-microbial agents. |
| Feed vitamins | They are used to maintain the normal physiological function and normal growth and development of animals. |
| Feed flavors and sweetners | These flavors and sweeteners help to mask tastes and odors during changes in additives or medications and make them ideal for animal diets undergoing transition. |
| Feed acidifiers | Animal feed acidifiers are organic acids incorporated into the feed for nutritional or preservative purposes. Acidifiers enhance congestion and microbiological balance in the alimentary and digestive tracts of livestock. |
| Feed minerals | Feed minerals play an important role in the regular dietary requirements of animal feed. |
| Feed binders | Feed binders are the binding agents used in the manufacture of safe animal feed products. It enhances the taste of food and prolongs the storage period of the feed. |
| Key Terms | Abbreviation |
| LSDV | Lumpy Skin Disease Virus |
| ASF | African Swine Fever |
| GPA | Growth Promoter Antibiotics |
| NSP | Non-Starch Polysaccharides |
| PUFA | Polyunsaturated Fatty Acid |
| Afs | Aflatoxins |
| AGP | Antibiotic Growth Promoters |
| FAO | The Food And Agriculture Organization of the United Nations |
| USDA | The United States Department of Agriculture |


Research Methodology
Mordor Intelligence follows a four-step methodology in all our reports.
- Step-1: IDENTIFY KEY VARIABLES: In order to build a robust forecasting methodology, the variables and factors identified in Step-1 are tested against available historical market numbers. Through an iterative process, the variables required for market forecast are set and the model is built on the basis of these variables.
- Step-2: Build a Market Model: Market-size estimations for the forecast years are in nominal terms. Inflation is not a part of the pricing, and the average selling price (ASP) is kept constant throughout the forecast period.
- Step-3: Validate and Finalize: In this important step, all market numbers, variables and analyst calls are validated through an extensive network of primary research experts from the market studied. The respondents are selected across levels and functions to generate a holistic picture of the market studied.
- Step-4: Research Outputs: Syndicated Reports, Custom Consulting Assignments, Databases & Subscription Platforms


