India Dairy Alternatives Market Size and Share
Market Overview
| Study Period | 2021 - 2031 |
|---|---|
| Forecast Data Period | 2026 - 2031 |
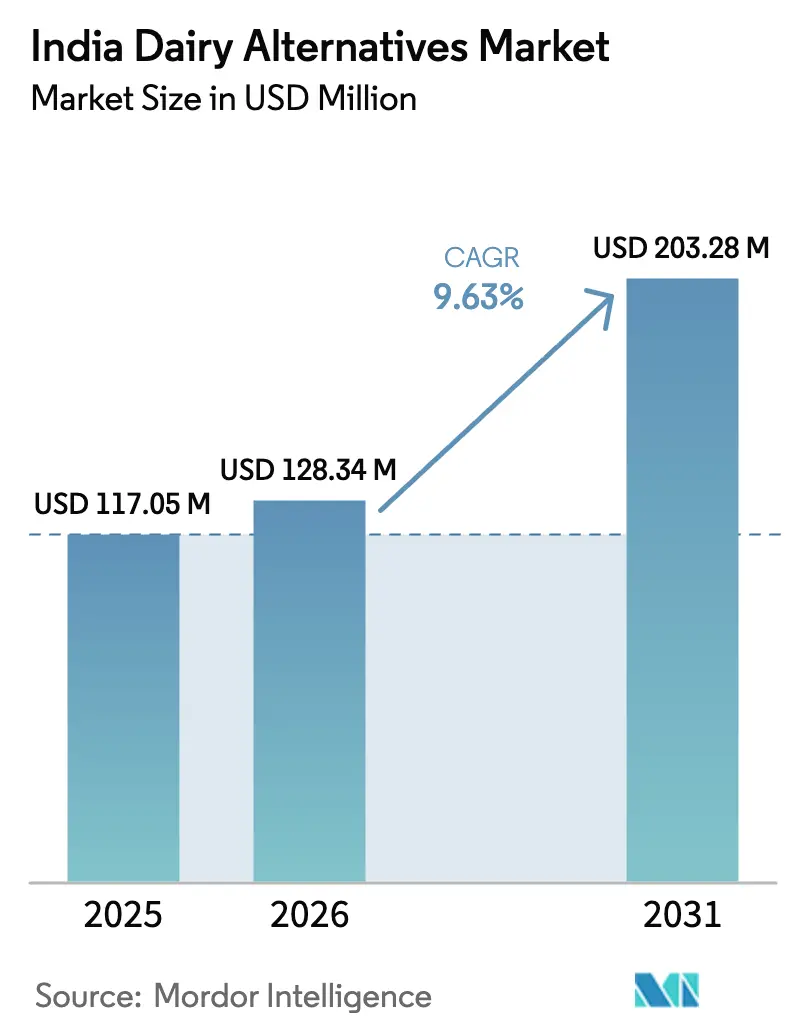
| Base Year Market Size (2025) | USD 117.05 Million |
| Market Size (2026) | USD 128.34 Million |
| Market Size (2031) | USD 203.28 Million |
| Growth Rate (2026 - 2031) | 9.63% CAGR |
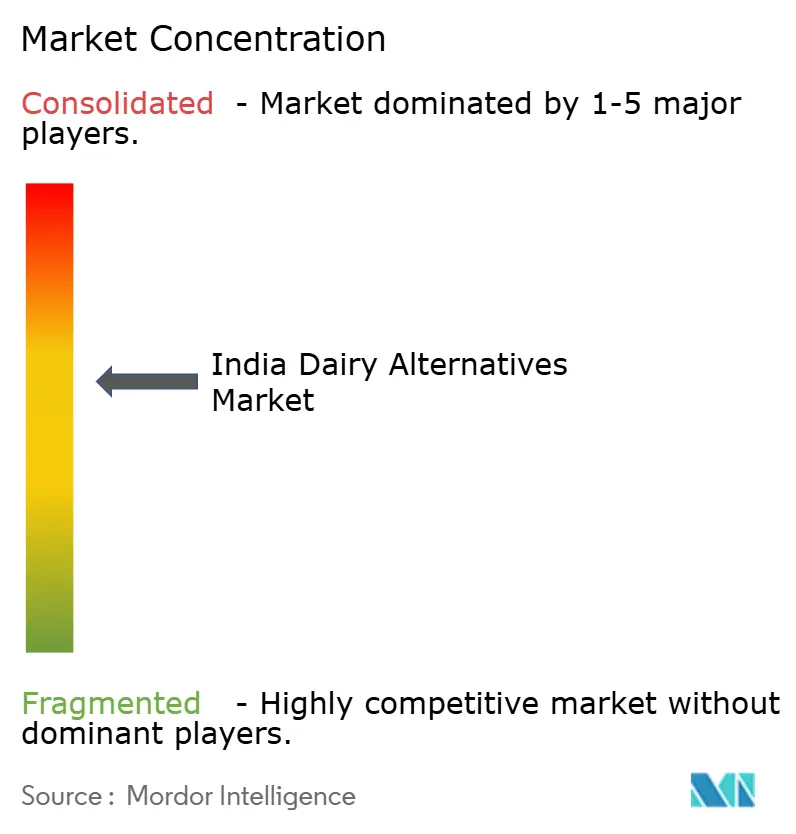
| Market Concentration | Medium |
Major Players
*Disclaimer: Major Players sorted in no particular order Image © Mordor Intelligence. Reuse requires attribution under CC BY 4.0. |
|
India Dairy Alternatives Market Analysis by Mordor Intelligence
The India Dairy Alternatives Market size is projected to be USD 117.05 million in 2025, USD 128.34 million in 2026, and reach USD 203.28 million by 2031, growing at a CAGR of 9.63% from 2026 to 2031. This growth is primarily driven by the increasing prevalence of lactose intolerance, which is prompting a structural shift in consumer preferences toward low-glycemic, cholesterol-free beverages that traditional dairy products cannot provide. Urban millennials and Gen Z consumers in Tier-1 cities are emerging as key drivers of this trend, as they are willing to pay a premium, 2-3 times more, for soy, almond, and oat-based drinks. These beverages not only reflect the café culture but also align with the flexitarian lifestyle values embraced by these demographics. The growing presence of these products on organized retail shelves and quick-commerce platforms has significantly enhanced their discoverability. However, the lack of adequate cold-chain infrastructure has necessitated an ambient-first strategy, which prioritizes shelf-stable cartons over fresh formats, despite consumer demand for fresher alternatives. Additionally, the introduction of new FSSAI labeling regulations, which require disclosures such as “Contains no Milk Fat,” is expected to impose short-term compliance costs on manufacturers. Nevertheless, these regulations are anticipated to legitimize the plant-based dairy category by providing a clear regulatory framework and definition, thereby fostering long-term growth and consumer trust.
Key Report Takeaways
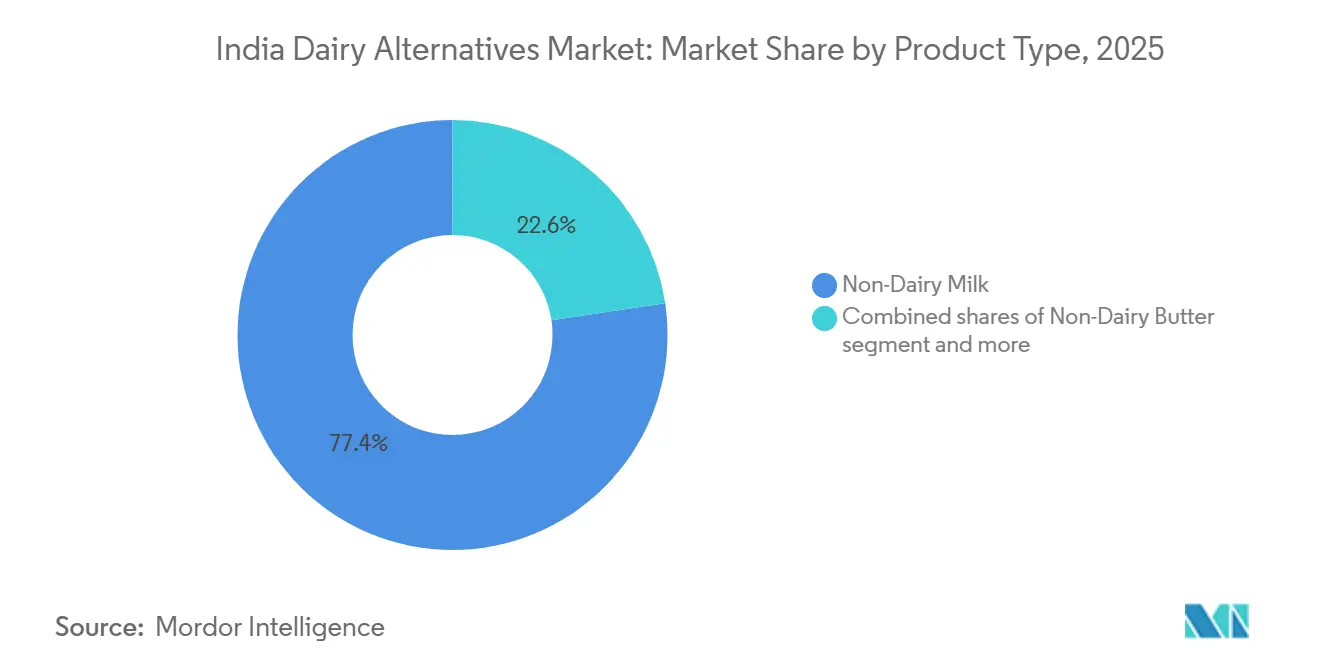
- By product type, Non-Dairy Milk led with 77.36% of India dairy alternative market share in 2025, whereas Non-Dairy Butter is projected to advance at a 10.26% CAGR through 2031.
- By packaging type, cartons accounted for 58.74% share of the India dairy alternative market size in 2025, while PET bottles are forecast to clock a 10.89% CAGR between 2026-2031.
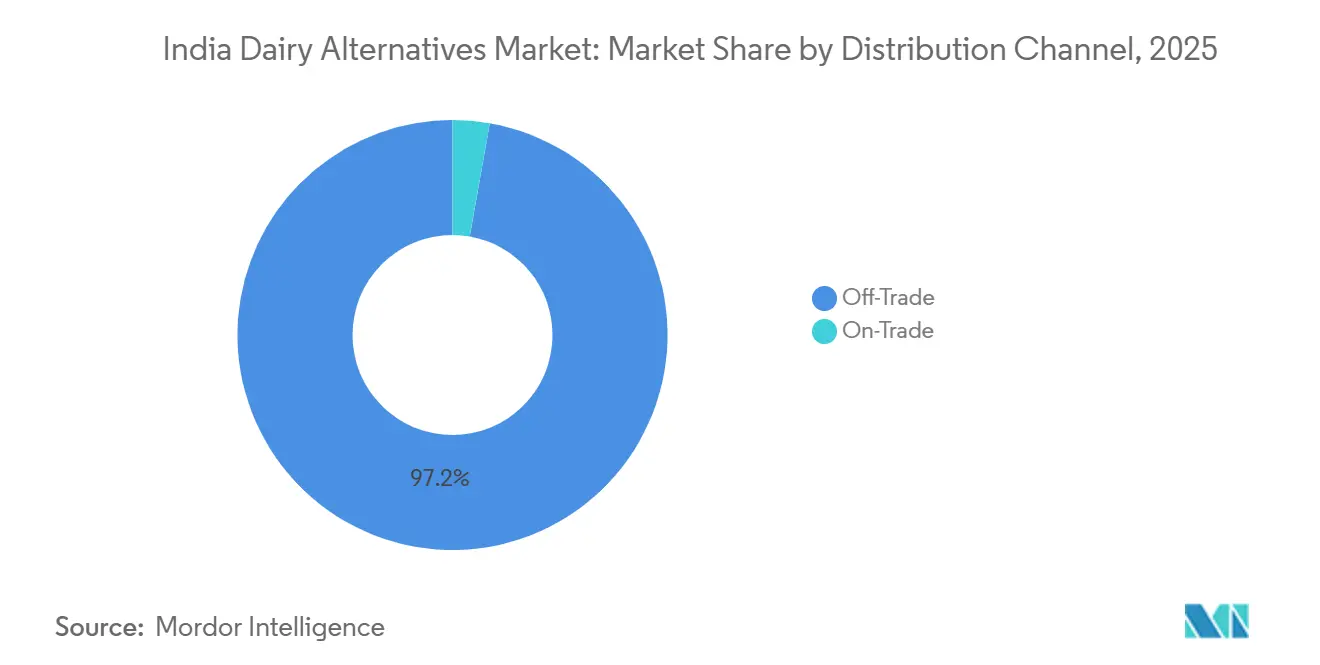
- By distribution channel, the off-trade segment held 97.23% share of the India dairy alternative market size in 2025 and the on-trade segment is rising at a 10.56% CAGR through 2031.
Note: Market size and forecast figures in this report are generated using Mordor Intelligence’s proprietary estimation framework, updated with the latest available data and insights as of 2026.
India Dairy Alternatives Market Trends and Insights
Drivers Impact Analysis*
| Driver | (~) % Impact on CAGR Forecast | Geographic Relevance | Impact Timeline |
|---|---|---|---|
| Presence of lactose intolerant population | +1.8% | National, with higher prevalence in South India (66%) versus North India (27%) | Long term (≥ 4 years) |
| Youth shifting toward vegan, flexitarian diets | +1.5% | Urban metros and Tier-1 cities, particularly among millennials and Gen Z | Medium term (2-4 years) |
| Social media, influencers promote plant diets | +1.2% | Pan-India, with concentrated impact in digitally connected urban centers | Short term (≤ 2 years) |
| Growing concern over dairy animal welfare | +0.9% | Urban educated consumers, early adopters in metro cities | Medium term (2-4 years) |
| Modern retail, cafes expanding product range | +1.6% | Tier-1 and emerging Tier-2 cities with organized retail penetration | Medium term (2-4 years) |
| Preference towards managing heart health, diabetes | +2.1% | National, with urban concentration due to higher diabetes prevalence | Long term (≥ 4 years) |
| Source: Mordor Intelligence | |||
Presence of lactose intolerant population
India's genetic predisposition to lactose intolerance creates a significant and consistent demand for dairy alternatives. This condition, known as lactase non-persistence, leads many individuals to experience gastrointestinal discomfort when consuming conventional dairy products. In 2025, approximately 60% of India's population suffered from lactose intolerance, according to the India Brand Equity Foundation[1]Source: India Brand Equity Foundation, "Dairy Alternatives in India", ibef.org. Plant-based alternatives, such as oat, almond, and soy milk, completely eliminate lactose, making them functional and practical substitutes rather than mere lifestyle preferences. The long-term growth of this segment is driven by the hereditary nature of lactose intolerance, ensuring sustained demand. As awareness of these dairy-friendly alternatives expands, their adoption is expected to grow beyond urban early adopters into Tier-2 and Tier-3 markets, where traditional dairy has historically dominated, often masking the widespread prevalence of lactose intolerance.
Youth shifting toward vegan, flexitarian diets
Millennials and Gen Z consumers, primarily those under the age of 44, are significantly influencing dietary norms by embracing a flexitarian approach to plant-based dairy consumption. This approach involves incorporating plant-based products alongside traditional dairy rather than completely replacing it. According to data from the India Brand Equity Foundation, approximately 9% of Indians adopted vegan diets in 2025[2]Source: India Brand Equity Foundation, "Dairy Alternatives in India", ibef.org. This shift is driven more by practicality than by ideological reasons. A considerable portion of Indian plant-based milk consumers continues to use traditional dairy, reserving plant-based alternatives for specific purposes such as preparing morning smoothies, customizing coffee, or aiding post-workout recovery, while relying on conventional dairy for staples like tea and cooking. Social media plays a crucial role in accelerating this transition, with influencers popularizing products like oat milk lattes and almond yogurt bowls as symbols of an aspirational lifestyle. However, the widespread adoption of these products faces challenges, as the medium-term impact depends on the time required for consumers to form new habits and for retail availability to expand. Currently, these products are primarily found in upscale metro cafes, and their penetration into neighborhood grocery stores remains limited, especially in a market where traditional kirana channels still dominate FMCG transactions.
Social media, influencers promote plant diets
Digital platforms have shortened the timeline from awareness to trial for plant-based dairy products. Influencers on Instagram and YouTube simplify product usage by sharing recipe demonstrations. In India, where Amul's cooperative model has built dairy credibility over 75 years, influencer marketing is particularly impactful. It helps overcome the trust gap that new brands often face. Short-form videos featuring taste comparisons, nutritional insights, and sustainability metrics are persuading consumers who previously viewed plant-based options as niche or medicinal. Social media's rapid influence is clear: a viral post can increase sales by 20-30% within weeks. However, sustained adoption depends on repeat purchases, which are driven by taste satisfaction and price competitiveness. As health and wellness content becomes increasingly monetized on these platforms, plant-based dairy brands are leveraging a cost-effective advertising channel that outperforms traditional FMCG strategies reliant on TV and print media.
Preference towards managing heart health, diabetes
India faces a dual challenge of undernutrition and increasing lifestyle diseases, driving demand for functional foods that help manage chronic conditions without relying on pharmaceuticals. According to the International Diabetes Federation, diabetes prevalence among Indian adults reached 10.5% in 2024[3]Source: International Diabetes Federation, "India Key information", idf.org. Almond and oat milks, with their low glycemic index, cholesterol-free composition, and fortification with calcium and vitamin D, align with recommendations from cardiologists and endocrinologists, enhancing their appeal among at-risk groups. These products are classified as having a long-term impact due to the sustained nature of chronic disease management. For example, once a diabetic individual adopts unsweetened almond milk, it often becomes a habitual purchase rather than a discretionary one. As India's healthcare system shifts focus from treatment to prevention, government nutrition programs and insurance incentives could potentially subsidize plant-based alternatives for high-risk populations, further integrating these products into mainstream consumption.
Restraints Impact Analysis*
| Restraint | (~) % Impact on CAGR Forecast | Geographic Relevance | Impact Timeline |
|---|---|---|---|
| Shorter shelf life compared to UHT dairy | -1.4% | Tier-2 and Tier-3 cities with inadequate cold-chain infrastructure | Medium term (2-4 years) |
| Taste, texture often inferior to cow's milk | -1.9% | Pan-India, particularly among first-time users and traditional dairy consumers | Short term (≤ 2 years) |
| Labeling laws restrict use of "milk" terms | -0.8% | National, with compliance burden on manufacturers and HoReCa segments | Short term (≤ 2 years) |
| Poor cold chain outside metro cities | -1.6% | Tier-2, Tier-3 cities and rural areas with limited refrigerated logistics | Long term (≥ 4 years) |
| Source: Mordor Intelligence | |||
Shorter shelf life compared to UHT dairy
Fresh plant-based dairy products, especially refrigerated almond, cashew, and oat milk, boast a shelf life of just 7-10 days. In contrast, UHT dairy enjoys a longevity of 6-12 months. This disparity introduces inventory risks and complicates distribution, limiting retail adoption primarily to metropolitan areas. Although aseptic carton packaging can extend the ambient shelf life of plant-based products to rival that of traditional dairy, it comes with a hefty price tag. Tetra Pak lines, essential for this packaging, process around 10 billion packs annually in India. However, this capacity is largely monopolized by established dairy brands. Meanwhile, emerging players like Goodmylk and Raw Pressery are carving a niche for themselves, focusing on fresh and minimally processed formats to stand out in terms of taste and nutrition. This challenge is felt most acutely in Tier-2 and Tier-3 cities. Here, temperature fluctuations during last-mile delivery can render products unsellable. While logistics providers and retailers are actively investing in cold-chain solutions, achieving infrastructure parity with metropolitan areas is still 3-4 years down the line.
Taste, texture often inferior to cow's milk
Sensory acceptance continues to be a major challenge for adoption, with 60-70% of surveyed consumers identifying taste and texture issues as reasons for avoiding purchase or discontinuing trials. The unique characteristics of plant-based milks, such as almond's nuttiness, soy's beany notes, and oat's viscosity, differ significantly from the neutral, creamy profile of dairy. This dairy profile has been a dietary mainstay for Indians in tea, coffee, and cooking for generations. Technologies like enzyme-assisted extraction and ultrasonication improve mouthfeel but increase processing costs. Brands must either absorb these costs or pass them on to consumers, who already pay premiums 2-3 times higher. While fortification with calcium, vitamin D, and B12 ensures nutritional equivalence, it cannot replicate dairy's casein protein structure, which is essential for foam stability in coffee and creaminess in desserts. The short-term impact classification highlights the industry's fast-paced innovation. For example, in April 2024, Epigamia launched a dairy-free coconut yogurt with improved texture achieved through probiotic fermentation. Similarly, brands like Urban Platter and One Good are utilizing millet-based formulations, capitalizing on the natural creaminess of native grains to enhance sensory appeal.
*Our forecasts treat driver/restraint impacts as directional, not additive. The impact forecasts reflect baseline growth, mix effects, and variable interactions.
Segment Analysis
By Product Type: Non-Dairy Milk Anchors Volume While Butter Accelerates Premiumization
In 2025, Non-Dairy Milk led India's dairy alternative market, holding a significant 77.36% share. Soy variants, providing 7 g of protein per 250 ml, match cow's milk in nutrition, making them popular among fitness-focused consumers. BigBasket offers almond drinks priced between INR 136 and INR 520 per liter, catering to urban consumers with aesthetic preferences. Oat milk gained traction after Tata partnered with Starbucks, ensuring local processors met barista foaming requirements. Additionally, coconut, cashew, hemp, and hazelnut options bring niche variety, while millet-based products utilize the country's grain surplus and align with the government's "Atmanirbhar" initiative.
Non-Dairy Butter is projected to grow at a strong 10.26% CAGR, surpassing the overall growth of the Indian dairy alternative market, driven by increasing demand for lactose-free spreads in bakeries and food services. With margins reaching 40-50%, far exceeding milk's mid-20s, research and development efforts are focusing on enzyme-clarified nut oils that replicate dairy butter's baking stability. Although substitutes for cheese, yogurt, and desserts are still in the early stages, advancements in fermenting cashew and almond bases are narrowing flavor gaps, indicating potential for greater market share in the future.


By Packaging Type: Ambient Cartons Dominate, PET Captures Fresh Segment
In 2025, cartons accounted for 58.74% of the packaging market, supported by Tetra Pak's aseptic technology. This technology provides products with a 6-12 month shelf life at ambient temperatures, which is advantageous in areas with limited cold-chain infrastructure. Tetra Pak's initiative to achieve 70% renewable materials by 2030, using plant-based polymers derived from sugarcane, highlights the carton format's sustainability. This aligns with corporate ESG objectives and increasing consumer environmental awareness. However, the opacity of cartons presents a drawback, as consumers cannot visually assess product freshness. Premium brands address this issue by using transparent PET bottles. Cans, holding a smaller market share, cater to niche applications such as single-serve coconut milk for cooking or protein shakes. The "Others" category, including pouches and glass bottles, is preferred by artisanal brands targeting eco-conscious consumers.
Between 2026 and 2031, PET bottles are expected to grow at a strong 10.89% CAGR. This growth is driven by consumer preference for transparent packaging, which conveys freshness and quality, particularly for refrigerated products that command premium prices. Brands like Goodmylk and Raw Pressery leverage this trend by exclusively using PET for their chilled almond and cashew milk products, positioning transparency as a marker of trust. Additionally, PET's recyclability is a key factor. India's plastic waste management regulations, which require 100% collection and recycling of PET bottles by 2025, address environmental concerns. PET also offers practical benefits, such as being lightweight and shatter-resistant, which cartons lack. The format's increasing adoption is further supported by the growth of e-commerce. PET's durability reduces breakage during last-mile deliveries, an essential factor for rapid delivery platforms like Blinkit and Zepto, which promise delivery within 10-15 minutes.
By Distribution Channel: Kirana Networks Sustain Off-Trade, Cafes Drive On-Trade
In 2025, off-trade channels accounted for 97.23% of the market share, highlighting India's FMCG distribution structure. A significant portion of transactions occurs through grocery stores, which, despite lacking refrigeration, remain key consumer touchpoints. Supermarkets and hypermarkets, such as Reliance Fresh, DMart, Spencer's, and More, offer refrigerated shelf space and product visibility that grocery stores cannot provide. However, their influence is limited, given their 8-10% share of the FMCG market. These organized retailers are not merely selling but also curating. By dedicating sections to health and wellness, particularly plant-based dairy, and cross-merchandising with organic produce and gluten-free staples, they validate these categories. Meanwhile, online platforms like BigBasket, Amazon, Blinkit, and Zepto captured a 5-6% share of FMCG sales in 2025. Plant-based dairy has seen higher traction in this channel, driven by urban, digitally savvy, and health-conscious consumers. Quick-commerce platforms, with their 10-15 minute delivery windows, have eliminated the need to commute to specialty stores. This convenience has encouraged impulse purchases, converting awareness into first-time usage. Convenience stores, such as petrol pump outlets and metro station kiosks, cater to grab-and-go needs but remain underutilized due to limited SKU space and a focus on high-turnover products. Other channels, including direct-to-consumer subscriptions, corporate pantries, and institutional catering, are emerging as alternatives to traditional trade. However, these models require scaling to achieve economic viability.
On-trade channels are projected to grow at a strong 10.56% CAGR from 2026 to 2031, driven by the expansion of cafes and the adoption of plant-based milk as a standard customization in quick-service restaurants (QSRs). QSR chains like McDonald's, Burger King, and Subway are piloting plant-based options in select metropolitan areas. However, full menu integration depends on achieving cost parity and ensuring supply chain reliability. Hotels and corporate cafeterias, while high-volume and low-visibility channels, are increasingly adopting plant-based dairy through bulk procurement contracts that prioritize allergen-free and dietary compliance. The faster growth of the on-trade segment highlights its role in driving consumer trials. For example, a consumer who tries oat milk in a cafe latte is likely to seek the same brand in grocery stores, creating a positive cycle that the off-trade segment alone cannot generate.
Geography Analysis
In India, metropolitan clusters such as Delhi-NCR, Mumbai, Bengaluru, Hyderabad, and Chennai significantly contribute to the country's dairy alternative market revenue. This growth is driven by factors including higher disposable incomes, a dense network of cafés, and widespread access to e-commerce platforms. Consumers in these metropolitan areas spend an average of over INR 3,000 annually on dairy alternatives, which is more than double the national average. This spending pattern highlights the ability of these cities to sustain premium pricing. The presence of well-established cold-chain infrastructure in these regions supports the success of refrigerated almond and cashew-based products. These offerings are complemented by ambient soy and oat-based cartons, which are widely available in local kirana stores, ensuring accessibility and convenience for consumers.
Tier-2 cities, including Pune, Ahmedabad, Kochi, and Jaipur, are emerging as the next growth frontier for the dairy alternative market. In these cities, the share of organized retail is steadily approaching 15%, while the café culture is gaining popularity, particularly among young professionals. Ambient cartons are gaining traction among early adopters in these regions due to their cost-effective distribution. Additionally, PET packaging formats are being introduced selectively, primarily through modern trade outlets located in shopping malls. Municipalities are increasingly supporting the adoption of PET packaging, driven by sustainability goals. This shift is encouraged by the imposition of taxes on single-use plastics and the provision of incentives for using recycled PET, which align with broader environmental objectives.
Rural and Tier-3 regions, which collectively account for over 900 million inhabitants, remain largely untapped in the dairy alternative market. The primary barriers in these areas include the lack of cold-chain infrastructure and the high price sensitivity of consumers. In these regions, fortified soy-based drinks, priced at approximately INR 40 for a 200 ml sachet, are catering to the needs of lactose-intolerant consumers who cannot afford more expensive nut-based beverages. Government initiatives, such as mid-day meal programs and public distribution schemes, are exploring the potential of incorporating plant-protein fortification to address nutritional gaps. However, unlocking the latent demand in these areas will depend on achieving cost parity with traditional options and ensuring a reliable and efficient supply chain to meet consumer needs.
Competitive Landscape
The Indian dairy alternatives market is moderately fragmented, with established players leveraging distribution networks, brand recognition, and innovation to maintain their competitive edge. This market concentration not only allows for sustained investment in product development and supply chain optimization but also erects barriers for new entrants who lack the advantages of scale economies. While no single firm commands more than a 15% revenue share, the landscape remains moderately fragmented. Here, the heft of marketing and processing scale competes with the allure of niche authenticity. A testament to this trend, Tata's discussions in December 2025 to acquire Danone India's nutrition division signal a potential consolidation wave. This move promises to synergize Tata's expansive reach of 1.5 million retail points with Danone's expertise in the Alpro brand.
Startups are carving out their niche by offering cold-pressed, minimally processed products and direct-to-consumer subscription models. Goodmylk, for instance, has made significant strides with a rapid expansion into 50 cities, now reaping 25-30% of its sales from this quick-commerce initiative, effectively sidestepping the wholesale margin squeeze. Meanwhile, Akshayakalpa's impressive INR 350 crore fundraising round highlights the confidence investors have in the farm-to-fork model, emphasizing vertical integration.
Research and development efforts are intensely focused on areas like taste masking, protein texturization, and fortifying products with calcium and vitamin D. Brands are pouring resources into techniques like ultrasonication, enzyme hydrolysis, and fermentation, all aimed at mimicking the mouthfeel of dairy. Processors, on the other hand, are deliberating between cartoning and rPET options, striving to strike a balance between shelf life and sustainability. Even with premium SKUs, a price disparity of 2-3 times that of dairy limits adoption to the top urban decile. As a result, many players are gravitating towards volume-driven portfolios of soy and oat products, catering to the entry-level consumers in India's burgeoning dairy alternative market.
India Dairy Alternatives Industry Leaders
-
Tata Consumer Products Limited
-
Oatly Group AB
-
Nestlé SA
-
Danone SA
-
Raw Pressery
- *Disclaimer: Major Players sorted in no particular order

Recent Industry Developments
- June 2025: Country Delight, an Indian dairy and grocery brand, has made its debut in the plant-based drink sector with a novel milk alternative. The product, branded as Oat Beverage, is crafted from Australian oats and boasts a formulation devoid of chemical additives, preservatives, and added sugars. Additionally, the beverage is free from soy and nuts, and is produced in a facility with stringent allergen controls to mitigate cross-contamination risks.
- September 2024: Maiva Fresh has unveiled its flagship product - Unsweetened Almond Milk. The brand, "Maiva Fresh," promotes its new health drink range with the tagline "Pure Good" (emphasizing health) and "Pure Joy" (highlighting taste), effectively merging the concepts of health and flavor. The Maiva Fresh Almond Milk boasts zero cholesterol, a low glycemic index, and fortification with Vitamins B12 and D, making it ideal for daily consumption.
- September 2024: Recognizing a growing demand for dairy alternatives, 1.5 Degree, an innovative start-up, has rolled out a diverse lineup of plant-based dairy products. Their offerings span from oat and soy milk to cold coffee, flavored milkshakes, and gelato, boasting unique flavors like paan, Belgian chocolate, strawberry, Biscoff, and mocha almond fudge. The emphasis lies on delivering products that are not only taste-centric and healthy but also lactose-free.


India Dairy Alternatives Market Report Scope
Dairy alternative refers to products, such as milks, cheeses, and yogurts, that are made without dairy from animal milk and are used as a substitute. The market is segmented by product type, packaging type, and distribution channel. By type, the market is segmented into non-dairy desserts, non-dairy cheese, non-dairy butter, non-dairy milk, non-dairy yogurt, and others. The non-dairy milk segment is further segmented into oat, hemp, hazelnut, soy, almond, coconut, cashew. By packaging type, it is divided into PET bottles, cans, cartons, and others. By distribution channel, it is segmented into off-trade and on-trade. The off-trade segment is further segmented into convenience stores, supermarkets and hypermarkets, online retail stores, and other distribution channels. The market forecasts are provided in terms of value (USD) and volume (tons) for all the above segments.
| Non-Dairy Milk | Oat Milk |
| Hemp Milk | |
| Hazelnut Milk | |
| Soy Milk | |
| Almond Milk | |
| Coconut Milk | |
| Cashew Milk | |
| Non-Dairy Cheese | |
| Non-Dairy Butter | |
| Non-Dairy Desserts | |
| Non-Dairy Yogurt | |
| Others |
| PET Bottles |
| Cans |
| Cartons |
| Others |
| On-trade | |
| Off-trade | Convenience Stores |
| Supermarkets and Hypermarkets | |
| Online Retail Stores | |
| Other Distribution Channel |
| By Product Type | Non-Dairy Milk | Oat Milk |
| Hemp Milk | ||
| Hazelnut Milk | ||
| Soy Milk | ||
| Almond Milk | ||
| Coconut Milk | ||
| Cashew Milk | ||
| Non-Dairy Cheese | ||
| Non-Dairy Butter | ||
| Non-Dairy Desserts | ||
| Non-Dairy Yogurt | ||
| Others | ||
| Packaging Type | PET Bottles | |
| Cans | ||
| Cartons | ||
| Others | ||
| Distribution Channel | On-trade | |
| Off-trade | Convenience Stores | |
| Supermarkets and Hypermarkets | ||
| Online Retail Stores | ||
| Other Distribution Channel | ||


Market Definition
- Dairy Alternatives - Dairy alternatives are foods that are made from plant-based milk/oils instead of their usual animal products, such as cheese, butter, milk, ice cream, yogurt, etc. Plant-based or non-dairy milk alternative is the fast-growing segment in the newer food product development category of functional and specialty beverage across the globe.
- Non-Dairy Butter - Non dairy butter is a vegan butter alternative that is made from a mixture of plant oils. With an increase in alternative diets like vegetarianism, veganism, and gluten intolerance, plant butter is a healthy non-dairy substitute for normal butter.
- Non-Dairy Ice Cream - Plant based ice cream is a growing category. Non-dairy ice cream is a type of dessert made without any animal ingredients. This is typically considered a substitute for regular ice cream for those who cannot or do not eat animal or animal-derived products, including eggs, milk, cream, or honey.
- Plant-Based Milk - Plant based milks are milk substitutes that are made from nuts (e.g., hazelnuts, hemp seeds), seeds (e.g., sesame, walnuts, coconuts, cashews, almonds, rice, oats, etc.) or legumes (e.g., soy). Plant-based milk such as soy milk and almond milk have been popular in East Asia and the Middle East for centuries.
| Keyword | Definition |
|---|---|
| Cultured Butter | Cultured butter is prepared by having the raw butter go through chemical processing and has been added with certain emulsifiers and foreign ingredients. |
| Uncultured Butter | This type of butter is one which has not been processed in any way |
| Natural Cheese | The type of cheese in its most natural form. It is made from natural and simple products and ingredients, including fresh and natural salts, natural colors, enzymes, and high-quality milk. |
| Processed Cheese | Processed cheese undergoes the same processes as natural cheese; however, it requires more steps and many different forms of ingredients. Making processed cheese involves melting natural cheese, emulsifying it, and adding preservatives and other artificial ingredients or colorings. |
| Single Cream | Single cream contains around 18% fat. It’s a single layer of cream that appears over boiled milk. |
| Double Cream | Double cream contains 48% fat, more than double the amount of fat of single cream. It’s heavier and thicker than single cream |
| Whipping Cream | This has a much higher fat percentage than single cream (36%). Used to top cakes, pies, and puddings and as a thickener for sauces, soups, and fillings. |
| Frozen Desserts | Desserts that are meant to be eaten in frozen condition. E.g., sherbets, sorbets, frozen yogurts |
| UHT Milk (Ultra-high temperature milk) | Milk heated at a very high temperature. Ultra-high-temperature processing (UHT) of milk involves heating for 1–8 sec at 135–154°C. which kills the spore-forming pathogenic microorganism, resulting in a product with a shelf-life of several months. |
| Non-dairy butter/Plant-based butter | Butter made from plant-derived oil such as coconut, palm, etc. |
| Non-dairy Yogurt | Yogurt made from typically made from nuts, like almonds, cashews, coconuts, and even other foods like soybeans, plantains, oats, and peas |
| On-trade | It refers to restaurants, QSRs, and bars. |
| Off-trade | It refers to supermarkets, hypermarkets, on-line channels, etc. |
| Neufchatel cheese | One of the oldest kinds of cheese in France. It is a soft, slightly crumbly, mold-ripened, bloomy-rind cheese made in the Neufchâtel-en-Bray region of Normandy. |
| Flexitarian | It refers to a consumer preferring a semi-vegetarian diet, that is centered on plant foods with limited or occasional inclusion of meat. |
| Lactose Intolerance | Lactose intolerance is a reaction in digestive system to lactose, the sugar in milk. It causes uncomfortable symptoms in response to the consumption of dairy products. |
| Cream Cheese | Cream cheese is a soft and creamy fresh cheese with a tangy taste made from milk and cream. |
| Sorbets | Sorbet is a frozen dessert made using ice combined with fruit juice, fruit purée, or other ingredients, such as wine, liqueur, or honey. |
| Sherbet | Sherbet is a sweetened frozen dessert made with fruit and some sort of dairy product such as milk or cream. |
| Shelf stable | Foods that can be safely stored at room temperature, or "on the shelf," for at least one year and do not have to be cooked or refrigerated to eat safely. |
| DSD | Direct Store Delivery is the process in supply chain management wherein the product is delivered from manufacturing plant directly to the retailer. |
| OU Kosher | Orthodox Union Kosher is a kosher certification agency based in New York City. |
| Gelato | Gelato is a frozen creamy dessert made with milk, heavy cream and sugar. |
| Grass-fed Cows | Grass-fed cows are allowed to graze in pastures, where they eat a variety of grasses and clover. |


Research Methodology
Mordor Intelligence follows a four-step methodology in all our reports.
- Step-1: Identify Key Variables: In order to build a robust forecasting methodology, the variables and factors identified in Step 1 are tested against available historical market numbers. Through an iterative process, the variables required for market forecast are set, and the model is built on the basis of these variables.
- Step-2: Build a Market Model: Market-size estimations for the forecast years are in nominal terms. Inflation is not a part of the pricing, and the average selling price (ASP) is kept constant throughout the forecast period for each country.
- Step-3: Validate and Finalize: In this important step, all market numbers, variables, and analyst calls are validated through an extensive network of primary research experts from the market studied. The respondents are selected across levels and functions to generate a holistic picture of the market studied.
- Step-4: Research Outputs: Syndicated Reports, Custom Consulting Assignments, Databases & Subscription Platforms


