Market Overview
| Study Period | 2017 - 2030 |
|---|---|
| Forecast Data Period | 2025 - 2030 |
| Historical Data Period | 2017 - 2023 |
| Market Size (2025) | USD 11.3 Billion |
| Market Size (2030) | USD 17.02 Billion |
| Growth Rate (2025 - 2030) | 8.54% CAGR |
| Market Concentration | Low |
Major Players*Disclaimer: Major Players sorted in no particular order Image © Mordor Intelligence. Reuse requires attribution under CC BY 4.0. | |

Asia-Pacific Dairy Alternatives Market Analysis by Mordor Intelligence
The Asia-Pacific Dairy Alternatives Market size is estimated at 11.3 billion USD in 2025, and is expected to reach 17.02 billion USD by 2030, growing at a CAGR of 8.54% during the forecast period (2025-2030).
The Asia-Pacific dairy alternatives market is experiencing significant transformation in its distribution landscape, with off-trade channels dominating the sales ecosystem. Supermarkets and hypermarkets have emerged as the primary distribution channels, accounting for 66.7% of the off-trade value share in 2022, leveraging their extensive reach and product variety to influence consumer purchasing decisions. The online retail segment is gaining momentum, with projections indicating a year-over-year growth of 4.6% during 2023-2025, driven by increasing digital adoption and consumer preference for convenience. The evolution of distribution channels reflects a broader shift in retail dynamics, with traditional and modern trade channels adapting to changing consumer shopping behaviors.
Consumer preferences in the region are increasingly shifting towards dairy-free and plant-based milk alternatives, with plant-based milk products dominating the market landscape and accounting for over 85% of the off-trade value share in 2022. This trend is particularly pronounced among millennial consumers who are driving demand for innovative dairy alternatives products. The market is witnessing a notable increase in health-conscious consumers seeking products with enhanced nutritional profiles, especially in developed markets where calcium deficiency is a concern, with over 50% of Australians aged two and older not getting adequate calcium intake.
Product innovation and diversification are reshaping the market landscape, with manufacturers focusing on developing new flavors, formats, and functional benefits to meet evolving consumer preferences. The industry is witnessing significant investments in research and development to improve the taste, texture, and nutritional profiles of dairy alternatives. Companies are expanding their product portfolios beyond traditional soy and almond-based products to include innovative dairy alternative ingredients such as oats, cashews, and hemp, catering to diverse consumer preferences and dietary requirements. The market is also seeing increased emphasis on clean label products and sustainable packaging solutions.
Regional market dynamics are being influenced by growing awareness of plant-based nutrition and increasing adoption of vegetarian and vegan lifestyles. India has emerged as a significant market for milk alternatives, with the country recording the world's third-highest participation in the Veganuary campaign, attracting around 60,000 participants in 2021. The market is witnessing increased penetration of global brands through strategic partnerships with local retailers, particularly in developed markets like China, Japan, and Australia. These partnerships are facilitating broader product availability and consumer access to international alternative dairy products brands, while also driving innovation in local product offerings.
Asia-Pacific Dairy Alternatives Market Trends and Insights
The consumption of dairy alternatives is on the rise across the region owing to a significant rise in the vegan population, coupled with a growing lactose-intolerant population
- The consumption of dairy alternatives is on the rise across the region owing to a significant rise in the vegan population, coupled with a growing lactose-intolerant population. In 2021, around 2.5 million people in South Korea followed a vegan diet. This has since increased significantly in the following two years and continues to grow. Similarly, Australia has the third-highest percentage of vegans per capita globally.
- Lactose intolerance is common in Asian countries, particularly in East Asia, where nearly 70-100% of the population has lactose intolerance. Cow milk allergy is one of the common food allergies in young children. Many Japanese consumers are lactose-intolerant and do not consume milk or milk products. As of 2022, in Australia, around one in 50 babies and young children showed signs of an allergy to cow's milk. Therefore, the demand for plant-based dairy products has increased gradually across the region.
- Among dairy alternatives, plant-based milk like soy and almond milk held the majority share across the regional market in 2022. China is the leading country across the region in terms of consumption of dairy alternatives milk. Among plant-based milk, soy drinks have traditionally been the most popular in China due to the country's long-standing tradition of soy consumption and its wide availability. In the Asia-Pacific region, the per capita consumption of non-dairy butter is estimated to increase by 3.45% in 2023-2024. The key motivations for consumers to adopt non-dairy butter are growing concerns for animals and sustainability, followed by a healthier change in dietary habits.


OTHER KEY INDUSTRY TRENDS COVERED IN THE REPORT
- Production of non-dairy ingredients supported by the utilization of innovative sources for different products
Segment Analysis: Category
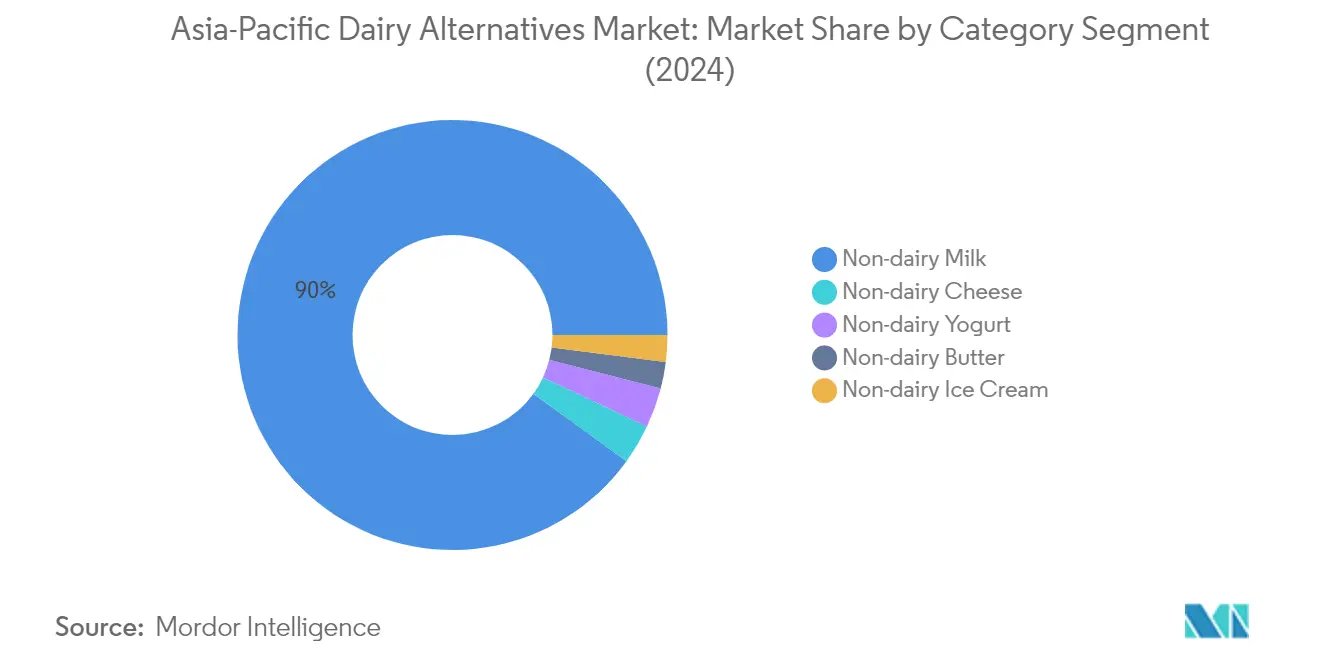
Non-Dairy Milk Segment in Asia-Pacific Dairy Alternatives Market
Non-dairy milk dominates the Asia-Pacific dairy alternatives market, accounting for approximately 90% of the total market share in 2024. This substantial market presence is primarily driven by increasing health consciousness among consumers and rising cases of lactose intolerance in the region. The segment's growth is particularly notable in countries like China, Japan, and Australia, where consumers are increasingly adopting plant milk alternatives as part of their daily diet. Soy milk leads the non-dairy milk category with around 56% market penetration, followed by growing demand for almond milk and oat milk variants. The segment's strong performance is further supported by extensive distribution networks through supermarkets and convenience stores, making these products easily accessible to consumers across the region.

Non-Dairy Cheese Segment in Asia-Pacific Dairy Alternatives Market
The vegan cheese segment is emerging as the most dynamic category in the Asia-Pacific dairy alternatives market, projected to experience rapid growth during 2024-2029. This exceptional growth trajectory is driven by increasing consumer awareness about dairy-free alternatives and the expanding vegan population across the region. Markets in India, China, and Japan are in the development stage, with Australia experiencing particularly strong growth in the vegan cheese category. The segment's expansion is supported by continuous product innovations, with manufacturers introducing various flavors and textures to match traditional cheese alternatives. The growth is further accelerated by the rising adoption of vegan diets, particularly in Australia, which has witnessed a significant increase in its vegan population over recent years.
Remaining Segments in Category
The other segments in the Asia-Pacific dairy alternatives market include non-dairy butter, non-dairy ice cream, and non-dairy yogurt, each contributing uniquely to the market's diversity. Non-dairy butter has gained traction among health-conscious consumers seeking dairy substitutes with lower saturated fat content. The non-dairy ice cream segment has shown promising growth, particularly in Australia, where consumers are increasingly demanding innovative flavors and healthier dessert options. Non-dairy yogurt has emerged as a significant segment, especially in Japan and South Korea, where probiotic-rich plant-based alternatives are gaining popularity. These segments collectively demonstrate the market's evolution in meeting diverse consumer preferences and dietary requirements across the region.
Segment Analysis: Distribution Channel
Off-Trade Segment in Asia-Pacific Dairy Alternatives Market
The off-trade distribution channel dominates the Asia-Pacific dairy alternatives market, accounting for approximately 84% of the total market volume in 2024. This channel encompasses supermarkets, hypermarkets, convenience stores, online retailers, and specialist stores, providing consumers with diverse options for purchasing dairy substitutes products. Supermarkets and hypermarkets lead the off-trade segment, offering strategic product positioning and extensive shelf space for dairy alternatives. The segment's growth is driven by the increasing penetration of international brands, aggressive expansion of retail chains, and rising consumer preference for organized retail formats. The convenience of comparing products, availability of multiple brands, and frequent promotional offers make off-trade channels particularly attractive to consumers. Additionally, the rapid development of e-commerce platforms and increasing internet penetration across the region have significantly boosted online sales of dairy alternatives through off-trade channels.
On-Trade Segment in Asia-Pacific Dairy Alternatives Market
The on-trade channel, comprising restaurants, cafes, and other foodservice outlets, represents a growing segment in the Asia-Pacific dairy alternatives market. This segment is witnessing increased adoption as more foodservice establishments incorporate alternative protein options into their menus, particularly in beverages like coffee, tea, and smoothies. Major coffee chains across the region are expanding their plant-based menu options, with leading establishments like Starbucks and Costa Coffee offering various vegan dairy alternatives for their beverages. The segment's growth is particularly notable in urban areas where there is a rising trend of dining out and increasing consumer demand for plant-based options in restaurants. The on-trade channel is also benefiting from the growing popularity of specialty coffee shops and cafes that cater to health-conscious consumers and those following plant-based diets.
Asia-Pacific Dairy Alternatives Market Geography Segment Analysis
Dairy Alternatives Market in China
China dominates the Asia Pacific dairy market, holding approximately 49% of the regional market value in 2024. The country's dairy alternatives market is primarily driven by the increasing prevalence of milk allergies and growing consumer awareness about the health benefits of plant-based alternatives. The market penetration of global brands through strategic partnerships with supermarkets and hypermarkets has significantly influenced Chinese consumers to opt for alternative dairy milk and cheese products. Soy milk is widely preferred among Chinese consumers, reflecting traditional dietary preferences and cultural familiarity with soy-based products. The emergence of innovative distribution channels, particularly the rapid growth of online retail platforms, has enhanced product accessibility across both urban and rural areas. The country's major cities, including Beijing, Hong Kong, and Shanghai, have witnessed a substantial increase in supermarkets stocking vegan products, while restaurants increasingly incorporate dairy alternatives into their menus. The government's supportive stance towards the plant-based industry, including the development of food standards and safety regulations, has created a conducive environment for market growth.
Dairy Alternatives Market in New Zealand
New Zealand's dairy alternatives market is experiencing remarkable growth, projected to expand at approximately 12% annually from 2024 to 2029. The market's robust growth is driven by increasing health consciousness and rising demand for vegan options among consumers. The country has witnessed significant investments in plant-based milk production facilities, demonstrating strong industry confidence in future market potential. The government's proactive approach in supporting dairy alternative companies through strategic investments has created a favorable environment for market expansion. Local manufacturers are focusing on product innovation and developing unique plant-based formulations to cater to evolving consumer preferences. The country's well-established agricultural infrastructure is being leveraged to support the production of raw materials for dairy alternatives, particularly oat milk and other plant-based ingredients. The retail landscape has evolved to accommodate the growing demand, with major supermarket chains expanding their dairy alternative product offerings and dedicated shelf space. Consumer education initiatives and marketing campaigns have successfully raised awareness about the environmental and health benefits of dairy alternatives, contributing to market growth.
Dairy Alternatives Market in Japan
Japan's dairy alternatives market demonstrates strong potential, driven by the country's health-conscious consumer base and growing interest in plant-based nutrition. The market is characterized by sophisticated consumer preferences and demand for high-quality, innovative products. Japanese consumers show particular interest in soy-based products, reflecting the country's long-standing cultural connection with soy-based foods. The market has witnessed significant product innovations, with manufacturers introducing various flavors and formulations to cater to local tastes. The country's well-developed retail infrastructure, particularly convenience stores and supermarket chains, plays a crucial role in product distribution and accessibility. Japanese manufacturers emphasize product quality and safety, implementing rigorous standards in production processes. The foodservice sector, especially coffee shops and restaurants, has embraced dairy alternatives, incorporating them into various beverages and dishes. The market benefits from strong research and development capabilities, leading to continuous product improvements and new launches.
Dairy Alternatives Market in Australia
Australia's dairy alternatives market showcases strong momentum, supported by increasing consumer awareness and changing dietary preferences. The country's robust retail infrastructure and well-established distribution networks facilitate widespread product availability. Australian consumers demonstrate growing interest in plant-based products, driven by health consciousness and environmental concerns. The market benefits from strict quality standards and regulations, ensuring product safety and reliability. Local manufacturers focus on developing innovative products using locally sourced ingredients, particularly almonds and oats. The coffee culture in Australia has significantly influenced the adoption of dairy alternatives, with barista-specific plant-based products gaining popularity. Supermarket chains play a crucial role in market growth by offering extensive product ranges and private label options. The country's strong agricultural sector provides opportunities for local sourcing of raw materials, supporting domestic production of dairy alternatives. Consumer education and marketing initiatives have successfully promoted the benefits of dairy alternatives, contributing to market expansion.
Dairy Alternatives Market in Other Countries
The Asia Pacific dairy market in other countries, including India, Indonesia, Malaysia, Pakistan, South Korea, and various Southeast Asian nations, demonstrates diverse growth patterns and market characteristics. These markets are influenced by unique cultural preferences, dietary habits, and economic conditions. The increasing awareness of lactose intolerance and health benefits associated with plant-based products drives market growth across these regions. Local manufacturers in these countries focus on developing products tailored to regional tastes and preferences. The expansion of modern retail formats and improving distribution networks enhances product accessibility. Government initiatives promoting healthy eating habits and sustainable food production contribute to market development. The growing influence of Western dietary trends, combined with traditional plant-based food cultures, creates unique market opportunities. These markets benefit from increasing urbanization, rising disposable incomes, and growing health consciousness among consumers.

Competitive Landscape
Top Companies in Asia-Pacific Dairy Alternatives Market
The dairy alternatives market in Asia-Pacific is characterized by continuous product innovation and strategic expansion initiatives by key players. Companies are focusing on developing new plant-based milk varieties, particularly in soy, almond, and oat categories, while also expanding into emerging segments like non-dairy cheese and ice cream. Operational agility is demonstrated through investments in research and development facilities, particularly in countries like China, Japan, and Australia, enabling rapid response to changing consumer preferences. Strategic moves include partnerships with local distributors and retailers to enhance market penetration, while expansion strategies primarily focus on establishing production facilities in high-growth markets. Companies are also emphasizing sustainability certifications, organic ingredients, and clean-label products to differentiate their offerings and capture environmentally conscious consumers.
Mix of Global and Regional Players
The competitive landscape comprises a mix of multinational corporations and regional specialists, with companies like Vitasoy International Holdings, Kikkoman Corporation, and Hebei Yangyuan Zhihui Beverage leading the market. Global players leverage their extensive distribution networks and brand recognition to maintain market position, while regional players capitalize on their understanding of local taste preferences and established relationships with local retailers. The market structure is relatively fragmented, with numerous local players competing in specific geographic regions or product categories.
The industry is witnessing increasing consolidation through strategic acquisitions and partnerships, particularly as global players seek to strengthen their presence in emerging markets. Companies are forming joint ventures with local manufacturers to overcome market entry barriers and gain immediate access to established distribution networks. The competitive dynamics are further shaped by the entry of traditional dairy companies diversifying into alternative dairy products, leading to increased competition and innovation in the sector.
Innovation and Distribution Drive Market Success
Success in the Asia-Pacific dairy alternatives market increasingly depends on companies' ability to innovate across product formulations, packaging, and marketing strategies. Manufacturers need to focus on developing products that cater to local taste preferences while maintaining consistent quality and competitive pricing. Building strong relationships with key distribution channels, particularly supermarkets and convenience stores, is crucial for market success. Companies must also invest in sustainable practices and transparent supply chains to meet growing consumer demands for environmentally responsible products.
Future market leadership will require companies to develop comprehensive digital strategies, including e-commerce presence and social media engagement, to connect with younger consumers. Regulatory compliance, particularly regarding labeling and health claims, will become increasingly important as governments develop stricter guidelines for plant-based products. Companies must also focus on vertical integration and supply chain optimization to maintain cost competitiveness while ensuring product quality. Success will depend on balancing premium positioning with accessibility to capture both health-conscious urban consumers and price-sensitive segments. Additionally, the use of dairy alternative ingredients and dairy replacement strategies will be pivotal in addressing diverse consumer needs.
Asia-Pacific Dairy Alternatives Industry Leaders
Coconut Palm Group Co. Ltd
Hebei Yangyuan Zhihui Beverage Co. Ltd
Kikkoman Corporation
Nestlé SA
Vitasoy International Holdings Ltd
- *Disclaimer: Major Players sorted in no particular order


Recent Industry Developments
- October 2022: Vitasoy International Holdings Ltd planned to expand its dairy alternative business by acquiring the shares from its joint venture Bega Cheese subsidiary National Food Holdings Ltd.
- September 2022: Vitasoy introduced a new product line, Vitasoy Plant+, to its plant milk portfolio. The new product line comprises almond milk and oat milk made from 100% almonds and oats, respectively.
- August 2022: Sanitarium launched a new master brand campaign for its plant-based milk 'So Good' brand.


Asia-Pacific Dairy Alternatives Market Report Scope
Non-Dairy Butter, Non-Dairy Cheese, Non-Dairy Ice Cream, Non-Dairy Milk, Non-Dairy Yogurt are covered as segments by Category. Off-Trade, On-Trade are covered as segments by Distribution Channel. Australia, China, India, Indonesia, Japan, Malaysia, New Zealand, Pakistan, South Korea are covered as segments by Country.Category
| Non-Dairy Milk | Oat Milk |
| Hemp Milk | |
| Hazelnut Milk | |
| Soy Milk | |
| Almond Milk | |
| Coconut Milk | |
| Cashew Milk | |
| Non-Dairy Cheese | |
| Non-Dairy Desserts | |
| Non-Dairy Yogurt | |
| Others |
Packaging Type
| PET Bottles |
| Cans |
| Cartons |
| Others |
Distribution Channel
| Off-Trade | Convenience Stores |
| Online Retail | |
| Specialist Retailers | |
| Supermarkets and Hypermarkets | |
| Others (Warehouse clubs, gas stations, etc.) | |
| On-Trade |
Country
| Australia |
| China |
| India |
| Indonesia |
| Japan |
| Malaysia |
| New Zealand |
| Pakistan |
| South Korea |
| Rest of Asia Pacific |
| Category | Non-Dairy Milk | Oat Milk |
| Hemp Milk | ||
| Hazelnut Milk | ||
| Soy Milk | ||
| Almond Milk | ||
| Coconut Milk | ||
| Cashew Milk | ||
| Non-Dairy Cheese | ||
| Non-Dairy Desserts | ||
| Non-Dairy Yogurt | ||
| Others | ||
| Packaging Type | PET Bottles | |
| Cans | ||
| Cartons | ||
| Others | ||
| Distribution Channel | Off-Trade | Convenience Stores |
| Online Retail | ||
| Specialist Retailers | ||
| Supermarkets and Hypermarkets | ||
| Others (Warehouse clubs, gas stations, etc.) | ||
| On-Trade | ||
| Country | Australia | |
| China | ||
| India | ||
| Indonesia | ||
| Japan | ||
| Malaysia | ||
| New Zealand | ||
| Pakistan | ||
| South Korea | ||
| Rest of Asia Pacific | ||


Market Definition
- Dairy Alternatives - Dairy alternatives are foods that are made from plant-based milk/oils instead of their usual animal products, such as cheese, butter, milk, ice cream, yogurt, etc. Plant-based or non-dairy milk alternative is the fast-growing segment in the newer food product development category of functional and specialty beverage across the globe.
- Non-Dairy Butter - Non dairy butter is a vegan butter alternative that is made from a mixture of plant oils. With an increase in alternative diets like vegetarianism, veganism, and gluten intolerance, plant butter is a healthy non-dairy substitute for normal butter.
- Non-Dairy Ice Cream - Plant based ice cream is a growing category. Non-dairy ice cream is a type of dessert made without any animal ingredients. This is typically considered a substitute for regular ice cream for those who cannot or do not eat animal or animal-derived products, including eggs, milk, cream, or honey.
- Plant-Based Milk - Plant based milks are milk substitutes that are made from nuts (e.g., hazelnuts, hemp seeds), seeds (e.g., sesame, walnuts, coconuts, cashews, almonds, rice, oats, etc.) or legumes (e.g., soy). Plant-based milk such as soy milk and almond milk have been popular in East Asia and the Middle East for centuries.
| Keyword | Definition |
|---|---|
| Cultured Butter | Cultured butter is prepared by having the raw butter go through chemical processing and has been added with certain emulsifiers and foreign ingredients. |
| Uncultured Butter | This type of butter is one which has not been processed in any way |
| Natural Cheese | The type of cheese in its most natural form. It is made from natural and simple products and ingredients, including fresh and natural salts, natural colors, enzymes, and high-quality milk. |
| Processed Cheese | Processed cheese undergoes the same processes as natural cheese; however, it requires more steps and many different forms of ingredients. Making processed cheese involves melting natural cheese, emulsifying it, and adding preservatives and other artificial ingredients or colorings. |
| Single Cream | Single cream contains around 18% fat. It’s a single layer of cream that appears over boiled milk. |
| Double Cream | Double cream contains 48% fat, more than double the amount of fat of single cream. It’s heavier and thicker than single cream |
| Whipping Cream | This has a much higher fat percentage than single cream (36%). Used to top cakes, pies, and puddings and as a thickener for sauces, soups, and fillings. |
| Frozen Desserts | Desserts that are meant to be eaten in frozen condition. E.g., sherbets, sorbets, frozen yogurts |
| UHT Milk (Ultra-high temperature milk) | Milk heated at a very high temperature. Ultra-high-temperature processing (UHT) of milk involves heating for 1–8 sec at 135–154°C. which kills the spore-forming pathogenic microorganism, resulting in a product with a shelf-life of several months. |
| Non-dairy butter/Plant-based butter | Butter made from plant-derived oil such as coconut, palm, etc. |
| Non-dairy Yogurt | Yogurt made from typically made from nuts, like almonds, cashews, coconuts, and even other foods like soybeans, plantains, oats, and peas |
| On-trade | It refers to restaurants, QSRs, and bars. |
| Off-trade | It refers to supermarkets, hypermarkets, on-line channels, etc. |
| Neufchatel cheese | One of the oldest kinds of cheese in France. It is a soft, slightly crumbly, mold-ripened, bloomy-rind cheese made in the Neufchâtel-en-Bray region of Normandy. |
| Flexitarian | It refers to a consumer preferring a semi-vegetarian diet, that is centered on plant foods with limited or occasional inclusion of meat. |
| Lactose Intolerance | Lactose intolerance is a reaction in digestive system to lactose, the sugar in milk. It causes uncomfortable symptoms in response to the consumption of dairy products. |
| Cream Cheese | Cream cheese is a soft and creamy fresh cheese with a tangy taste made from milk and cream. |
| Sorbets | Sorbet is a frozen dessert made using ice combined with fruit juice, fruit purée, or other ingredients, such as wine, liqueur, or honey. |
| Sherbet | Sherbet is a sweetened frozen dessert made with fruit and some sort of dairy product such as milk or cream. |
| Shelf stable | Foods that can be safely stored at room temperature, or "on the shelf," for at least one year and do not have to be cooked or refrigerated to eat safely. |
| DSD | Direct Store Delivery is the process in supply chain management wherein the product is delivered from manufacturing plant directly to the retailer. |
| OU Kosher | Orthodox Union Kosher is a kosher certification agency based in New York City. |
| Gelato | Gelato is a frozen creamy dessert made with milk, heavy cream and sugar. |
| Grass-fed Cows | Grass-fed cows are allowed to graze in pastures, where they eat a variety of grasses and clover. |


Research Methodology
Mordor Intelligence follows a four-step methodology in all our reports.
- Step-1: Identify Key Variables: In order to build a robust forecasting methodology, the variables and factors identified in Step 1 are tested against available historical market numbers. Through an iterative process, the variables required for market forecast are set, and the model is built on the basis of these variables.
- Step-2: Build a Market Model: Market-size estimations for the forecast years are in nominal terms. Inflation is not a part of the pricing, and the average selling price (ASP) is kept constant throughout the forecast period for each country.
- Step-3: Validate and Finalize: In this important step, all market numbers, variables, and analyst calls are validated through an extensive network of primary research experts from the market studied. The respondents are selected across levels and functions to generate a holistic picture of the market studied.
- Step-4: Research Outputs: Syndicated Reports, Custom Consulting Assignments, Databases & Subscription Platforms


