Australia Dairy Alternatives Market Size and Share
Market Overview
| Study Period | 2026 - 2031 |
|---|---|
| Forecast Data Period | 2026 - 2031 |
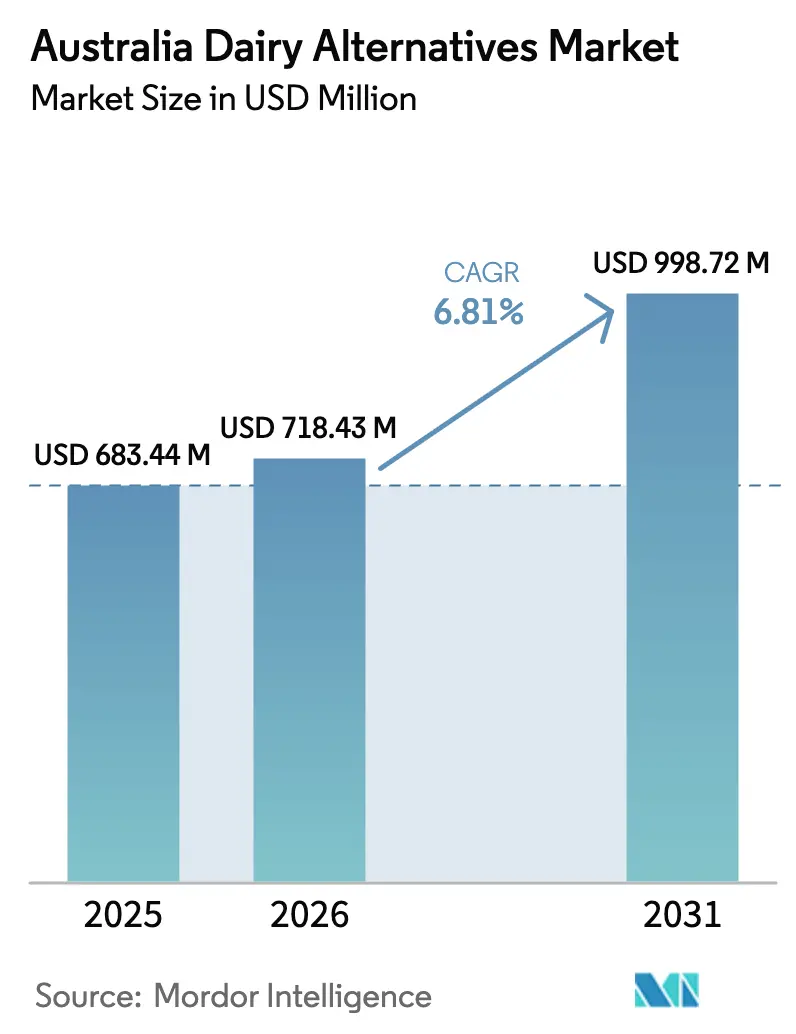
| Base Year Market Size (2025) | USD 683.44 Million |
| Market Size (2026) | USD 718.43 Million |
| Market Size (2031) | USD 998.72 Million |
| Growth Rate (2026 - 2031) | 6.81% CAGR |
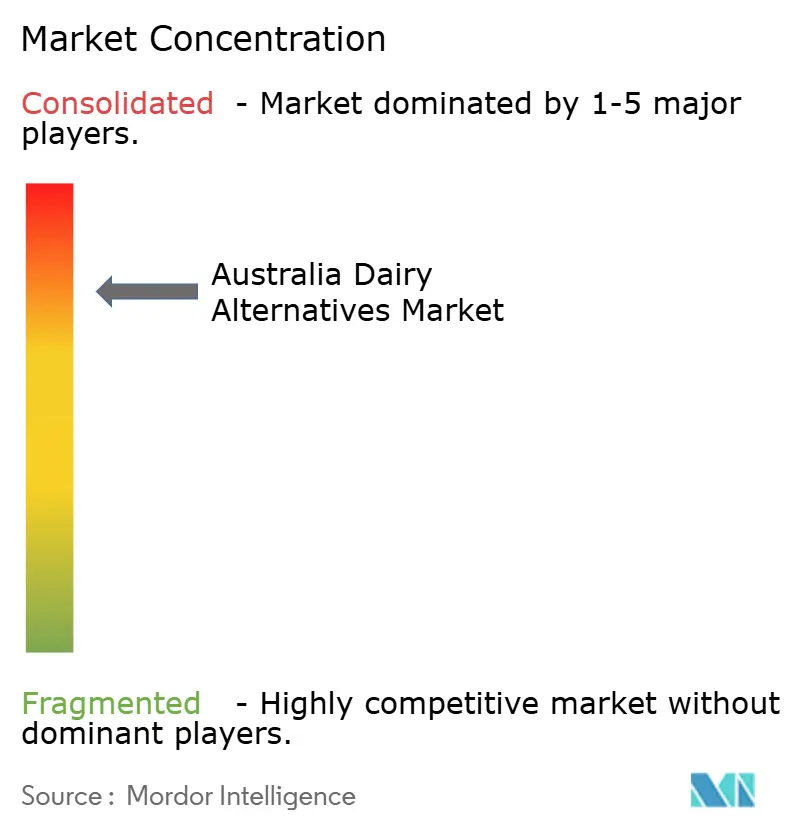
| Market Concentration | High |
Major Players *Disclaimer: Major Players sorted in no particular order Image © Mordor Intelligence. Reuse requires attribution under CC BY 4.0. | |
Australia Dairy Alternatives Market Analysis by Mordor Intelligence
The Australia dairy alternatives market size is projected to expand from USD 683.44 million in 2025 and USD 718.43 million in 2026 to USD 998.72 million by 2031, registering a CAGR of 6.81% between 2026 to 2031. This growth is primarily driven by evolving consumption patterns, significantly influenced by the prevalence of lactose intolerance, which impacts 30% to 60% of the population in Australia and New Zealand. Key developments, such as increased funding for precision fermentation technology, expansions in oat milk production capacity, and the introduction of barista-specific formulations, highlight a shift toward higher-margin functional beverages. Additionally, the rising advocacy for environmentally sustainable, lower-carbon diets, coupled with innovative packaging solutions designed to extend product shelf life and reduce refrigeration costs, further enhances the growth potential of the Australian dairy alternatives market.
Key Report Takeaways
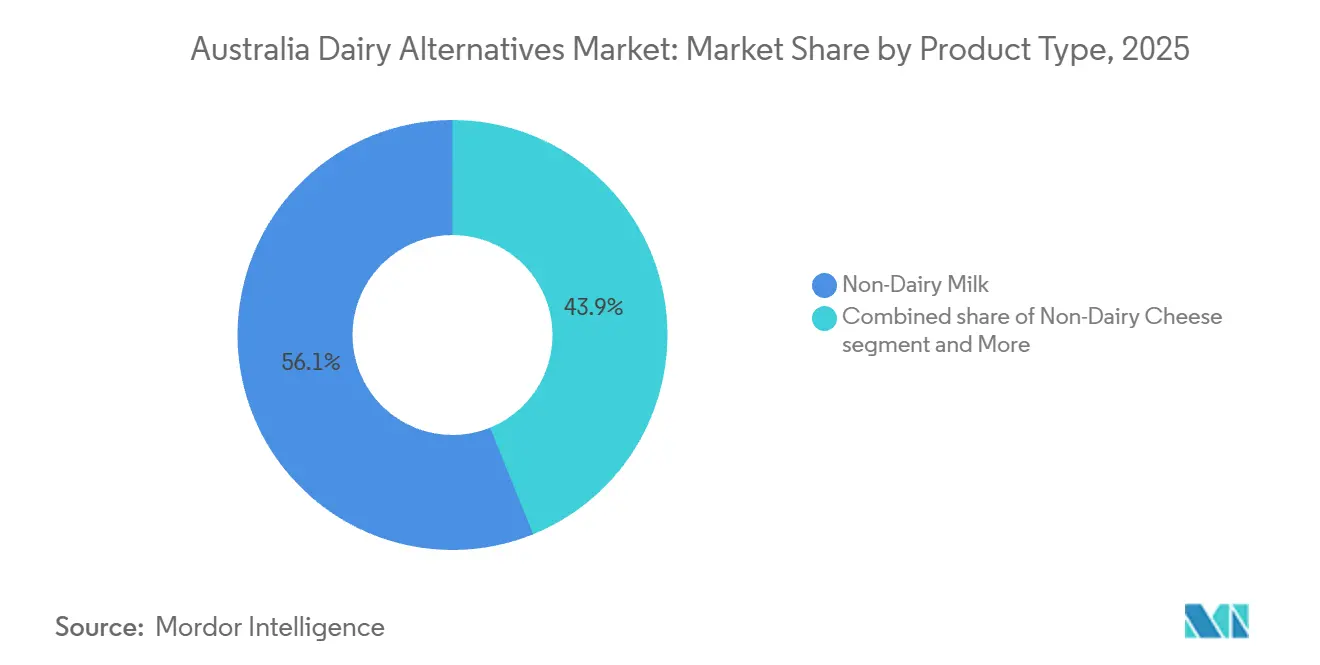
- By product type, non-dairy milk led with 56.12% of Australia dairy alternatives market share in 2025, while non-dairy cheese is advancing at a 7.83% CAGR through 2031.
- By packaging type, cartons accounted for 65.21% of the Australia dairy alternatives market size in 2025; PET bottles are forecast to expand at a 7.53% CAGR to 2031.
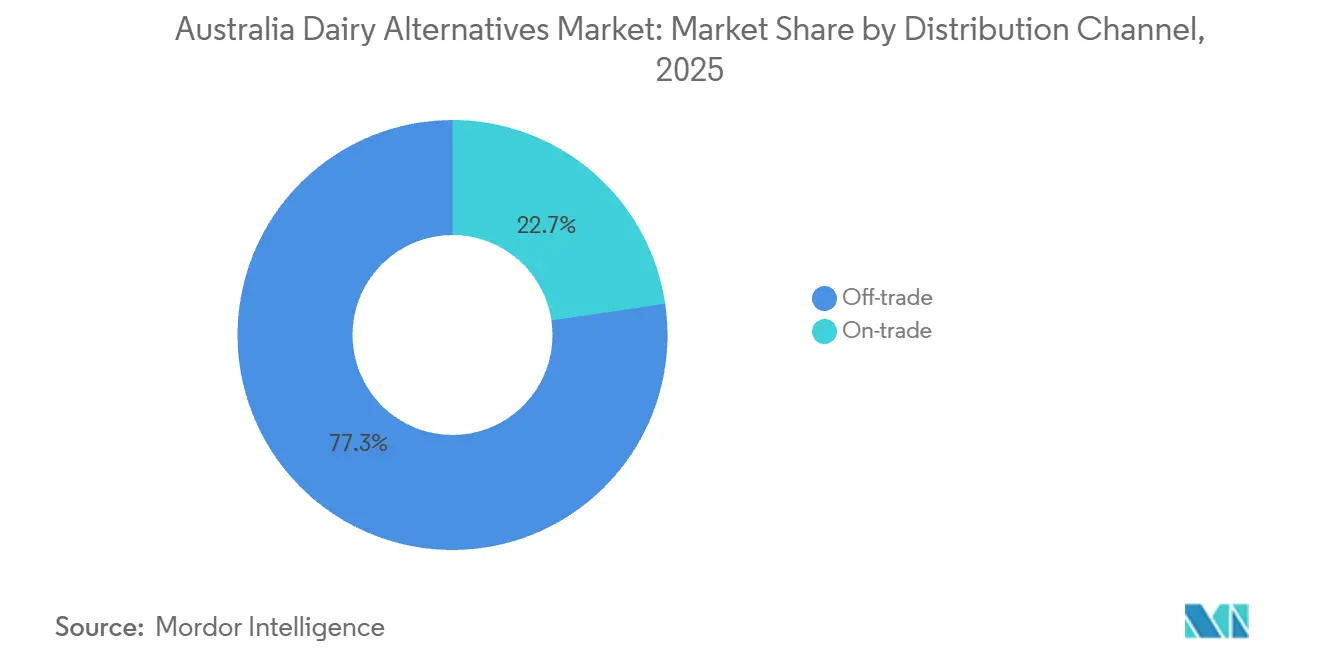
- By distribution channel, off-trade held 77.32% revenue share in 2025, whereas on-trade is set to record the fastest CAGR at 7.32% through 2031.
Note: Market size and forecast figures in this report are generated using Mordor Intelligence’s proprietary estimation framework, updated with the latest available data and insights as of January 2026.
Australia Dairy Alternatives Market Trends and Insights
Drivers Impact Analysis*
| Driver | (~) Impact on CAGR Forecast | Geographic Relevance | Impact Timeline |
|---|---|---|---|
| Rising lactose intolerance prevalence prompting dairy avoidance | + 1.2% | National, with higher incidence in East Asian and Indigenous communities | Medium term (2-4 years) |
| Growing vegan and vegetarian population adoption | + 0.9% | National, concentrated in urban centers (Sydney, Melbourne, Brisbane) | Long term (≥ 4 years) |
| Health-conscious preferences for low-saturated fat options | + 0.8% | National, with higher adoption in metropolitan health-conscious demographics | Medium term (2-4 years) |
| Environmental sustainability concerns over dairy production | + 1.5% | National, aligned with federal climate policy and CSIRO roadmap | Long term (≥ 4 years) |
| Plant-based diets perceived as aiding weight management | + 0.6% | National, concentrated in fitness and wellness consumer segments | Short term (≤ 2 years) |
| Fortification with vitamins and minerals in alternatives | + 0.7% | National, supported by Food Standards Australia New Zealand voluntary fortification framework | Short term (≤ 2 years) |
| Source: Mordor Intelligence | |||


Rising lactose intolerance prevalence prompting dairy avoidance
Lactose intolerance affects a significant portion of the population in Australia and New Zealand, with particularly high prevalence among individuals of East Asian descent and Indigenous Australians. This creates a consistent demand for lactose-free alternatives[1]Source: Australasian Society of Clinical Immunology and Allergy, “Lactose Intolerance,” allergy.org.au. According to the Australian Bureau of Statistics, 5.6% of the population explicitly identified lactose intolerance as a dietary concern in 2023[2]Source: Australian Bureau of Statistics, “National Health Survey” abs.gov.au. However, this figure likely underrepresents the broader group experiencing subclinical symptoms, such as bloating and gastrointestinal discomfort. The issue is further exacerbated by aging demographics, as lactase enzyme production naturally declines with age, thereby expanding the potential market beyond those with ethnic predispositions. The fortification of plant-based beverages with calcium carbonate and vitamin D3 has helped bridge the nutritional gap between these alternatives and traditional dairy milk. Food Standards Australia New Zealand permits voluntary fortification to match dairy milk's calcium content of 120 milligrams per 100 milliliters. This reduces barriers for consumers concerned about bone health, making the transition to lactose-free options more seamless.
Growing vegan and vegetarian population adoption
The Australian Bureau of Statistics reported that 5.3% of the population identified as vegan or vegetarian in 2023. This group has grown steadily over the past decade and now forms a significant consumer base for dairy alternatives. This shift in lifestyle is driven not only by ethical considerations but also by health-related factors, as plant-based diets are associated with reduced saturated fat intake and a lower risk of cardiovascular diseases, according to dietary guidelines from the National Health and Medical Research Council. Additionally, the Commonwealth Scientific and Industrial Research Organisation's 2024 roadmap for alternative proteins highlights support for plant-based and precision fermentation pathways, indicating policy alignment that may accelerate adoption through public procurement and institutional catering initiatives. Retailers are adapting to this growing demand [3]Source: Australia’s National Science Agency, “Modelling Sectoral Pathways to Net Zero Emissions,” csiro.au. For instance, Woolworths has expanded its plant-based private-label product range and entered into distribution agreements, including an AUD 750,000 annual sales commitment to Wide Open Agriculture's oat milk brand. This product was launched in approximately half of Woolworths stores in recent years. The enduring nature of dietary preferences suggests that this trend will continue to grow over the forecast period, particularly as younger generations gain greater purchasing power.
Health-conscious preferences for low-saturated fat options
Plant-based dairy alternatives generally contain 50% to 80% less saturated fat compared to whole dairy milk, making them a suitable option for consumers managing cholesterol levels and reducing heart disease risk factors. The National Health and Medical Research Council's Australian Dietary Guidelines recommend limiting saturated fat intake to less than 10% of total energy. For high-volume consumers, dairy milk's 2.4 grams of saturated fat per 100 milliliters can pose a challenge to meeting this guideline. In contrast, almond milk contains approximately 0.1 grams of saturated fat per 100 milliliters, while oat milk ranges from 0.2 to 0.5 grams depending on the formulation, offering a significant nutritional benefit for individuals focusing on lipid profile management. The Australian Bureau of Statistics National Health Survey indicates that 20.6% of the population experiences vitamin D deficiency, and cardiovascular disease remains a leading cause of mortality. This has increased demand for dietary solutions that minimize saturated fat intake. For example, Sanitarium's Plantwell Cholesterol Lowering variant, launched in July 2024, includes plant sterols that actively reduce low-density lipoprotein cholesterol absorption. This demonstrates how functional ingredients can enhance the saturated fat reduction benefits of plant-based alternatives. This health-driven trend is expected to continue in the medium term as public health campaigns and clinical recommendations raise awareness of the cardiovascular risks associated with saturated fat consumption.
Environmental sustainability concerns over dairy production
Dairy production generates approximately 300% more greenhouse gas emissions and requires 1,000% more land use per liter compared to plant-based alternatives. This significant difference has made environmental sustainability a key factor in consumer purchasing decisions. The Commonwealth Scientific and Industrial Research Organisation (CSIRO) 2024 alternative proteins roadmap identifies plant-based dairy as a strategic tool for achieving Australia's net-zero emissions targets. Precision fermentation is highlighted as a method to produce dairy-identical proteins without relying on methane-emitting livestock. Water scarcity in the Murray-Darling Basin has increased scrutiny of almond cultivation, which requires between 9,000 and 17,000 liters of water per kilogram. This has driven innovation toward oat and hemp substrates, which require less irrigation and can be grown in temperate regions less susceptible to drought. Additionally, packaging sustainability is aligning with product sustainability. For instance, Tetra Pak cartons, made from 70% renewable materials and offering lower carbon footprints compared to polyethylene terephthalate bottles, are gaining traction among environmentally conscious consumers. Corporate sustainability commitments further reinforce this trend. Noumi Limited, for example, is targeting carbon neutrality across its Milklab barista range and leveraging its environmental credentials to establish on-trade partnerships with specialty coffee chains.
Restraints Impact Analysis*
| Restraint | (~) Impact on CAGR Forecast | Geographic Relevance | Impact Timeline |
|---|---|---|---|
| Soy allergies and sensitivities limiting adoption | -0.4% | National, with higher prevalence in pediatric segments | Short term (≤ 2 years) |
| Shorter shelf life requiring faster turnover | -0.6% | National, concentrated in refrigerated product formats and convenience retail | Medium term (2-4 years) |
| Limited raw material availability due to climate variability | -0.7% | National, particularly affecting almond production in Murray-Darling Basin irrigation zones | Long term (≥ 4 years) |
| Perceptions of ultra-processing and additives | -0.8% | National, concentrated among health-conscious and clean-label consumers | Medium term (2-4 years) |
| Source: Mordor Intelligence | |||
Soy allergies and sensitivities limiting adoption
Soy allergy affects 0.3% to 0.4% of Australian children, ranking below milk, egg, and peanut allergies in prevalence. However, it poses a significant limitation for pediatric consumption and raises concerns about cross-reactivity among individuals with birch pollen allergies. This challenge is further intensified by Food Standards Australia New Zealand (FSANZ) labeling requirements, which mandate allergen declarations for soy. These regulations may discourage cautious consumers from trying soy-based products, even in the absence of a diagnosed allergy. In response, the market has expanded substrate options, including oat, almond, coconut, cashew, hemp, and hazelnut milk, thereby reducing reliance on soy as the primary plant-based alternative. Vitasoy International Holdings Limited, traditionally a soy-focused producer, noted in its 2023 earnings report that oat milk is projected to surpass almond milk as the top-selling product in Australia. This indicates a strategic shift away from soy dependency. The short-term impact reflects the immediate influence of allergen avoidance behaviors and the rapid pace of product innovation, which is already addressing this limitation through substrate diversification.
Shorter shelf life requiring faster turnover
Refrigerated plant-based milk typically offers a post-opening freshness of 7% to 10% days, compared to 6% to 12% months for aseptic carton formats. This difference creates inventory turnover challenges for retailers and increases the risk of spoilage for consumers who purchase these products infrequently. A recall in February 2023 of JS Health Inside Out products, due to missing refrigeration instructions, highlighted the operational complexities of managing shelf-stable versus refrigerated formats. Inadequate labeling led to product degradation and raised consumer safety concerns. Convenience stores and smaller format retailers face additional difficulties due to limited cold storage capacity and lower foot traffic, which extend the time between stocking and sale. This increases the likelihood of products reaching expiration before purchase. While ultra-high temperature processing and aseptic packaging can extend ambient shelf life to 6% to 12% months, these formats require higher capital investment and processing costs, which smaller manufacturers often find challenging to manage. The medium-term impact of these issues reflects the multi-year timeline needed for the adoption of advanced packaging technologies and optimization of cold chain infrastructure. Additionally, consumer education on proper storage and consumption timing will be critical in addressing these constraints.
*Our forecasts treat driver/restraint impacts as directional, not additive. The impact forecasts reflect baseline growth, mix effects, and variable interactions.
Segment Analysis
By Product Type: Non-Dairy Cheese Fastest Growth Trajectory
The non-dairy cheese market is projected to grow at a compound annual growth rate (CAGR) of 7.83% through 2031, surpassing the 56.12% market share anticipated for non-dairy milk in 2025. This growth is driven by advancements in melt and stretch functionality, addressing the traditional performance gap between non-dairy and dairy cheese. Researchers at the University of New South Wales have filed provisional patent AU2024904216A0 for a pea protein and polysaccharide blend that mimics the melting and stretching properties of mozzarella. This innovation has the potential to enhance foodservice applications, particularly in pizza and pasta dishes, where plant-based cheese has faced challenges in gaining acceptance. Grounded Foods has secured seed funding to commercialize cheese made from cauliflower and hemp seeds, while Dairy Free Down Under reported a tenfold growth over 12 months and expanded its distribution to 900 stores and 11 export countries. These developments highlight how niche players are leveraging innovation rather than scale to capture market share.
In the non-dairy milk segment, soy milk, once dominant, is losing market share to oat and almond milk as consumers seek alternatives that address allergen concerns and offer diverse flavor profiles. Coconut milk maintains a stable niche in Asian cuisine, while cashew, hemp, and hazelnut milk occupy premium market positions, supported by their nutritional benefits and higher price points. Non-dairy yogurt and desserts are also experiencing steady growth. COYO introduced oat and coconut yogurt in March 2025, while Sanitarium's Plantwell range incorporates functional ingredients aimed at supporting gut health and immune function.


By Packaging Type: Cartons Retain Share Despite Polyethylene Terephthalate Acceleration
In 2025, cartons accounted for 65.21% of the market share, driven by aseptic technology that provides an ambient shelf life of 6 to 12 months and consists of 70% renewable materials. However, polyethylene terephthalate (PET) bottles are projected to grow at a compound annual growth rate (CAGR) of 7.53% through 2031, as consumers increasingly value resealability and on-the-go convenience. This trend highlights a segmentation in use cases. Cartons dominate household pantry stocking for cooking and cereal applications, while PET bottles cater to single-serve and portable consumption scenarios, such as gym bags and office refrigerators.
Polyethylene terephthalate bottles also offer transparency, allowing product visibility that enhances consumer confidence in freshness, which is an advantage cartons cannot provide despite their superior carbon footprint performance. Cans hold a niche role, primarily in ready-to-drink coffee and protein shake formats, where aluminum's recyclability and premium image justify higher per-unit costs. Other packaging formats, such as glass bottles and flexible pouches, remain marginal due to their weight and fragility, which increase logistics costs and the risk of breakage.
By Distribution Channel: On-Trade Momentum Reshapes Product Innovation
On-trade channels are projected to grow at a compound annual growth rate (CAGR) of 7.32% through 2031, surpassing the 77.32% market share held by off-trade channels in 2025. This growth is supported by the fact that 83% of Australian cafes now offer plant-based milk options, with barista-grade formulations commanding premium pricing in specialty coffee settings. Milklab captured 16% of the barista segment, generating 120.7 million Australian dollars (AUD) in revenue during the fiscal year 2025. Oat milk revenue experienced a year-over-year growth of 28.4%, driven by the increasing demand for plant-based options that froth and steam similarly to dairy milk, fueled by the specialty coffee culture.
This on-trade growth is influencing product innovation, with manufacturers focusing on protein content, fat ratios, and emulsifier blends to enhance microfoam stability, rather than prioritizing taste profiles for direct consumption. Additionally, the international expansion of barista brands is gaining momentum, with Milklab reporting 20.1% growth in export markets as Australian cafe culture spreads to Asia-Pacific specialty coffee chains.
Segment Analysis
Australia's dairy alternatives market is projected to grow at a compound annual growth rate (CAGR) of 6.81% through 2031. This growth is primarily driven by urban centers such as Sydney, Melbourne, and Brisbane, where the specialty coffee culture and a higher density of vegan consumers generate stronger demand compared to regional areas. The Commonwealth Scientific and Industrial Research Organisation's (CSIRO) 2024 alternative proteins roadmap identifies Australia as a strategic hub for precision fermentation and plant-based innovation. Government support has been evident through initiatives such as Breakthrough Victoria's AUD 25 million investment in Eden Brew in October 2023 and the Western Australia Government's AUD 5 million grant to Wide Open Agriculture for the construction of an oat milk facility, which is expected to be completed by June 2025.
These policy measures highlight a national commitment to alternative proteins, extending beyond consumer demand to include agricultural diversification and export competitiveness. For instance, Noumi Limited reported a 20.1% growth in international revenue, driven by the penetration of Australian barista brands into Asia-Pacific specialty coffee markets. Regional variations within Australia reflect differences in infrastructure and demographics. Metropolitan areas benefit from advanced cold chain logistics, enabling the distribution of refrigerated products, while rural regions rely more on ambient shelf-stable carton formats to minimize spoilage risks.
Additionally, water scarcity in the Murray-Darling Basin is influencing raw material sourcing, with a shift toward oat and hemp cultivation in temperate regions less affected by drought. This approach enhances supply chain resilience and reduces reliance on almond production, which is concentrated in irrigation-dependent areas.
Competitive Landscape
The Australia Dairy Alternatives Market shows a highly consolidated competitive environment, with multinational companies such as Nestlé and Danone competing alongside domestic players like Noumi Limited, Sanitarium Health and Wellbeing Company, and Bega Group for retail shelf space and foodservice partnerships. Strategic trends highlight vertical integration, as seen with Noumi Limited's control over Milklab's barista formulations and retail offerings, enabling margin capture across both on-trade and off-trade channels. Meanwhile, precision fermentation entrants, including Eden Brew and All G Foods, focus on technology licensing and co-manufacturing partnerships to scale operations without investing in capital-intensive manufacturing infrastructure.
Opportunities are emerging in functional fortification, with Sanitarium's Plantwell range addressing condition-specific benefits such as cholesterol reduction and immune support, extending beyond basic nutritional equivalence. Additionally, substrate diversification is gaining traction, with premium niches being occupied by hemp, hazelnut, and walnut milk, which face limited competition. Emerging disruptors include university spin-offs commercializing intellectual property. For instance, researchers from the University of New South Wales have filed provisional patent AU2024904216A0 for pea protein cheese blends that replicate melt and stretch functionality. Ingredient technology firms like Grounded Foods are also innovating by utilizing cauliflower and hemp seed substrates to differentiate from dominant soy and almond-based products.
Technological advancements are driving competitive advantages. Precision fermentation, for example, enables Eden Brew to produce casein micelle proteins identical to those in dairy without relying on animal agriculture. This capability has the potential to disrupt both plant-based and conventional dairy segments by offering superior functionality at scale. Market consolidation continues, as evidenced by the Australian Competition and Consumer Commission's approval in July 2025 of Lactalis acquiring Fonterra's Australian operations. In contrast, Bega Group's withdrawal in August 2025 from a competing bid for Fonterra highlights how capital allocation discipline is limiting inorganic growth among mid-tier players. Regulatory complexity is also shaping the market. Food Standards Australia New Zealand's novel foods assessment pathway for precision fermentation proteins creates challenges for smaller disruptors, as established players with robust regulatory affairs capabilities are better positioned to navigate pre-market approval processes, thereby creating a barrier to entry.
Australia Dairy Alternatives Industry Leaders
Blue Diamond Growers
Califia Farms LLC
Dairy-Free Down Under
Danone SA
Nestlé SA
- *Disclaimer: Major Players sorted in no particular order

Recent Industry Developments
- January 2026: Califia Farms launched its first soymilk product line, Simple and Organic, featuring 8 grams of protein per serving in Sweet Crème and Salted Caramel flavors across 48-ounce and 32-ounce formats, marking a strategic expansion into soy substrates after building brand equity in almond and oat segments
- August 2024: Australian Walnut Company launched Vitality Walnut Milk, highlighting its omega-3 fatty acid content as a key differentiator for cardiovascular health and positioning it as a premium product within the novel nut-based milk category.
- July 2024: Sanitarium Health and Wellbeing Company launched the Plantwell range, incorporating functional ingredients targeting bone health, gut health, cholesterol reduction, and immune support, positioning plant-based milk as a vehicle for condition-specific nutritional benefits beyond baseline fortification


Australia Dairy Alternatives Market Report Scope
The dairy alternatives market includes plant-based substitutes for traditional dairy products such as milk, yogurt, cheese, butter, and ice cream. These alternatives are primarily sourced from ingredients like soy, almond, oat, and others. The market caters to vegan, lactose-intolerant, and health-conscious consumers, driven by the rising demand for sustainable, allergen-free, and nutritionally enriched options, as well as the growing popularity of plant-based diets. The market is segmented as follows: by product type, which includes non-dairy milk (further sub-segmented into oat milk, hemp milk, hazelnut milk, soy milk, almond milk, coconut milk, and cashew milk), non-dairy cheese, non-dairy desserts, and non-dairy yogurt; by packaging type, which is divided into polyethylene terephthalate (PET) bottles, cans, cartons, and others; and by distribution channel, which is segmented into on-trade and off-trade, where off-trade is further sub-segmented into convenience stores, supermarkets and hypermarkets, online retail, and others.
| Non-Dairy Milk | Oat Milk |
| Hemp Milk | |
| Hazelnut Milk | |
| Soy Milk | |
| Almond Milk | |
| Coconut Milk | |
| Cashew Milk | |
| Non-Dairy Cheese | |
| Non-Dairy Desserts | |
| Non-Dairy Yogurt |
| PET Bottles |
| Cans |
| Cartons |
| Others |
| On-trade | |
| Off-trade | Convenience Stores |
| Supermarkets and Hypermarkets | |
| On-line Retail | |
| Others |
| By Product Type | Non-Dairy Milk | Oat Milk |
| Hemp Milk | ||
| Hazelnut Milk | ||
| Soy Milk | ||
| Almond Milk | ||
| Coconut Milk | ||
| Cashew Milk | ||
| Non-Dairy Cheese | ||
| Non-Dairy Desserts | ||
| Non-Dairy Yogurt | ||
| By Packaging Type | PET Bottles | |
| Cans | ||
| Cartons | ||
| Others | ||
| By Distribution Channel | On-trade | |
| Off-trade | Convenience Stores | |
| Supermarkets and Hypermarkets | ||
| On-line Retail | ||
| Others | ||


Market Definition
- Dairy Alternatives - Dairy alternatives are foods that are made from plant-based milk/oils instead of their usual animal products, such as cheese, butter, milk, ice cream, yogurt, etc. Plant-based or non-dairy milk alternative is the fast-growing segment in the newer food product development category of functional and specialty beverage across the globe.
- Non-Dairy Butter - Non dairy butter is a vegan butter alternative that is made from a mixture of plant oils. With an increase in alternative diets like vegetarianism, veganism, and gluten intolerance, plant butter is a healthy non-dairy substitute for normal butter.
- Non-Dairy Ice Cream - Plant based ice cream is a growing category. Non-dairy ice cream is a type of dessert made without any animal ingredients. This is typically considered a substitute for regular ice cream for those who cannot or do not eat animal or animal-derived products, including eggs, milk, cream, or honey.
- Plant-Based Milk - Plant based milks are milk substitutes that are made from nuts (e.g., hazelnuts, hemp seeds), seeds (e.g., sesame, walnuts, coconuts, cashews, almonds, rice, oats, etc.) or legumes (e.g., soy). Plant-based milk such as soy milk and almond milk have been popular in East Asia and the Middle East for centuries.
| Keyword | Definition |
|---|---|
| Cultured Butter | Cultured butter is prepared by having the raw butter go through chemical processing and has been added with certain emulsifiers and foreign ingredients. |
| Uncultured Butter | This type of butter is one which has not been processed in any way |
| Natural Cheese | The type of cheese in its most natural form. It is made from natural and simple products and ingredients, including fresh and natural salts, natural colors, enzymes, and high-quality milk. |
| Processed Cheese | Processed cheese undergoes the same processes as natural cheese; however, it requires more steps and many different forms of ingredients. Making processed cheese involves melting natural cheese, emulsifying it, and adding preservatives and other artificial ingredients or colorings. |
| Single Cream | Single cream contains around 18% fat. It’s a single layer of cream that appears over boiled milk. |
| Double Cream | Double cream contains 48% fat, more than double the amount of fat of single cream. It’s heavier and thicker than single cream |
| Whipping Cream | This has a much higher fat percentage than single cream (36%). Used to top cakes, pies, and puddings and as a thickener for sauces, soups, and fillings. |
| Frozen Desserts | Desserts that are meant to be eaten in frozen condition. E.g., sherbets, sorbets, frozen yogurts |
| UHT Milk (Ultra-high temperature milk) | Milk heated at a very high temperature. Ultra-high-temperature processing (UHT) of milk involves heating for 1–8 sec at 135–154°C. which kills the spore-forming pathogenic microorganism, resulting in a product with a shelf-life of several months. |
| Non-dairy butter/Plant-based butter | Butter made from plant-derived oil such as coconut, palm, etc. |
| Non-dairy Yogurt | Yogurt made from typically made from nuts, like almonds, cashews, coconuts, and even other foods like soybeans, plantains, oats, and peas |
| On-trade | It refers to restaurants, QSRs, and bars. |
| Off-trade | It refers to supermarkets, hypermarkets, on-line channels, etc. |
| Neufchatel cheese | One of the oldest kinds of cheese in France. It is a soft, slightly crumbly, mold-ripened, bloomy-rind cheese made in the Neufchâtel-en-Bray region of Normandy. |
| Flexitarian | It refers to a consumer preferring a semi-vegetarian diet, that is centered on plant foods with limited or occasional inclusion of meat. |
| Lactose Intolerance | Lactose intolerance is a reaction in digestive system to lactose, the sugar in milk. It causes uncomfortable symptoms in response to the consumption of dairy products. |
| Cream Cheese | Cream cheese is a soft and creamy fresh cheese with a tangy taste made from milk and cream. |
| Sorbets | Sorbet is a frozen dessert made using ice combined with fruit juice, fruit purée, or other ingredients, such as wine, liqueur, or honey. |
| Sherbet | Sherbet is a sweetened frozen dessert made with fruit and some sort of dairy product such as milk or cream. |
| Shelf stable | Foods that can be safely stored at room temperature, or "on the shelf," for at least one year and do not have to be cooked or refrigerated to eat safely. |
| DSD | Direct Store Delivery is the process in supply chain management wherein the product is delivered from manufacturing plant directly to the retailer. |
| OU Kosher | Orthodox Union Kosher is a kosher certification agency based in New York City. |
| Gelato | Gelato is a frozen creamy dessert made with milk, heavy cream and sugar. |
| Grass-fed Cows | Grass-fed cows are allowed to graze in pastures, where they eat a variety of grasses and clover. |


Research Methodology
Mordor Intelligence follows a four-step methodology in all our reports.
- Step-1: Identify Key Variables: In order to build a robust forecasting methodology, the variables and factors identified in Step 1 are tested against available historical market numbers. Through an iterative process, the variables required for market forecast are set, and the model is built on the basis of these variables.
- Step-2: Build a Market Model: Market-size estimations for the forecast years are in nominal terms. Inflation is not a part of the pricing, and the average selling price (ASP) is kept constant throughout the forecast period for each country.
- Step-3: Validate and Finalize: In this important step, all market numbers, variables, and analyst calls are validated through an extensive network of primary research experts from the market studied. The respondents are selected across levels and functions to generate a holistic picture of the market studied.
- Step-4: Research Outputs: Syndicated Reports, Custom Consulting Assignments, Databases & Subscription Platforms


