Market Overview
| Study Period | 2020 - 2031 |
|---|---|
| Forecast Data Period | 2026 - 2031 |
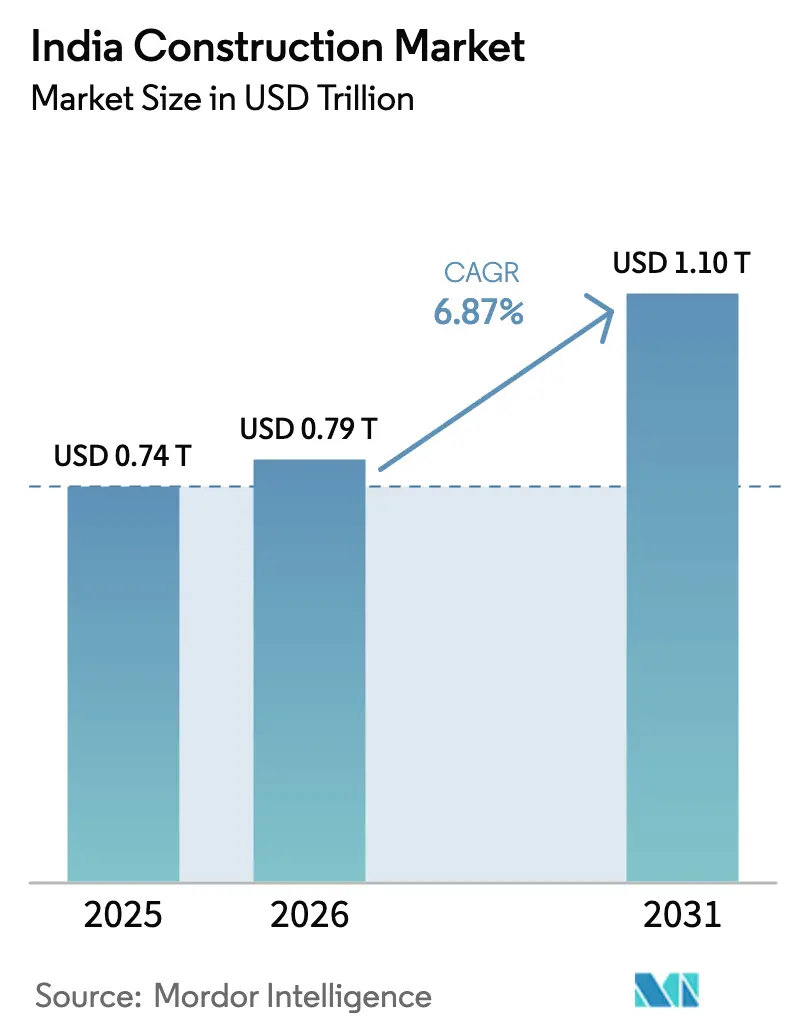
| Base Year Market Size (2025) | USD 0.74 Trillion |
| Market Size (2026) | USD 0.79 Trillion |
| Market Size (2031) | USD 1.10 Trillion |
| Growth Rate (2026 - 2031) | 6.87% CAGR |
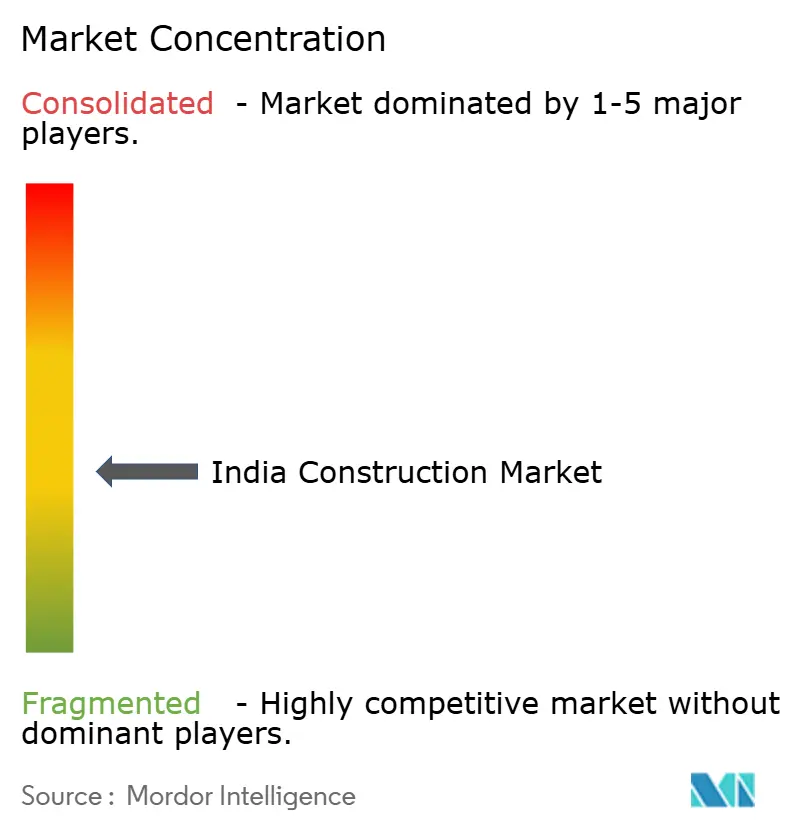
| Market Concentration | Medium |
Major Players *Disclaimer: Major Players sorted in no particular order Image © Mordor Intelligence. Reuse requires attribution under CC BY 4.0. | |
India Construction Market Analysis by Mordor Intelligence
The India Construction Market size is projected to be USD 0.74 trillion in 2025, USD 0.79 trillion in 2026, and reach USD 1.10 trillion by 2031, growing at a CAGR of 6.87% from 2026 to 2031, underpinned by front-loaded public spending and deepening private capital pools. Accelerated highway contract awards, renewable-energy build-outs, and rapid data-center expansion continue to anchor order books for large engineering, procurement, and construction (EPC) firms[1]Indian Green Building Council, “Certification Statistics 2025,” igbc.in. On the demand side, Tier-2 and Tier-3 cities are capturing a larger slice of metro-rail and water-infrastructure allocations, broadening the geographic base of activity. Sharper adoption of modular building systems, digital-twin modeling, and green-building retrofits is lifting productivity and helping contractors offset margin pressure from volatile bitumen and rebar prices. Meanwhile, ESG-linked lending thresholds introduced by the Reserve Bank of India are nudging mid-tier players toward tighter emissions reporting and recycled-material use, reshaping procurement strategies.
Key Report Takeaways
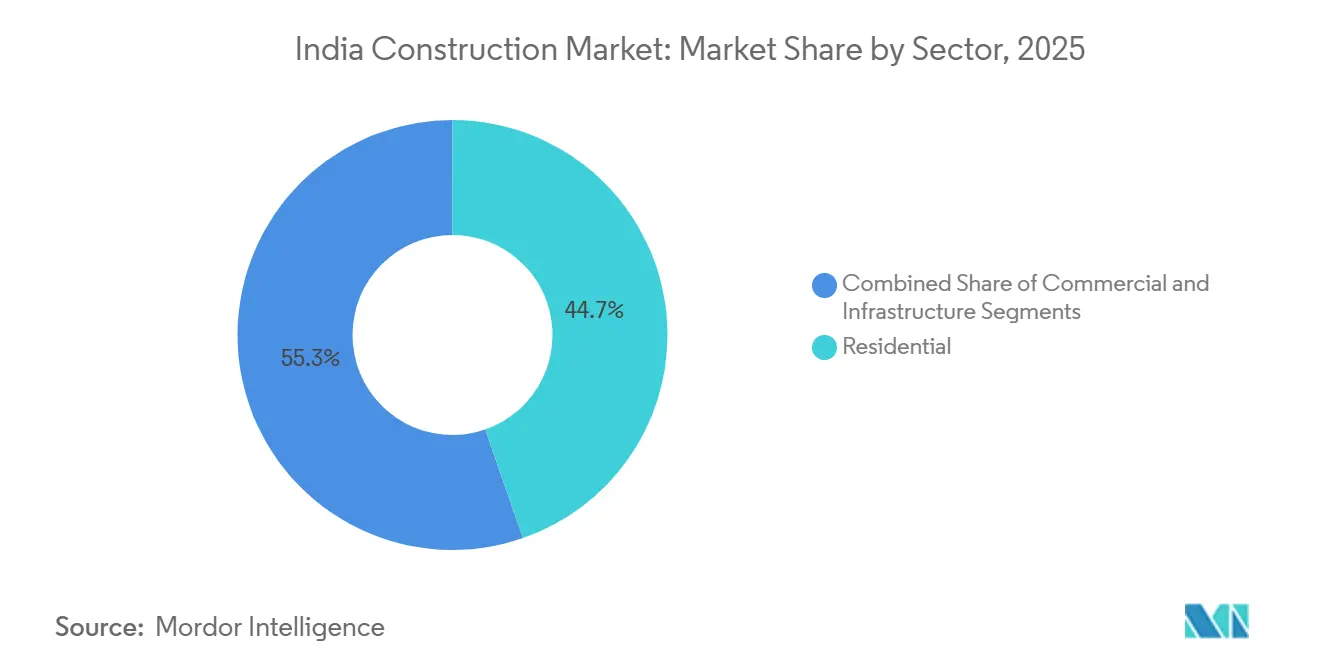
- By sector, residential construction held 44.68% of the India construction market share in 2025, while infrastructure is projected to expand at a 9.49% CAGR through 2031.
- By construction type, new construction commanded 76.88% of the India construction market in 2025; renovation is the fastest-growing sub-segment at a 7.96% CAGR to 2031.
- By investment source, public outlays represented 51.79% of total 2025 spending, whereas private capital is poised for a 10.06% CAGR through 2031.
- By geography, West India contributed 40.77% of 2025 value in the Indian construction industry, and East India is set to log the quickest regional growth at a 7.24% CAGR to 2031.
- Larsen & Toubro, Megha Engineering & Infrastructures and Tata Projects together accounted for roughly 35% organized-sector revenue in 2025, reflecting a moderately concentrated competitive field.
Note: Market size and forecast figures in this report are generated using Mordor Intelligence’s proprietary estimation framework, updated with the latest available data and insights as of January 2026.
India Construction Market Trends and Insights
Drivers Impact Analysis*
| Drivers | (~) % Impact on CAGR Forecast | Geographic Relevance | Impact Timeline |
|---|---|---|---|
| Front-loaded FY26 infrastructure capex surge (NIP, Gati Shakti) | +1.8% | National, North & West | Short term (≤ 2 years) |
| 500 GW renewable-energy target fueling utility EPC boom | +1.5% | National, esp. Rajasthan, Gujarat, Karnataka, Tamil Nadu | Long term (≥ 4 years) |
| REIT-led demand for Grade-A warehousing and flex workspaces | +1.2% | NCR, Mumbai, Bangalore, Hyderabad | Short term (≤ 2 years) |
| UIDF-backed Tier-2/3 urban infrastructure projects | +0.9% | Central & East | Medium term (2-4 years) |
| State-level data-center incentive corridors in emerging cities | +0.7% | Maharashtra, Telangana, Tamil Nadu, Karnataka | Medium term (2-4 years) |
| Defense-corridor investments catalyzing supplier-park construction | +0.6% | Tamil Nadu, Uttar Pradesh | Medium term (2-4 years) |
| Source: Mordor Intelligence | |||
Front-Loaded FY26 Infrastructure Capex Surge
Union Budget 2025-26 earmarked USD 133.3 billion for transport, logistics, and power corridors, a 10.2% year-on-year bump that aims to complete 70% of National Infrastructure Pipeline projects by 2028. Highway awards touched 8,500 kilometers in FY 2024-25, 60% of which followed the hybrid annuity model that spreads revenue risk between public and private partners. Cement dispatches advanced 9.2% in the first nine months of FY 2025-26, mirroring the surge in site mobilizations. Dedicated Freight Corridor milestones are shaving rail transit times in half, strengthening just-in-time supply chains for auto and electronics clusters. Price-escalation clauses now appear in 85% of National Highways Authority of India contracts, buffering contractors against raw-material volatility.
500 GW Renewable-Energy Target Fueling Utility EPC Boom
India added 70 GW of solar and wind capacity in 2025, keeping the 500 GW by 2030 pledge on track[2]Ministry of Housing & Urban Affairs, “UIDF Metro Projects 2025,” mohua.gov.in. Solar Energy Corporation of India auctions cleared 40 GW at a record-low average tariff of INR 2.45/kWh, enhancing bankability for developers. Rajasthan and Gujarat claimed 45% of new solar megawatts thanks to high irradiation and land-availability policies. Offshore-wind seabed leases totaling 10 GW were awarded off Gujarat and Tamil Nadu, with construction slated for 2027. Power Grid Corporation locked in USD 2.16 billion of high-voltage transmission awards to evacuate intermittent generation, cementing grid-build as a parallel demand engine.
UIDF-Backed Tier-2/3 Urban Infrastructure Projects
The Urban Infrastructure Development Fund set aside USD 1.2 billion in 2025 for metro-rail, bus rapid transit, and potable-water upgrades in cities of 0.5-2 million people[3]Ministry of Housing & Urban Affairs, “UIDF Metro Projects 2025,” mohua.gov.in. Surat Metro’s 21-kilometer Phase I opened in March 2025 and is already averaging 85,000 daily riders, prompting a 35-kilometer Phase II tender. Indore and Bhopal broke ground on 31- and 40-kilometer networks with scheduled partial commissioning by 2027. Rolling-stock OEM Medha Servo Drives won propulsion contracts, illustrating how local suppliers capture value from second-tier city rail pipelines. Transit-oriented development is spurring mixed-use launches within 500 meters of stations, extending real estate growth beyond the big six metros.
Defense-Corridor Investments Catalyzing Supplier-Park Construction
Defense corridors in Tamil Nadu and Uttar Pradesh attracted USD 1.02 billion of committed factory and testing-facility spend by December 2025. Supplier parks are clustering around Oragadam and Aligarh, housing precision-machining, avionics and composite-material vendors that feed Hindustan Aeronautics and Bharat Dynamics programs. Land banks with plug-and-play utilities trim greenfield timelines to under 18 months, appealing to foreign joint-venture partners eyeing offset obligations. State incentives include 50% stamp-duty waivers and interest-free loans that lower project IRRs by up to 200 basis points. Corridor activity is also seeding public-private institutes for advanced manufacturing, tightening the talent pipeline for metal-additive and CNC specialists.
Restraints Impact Analysis*
| Restraints | (~) % Impact on CAGR Forecast | Geographic Relevance | Impact Timeline |
|---|---|---|---|
| Volatile imported bitumen and metal prices compressing margins | –1.1% | National, higher exposure in coastal states | Short term (≤ 2 years) |
| Rising land-acquisition litigation under Bharatmala 2.0 | –0.8% | Uttar Pradesh, Bihar, Madhya Pradesh | Medium term (2-4 years) |
| Sand-mining moratoria driven by water-table depletion | –0.6% | Karnataka, Rajasthan, Tamil Nadu, Andhra Pradesh | Medium term (2-4 years) |
| ESG-linked lending compliance burden on mid-tier contractors | –0.4% | National, firms with USD 120-600 million turnover | Long term (≥ 4 years) |
| Source: Mordor Intelligence | |||
Volatile Imported Bitumen & Metal Prices Compressing Margins
Imported bitumen prices jumped 18% year-on-year during H1 2025 amid Middle-East supply disruptions and a weaker rupee, driving 200-300 basis-point margin squeezes for fixed-price contracts. Steel rebar swung between USD 650 and USD 735 per ton, mirroring coking-coal volatility. Legacy projects lacking escalation clauses remain exposed, although 85% of new NHAI contracts now tie payments to wholesale indices. EPC leaders are signing 12-18-month supply pacts with domestic mills, while MoRTH approved polymer-modified and recycled asphalt for 30% of new carriageways, aiming to trim import dependency. Cost turbulence is also spurring broader adoption of structural steel optimization software to cut tonnage per lane-kilometer.
Rising Land-Acquisition Litigation Under Bharatmala 2.0
More than 1,200 highway projects were stuck in tribunal disputes as of March 2025, averaging 18 months per case and inflating project costs by 15-20% after a Supreme Court judgment mandated market-rate compensation plus 100% solatium. Land-owner resistance peaks in Uttar Pradesh and Bihar, where agriculture dominates livelihoods, forcing reroutes and slowing financial closures. The Ministry of Road Transport and Highways is piloting land-pooling models in Madhya Pradesh, exchanging serviced plots for raw acreage to curb cash outgo. Contractors such as Dilip Buildcon report 6-12 month schedule slippages, eroding internal rates of return on hybrid annuity awards. In response, NHAI is tilting toward brownfield widening that leverages existing right-of-way, a shift likely to persist until reforms shrink the litigation backlog.
*Our forecasts treat driver/restraint impacts as directional, not additive. The impact forecasts reflect baseline growth, mix effects, and variable interactions.
Segment Analysis
By Sector: Infrastructure Growth Outpaces Residential Dominance
Infrastructure construction is projected to grow at a 9.49% CAGR through 2031, while residential construction held a 44.68% market share in India in 2025. Transportation corridors and renewable-energy assets together pulled in USD 25.2 billion of EPC orders during 2025, buoyed by 70 GW of fresh solar-wind capacity and 8,500 kilometers of highway awards. Defense-corridor supplier parks unlocked early-stage projects such as avionics labs and composites foundries, adding diversity to infrastructure backlogs. Private developers responded by accelerating mixed-use proposals around future expressways, a trend that feeds new townships and roadside logistics hubs. Looking ahead, the construction market size in India for infrastructure is set to benefit from continuing grid investments, offshore-wind foundations, and multimodal freight terminals that require specialized heavy-civil capabilities.
Residential starts softened in 2025 as average home-loan rates touched 9.1%, yet ready-to-move units in Tier-2 cities sold briskly thanks to USD 5.76 billion of Pradhan Mantri Awas Yojana subsidies. Apartments captured three-quarters of residential activity, reflecting land scarcity in mature metros. Villas and plotted developments remained a niche, clustered around Bengaluru’s Whitefield and Pune’s Hinjewadi where land is 30-40% cheaper than core CBD tracts. REIT appetite for flex workplaces and fulfillment centers is also incentivizing developers to zone excess peri-urban parcels for residential density, blurring sector boundaries. As mortgage rates stabilize, developers are expected to ramp up mid-income launches, buttressed by digital sales platforms and lower construction cycles achieved through modular techniques.


By Construction Type: Renovation Rises on Green Retrofits
New-builds held 76.88% of the 2025 value, yet renovation is forecast to expand at a 7.96% CAGR as aging 1990s-era towers in Mumbai and Delhi chase LEED and GRIHA upgrades. The Indian Green Building Council logged 45 million ft² of retrofit certifications in 2025, up 35% year-on-year, reflecting corporate tenants’ push for lower energy bills and better air-quality metrics. Facility owners are re-cladding façades with low-emissivity glass, replacing HVAC units, and installing seismic dampers to align with revised BIS norms. Specialist contractors command a 20-25% pricing premium for live-site retrofits, creating a profitable niche that offsets slower greenfield margins. Municipal Smart-City grants worth USD 720 million are underwriting heritage precinct revamps and public-space makeovers, further enlarging the renovation pipeline.
New construction remains dominant in construction industry in India, because large-ticket highways, metro alignments, and township launches continue to rely on virgin land. NHAI steered 85% of its FY 2024-25 awards to fresh alignment builds, underscoring the state’s preference for new corridors over widening projects. Developers announced 320 million ft² of residential launches in 2025, 70% of which fell below the USD 96,000 ticket that qualifies for affordable-housing incentives. Going forward, the India construction market will likely tilt toward a balanced mix of new and retrofit work as climate-aligned refurbishment gains policy traction.
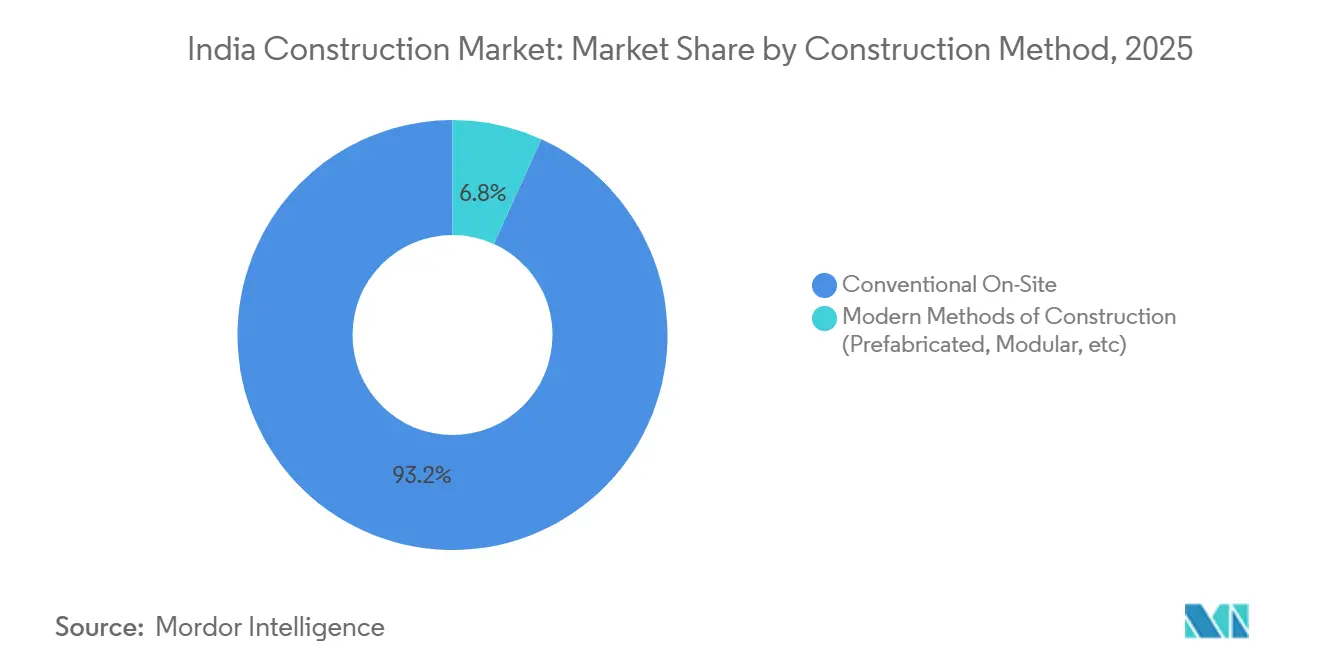
By Construction Method: Prefab and Modular Systems Gain Traction
In 2025, conventional on-site methods represented 93.23% of total activity in construction sector in India, but modular systems are accelerating at a 7.17% CAGR as schedule compression becomes a competitive differentiator. Larsen & Toubro trimmed 15% off the build time for Mumbai Metro Line 3 by deploying off-site precast segments. Residential major Sobha Limited integrated prefab bathroom pods in 30% of its Bengaluru and Pune launches, squeezing delivery timelines from 36 to 28 months. The IGBC’s GRIHA system awards extra points for off-site fabrication, nudging developers to incorporate volumetric modules and thereby future-proof assets against tightening energy codes. Robotics for rebar tying and concrete 3D printing are also moving past the pilot stage, especially on remote solar farms where labor shortages bite hardest.
Labor-cost advantages still favor on-site pouring and masonry in smaller Tier-3 projects, with daily wages averaging USD 7-9 for unskilled workers. However, rising safety expectations and pandemic-era disruptions have spotlighted the resilience of industrialized construction. The Ministry of Housing and Urban Affairs now requires that 20% of affordable-housing units delivered after 2027 adopt modular elements, anchoring a baseline of demand that should lift economies of scale in factory fabrication.
By Investment Source: Private Capital Momentum Builds
Public expenditure held 51.79% of 2025 outlays, yet private capital is galloping ahead with a 10.06% CAGR forecast as REITs and infrastructure investment trusts (InvITs) widen their asset appetite. Embassy and Mindspace REITs poured USD 3 billion into stabilized office and flex portfolios last year, targeting 7-8% distribution yields. Private-equity funds also injected USD 2.16 billion into warehousing, drawn by 9-12-year leases with built-in escalators. The India construction market size for privately funded work is therefore set for outsized growth as asset monetization drives bring toll roads, transmission lines, and airports to market.
Public investment remains vital, especially for green-hydrogen pilots and offshore-wind subsea cabling that require viability-gap support. NHAI alone awarded USD 14.4 billion of road contracts in FY 2024-25, pivoting toward hybrids that mix budgetary grants with developer equity. The Reserve Bank’s relaxed leverage caps for InvITs in 2025 unlocked USD 1.8 billion of retail capital for road and renewable assets, signaling deeper domestic pools for future brownfield cycles. Overall, diversified funding channels promise to blunt fiscal-deficit constraints and sustain the long-run expansion path of the India construction market.
Geography Analysis
West India controlled 40.77% of 2025 spending, fueled by Maharashtra’s data-center corridor that attracted USD 1.44 billion from Amazon Web Services, Microsoft Azure, and Google Cloud. Mumbai Metro’s Line 3 commissioning lifted the city’s network to 180 kilometers, while Gujarat added 12 GW of solar-wind capacity, solidifying its place as a renewable hub. Phase II of the Delhi–Mumbai Industrial Corridor injected USD 2.4 billion into logistics parks and manufacturing estates straddling Gujarat, Rajasthan and Maharashtra, extending construction runs for both civil and MEP contractors.
East India, projected to post a 7.24% CAGR through 2031, is leveraging the Eastern Dedicated Freight Corridor’s 1,200-kilometer commissioning to anchor petrochemical and metal clusters in Odisha and West Bengal. Indian Oil, Bharat Petroleum and Hindustan Petroleum booked USD 1.8 billion for refinery expansions in Odisha, while West Bengal’s Dankuni–Kharagpur corridor secured nearly USD 960 million for auto-component plants. Kolkata Metro’s East-West line has already cut cross-river commute times by two-thirds, catalyzing high-rise permits along the alignment.
North India’s pipeline centers on Bharatmala expressways and Delhi Metro Phase IV, which hit 40% completion by December 2025. Uttar Pradesh leads contract volumes thanks to the Delhi–Amritsar–Katra and Ganga expressways, while Rajasthan logs steady EPC inflow for solar parks around Jaisalmer. South India is benefiting from Bengaluru’s 1,200-MW data-center approvals and Hyderabad’s biotech expansions, whereas Central India’s Indore and Bhopal metros are underpinning civil-works demand. Collectively, these region-specific tailwinds keep the India construction market on a broad-based growth trajectory rather than one skewed toward a single state cluster.
Competitive Landscape
Competitive intensity sits at a moderate level, with the ten largest EPC groups capturing around 35-40% of organized revenue, leaving a long tail of regional contractors focused on sub-USD 120 million projects. Market leaders Larsen & Toubro, Tata Projects, and Megha Engineering have embedded digital-twin platforms and autonomous equipment across road, metro, and renewable sites, shaving cycle times by 12-15% and lifting bid-win rates in time-sensitive tenders. State-level contract aggregation favors players able to furnish performance guarantees and ESG dashboards, sidelining informal outfits that lack balance-sheet heft.
Vertical integration is reshaping developer strategies. Lodha Group now self-executes 60% of residential gross-built area, shielding margins from volatile subcontractor rates and allowing faster pivot to prefabricated façades. Godrej Properties and Oberoi Realty have formed renovation arms to tap the rising retrofit pool and stretch asset lifecycles. At the materials frontier, startups such as Carbon Craft Design market recycled aggregate tiles, while Tata Steel Nest-In offers turnkey light-gauge steel frames that halve superstructure timelines.
Margin compression from input spikes has forced mid-tier players to lock multi-year supply deals or pivot to polymer-modified bitumen. Shapoorji Pallonji and NCC Limited earned industry awards for recycled-asphalt pilot stretches that trimmed greenhouse-gas profiles by double-digit percentages. Foreign entrants are seeking local joint ventures: Hyundai Engineering teamed with MEIL to secure Surat Metro Phase II, pairing tunneling know-how with domestic execution muscle. Such collaborations are expected to intensify as high-spec urban rail and offshore-wind packages demand global technology blended with local cost efficiencies, reinforcing a dynamic yet collaborative competitive canvas for the India construction market.
India Construction Industry Leaders
Larsen & Toubro (L&T)
Megha Engineering & Infrastructures
Shapoorji Pallonji
Tata Projects
KEC International
- *Disclaimer: Major Players sorted in no particular order

Recent Industry Developments
- January 2026: Larsen & Toubro clinched a USD 2.16 billion hybrid annuity contract for a 240-kilometer Uttar Pradesh expressway that will deploy precast superstructures to meet a December 2029 deadline.
- December 2025: Adani Realty and Brookfield Asset Management formed a USD 1.44 billion joint venture to build a 10-million-ft² industrial-logistics park in Navi Mumbai, including an on-site freight rail siding.
- November 2025: Tata Projects secured a USD 1.14 billion EPC mandate from Solar Energy Corporation of India for a 1,200-MW solar park in Rajasthan, scheduled for June 2027 commissioning.
- October 2025: Godrej Properties bought a 25-acre Bengaluru parcel for USD 216 million to develop a 2.5-million-ft² mixed-use campus targeting LEED Platinum certification.


India Construction Market Report Scope
Construction is the installation, maintenance, and repair of buildings and other stationary structures, as well as the construction of roadways and service facilities that form fundamental components of structures and are required for their operation.
The Indian Construction Market is segmented by Sector (Commercial Construction, Residential Construction, Industrial Construction, Infrastructure (Transportation) Construction, and Energy and Utility Construction). The report offers market size and forecasts for the Indian construction market in value (USD billion) for all the above segments.
By Sector
| Residential | Apartments/Condominiums |
| Villas/Landed Houses | |
| Commercial | Office |
| Retail | |
| Industrial and Logistics | |
| Others | |
| Infrastructure | Transportation Infrastructure (Roadways, Railways, Airways, others) |
| Energy & Utilities | |
| Others |
By Construction Type
| New Construction |
| Renovation |
By Construction Method
| Conventional On-Site |
| Modern Methods of Construction (Prefabricated, Modular, etc) |
By Investment Source
| Public |
| Private |
By Region
| North India |
| South India |
| West India |
| East India |
| Central India |
| By Sector | Residential | Apartments/Condominiums |
| Villas/Landed Houses | ||
| Commercial | Office | |
| Retail | ||
| Industrial and Logistics | ||
| Others | ||
| Infrastructure | Transportation Infrastructure (Roadways, Railways, Airways, others) | |
| Energy & Utilities | ||
| Others | ||
| By Construction Type | New Construction | |
| Renovation | ||
| By Construction Method | Conventional On-Site | |
| Modern Methods of Construction (Prefabricated, Modular, etc) | ||
| By Investment Source | Public | |
| Private | ||
| By Region | North India | |
| South India | ||
| West India | ||
| East India | ||
| Central India | ||


Key Questions Answered in the Report
What is the size of the India construction market in 2026?
The India construction market was valued at USD 0.79 trillion in 2026.
Which sector currently commands the highest share of spending?
Residential work retained 44.68% of 2025 value, making it the single-largest contributor to total activity.
What is driving the fastest growth within infrastructure?
Front-loaded transport capex and the 500 GW renewable-energy target are accelerating project awards and EPC activity.
What growth rate is expected for the India construction market?
The market is projected to grow at a CAGR of 6.87%, reaching USD 1.10 trillion by 2031.
Page last updated on:


