Market Overview
| Study Period | 2020 - 2031 |
|---|---|
| Forecast Data Period | 2026 - 2031 |
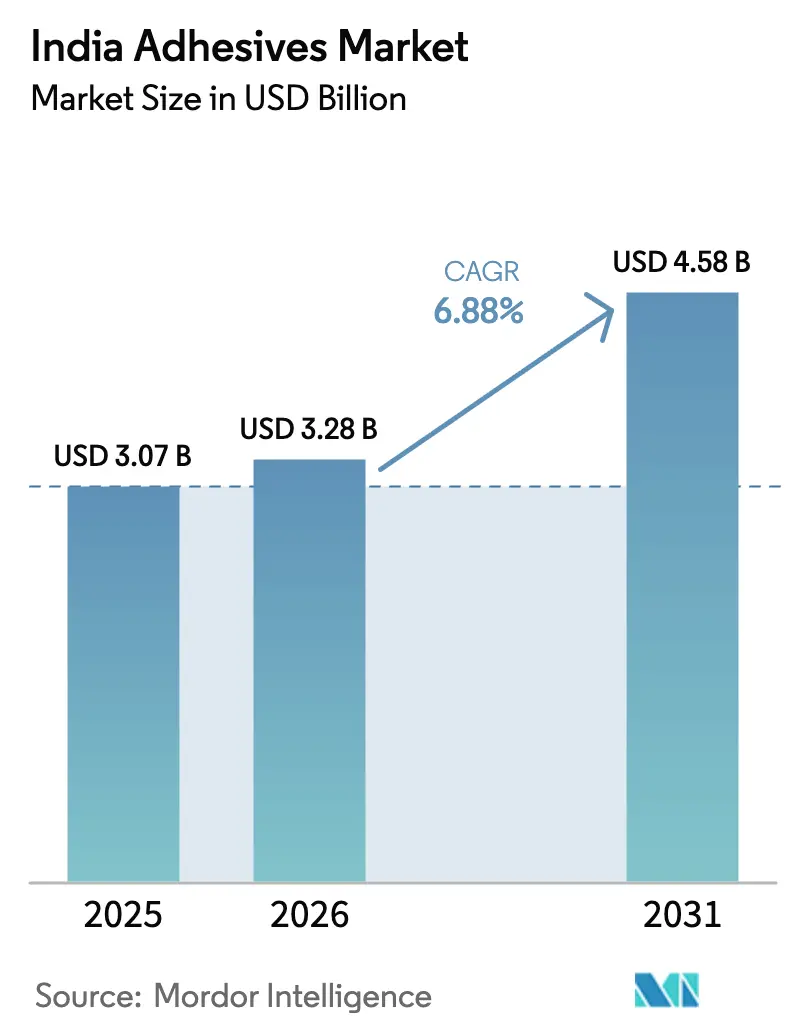
| Base Year Market Size (2025) | USD 3.07 Billion |
| Market Size (2026) | USD 3.28 Billion |
| Market Size (2031) | USD 4.58 Billion |
| Growth Rate (2026 - 2031) | 6.88% CAGR |
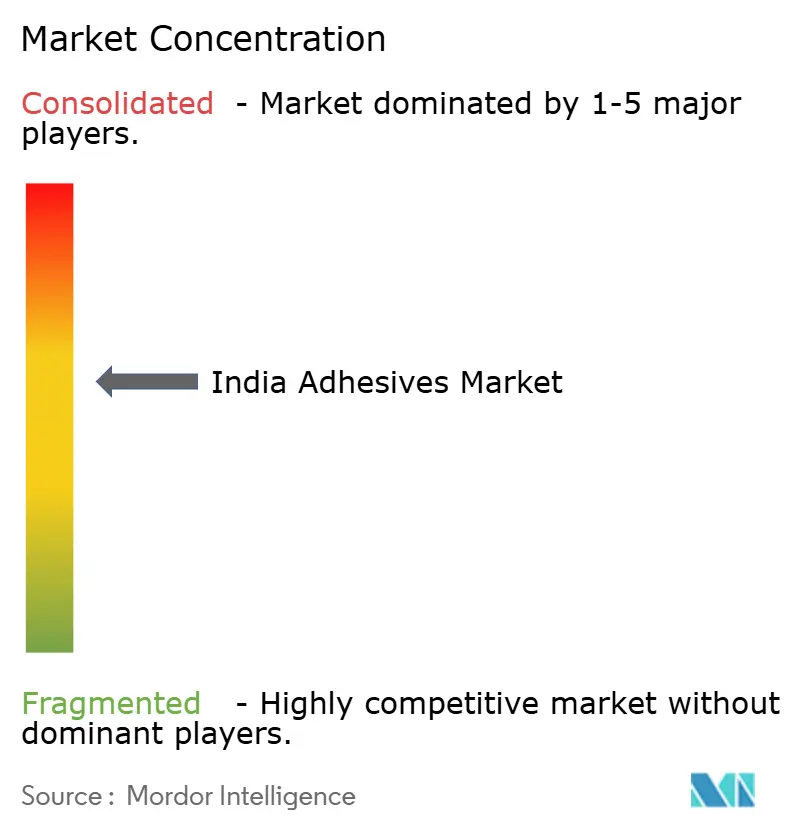
| Market Concentration | Medium |
Major Players *Disclaimer: Major Players sorted in no particular order Image © Mordor Intelligence. Reuse requires attribution under CC BY 4.0. | |
India Adhesives Market Analysis by Mordor Intelligence
The India Adhesives Market size is expected to grow from USD 3.07 billion in 2025 to USD 3.28 billion in 2026 and is forecast to reach USD 4.58 billion by 2031 at 6.88% CAGR over 2026-2031. Favorable policy spending on transport corridors, surging e-commerce packaging volumes, and automotive electrification sustain a multi-year expansion path. Construction demand rises fastest because National Infrastructure Pipeline projects accelerate metro rail, highway, and smart-city activity that needs structural, tile, and waterproofing formulations. Packaging retains leadership thanks to sustainable-pack regulations that steer brand owners toward recyclable-compatible bonding solutions. Automotive, electronics, and the emerging aerospace supply chain diversify revenue and cushion cyclical risk across the India adhesives market. Moderate raw-material inflation and stricter certification norms temper margins, yet domestic manufacturing incentives and technology localization balance near-term pressures.
Key Report Takeaways
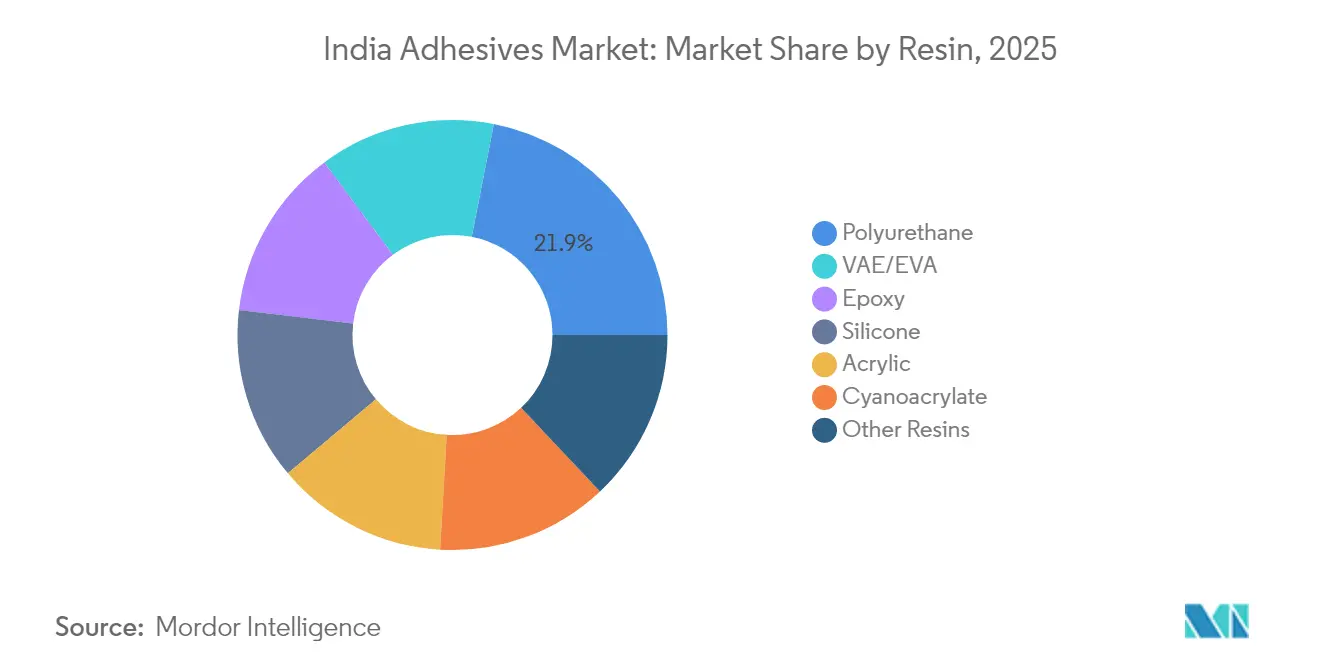
- By resin, polyurethane led with 21.92% of the India adhesives market share in 2025 while VAE/EVA is poised to expand at a 7.70% CAGR through 2031.
- By technology, hot-melt captured 36.62% revenue share of the India adhesives market size in 2025 and is projected to grow at a 7.05% CAGR to 2031.
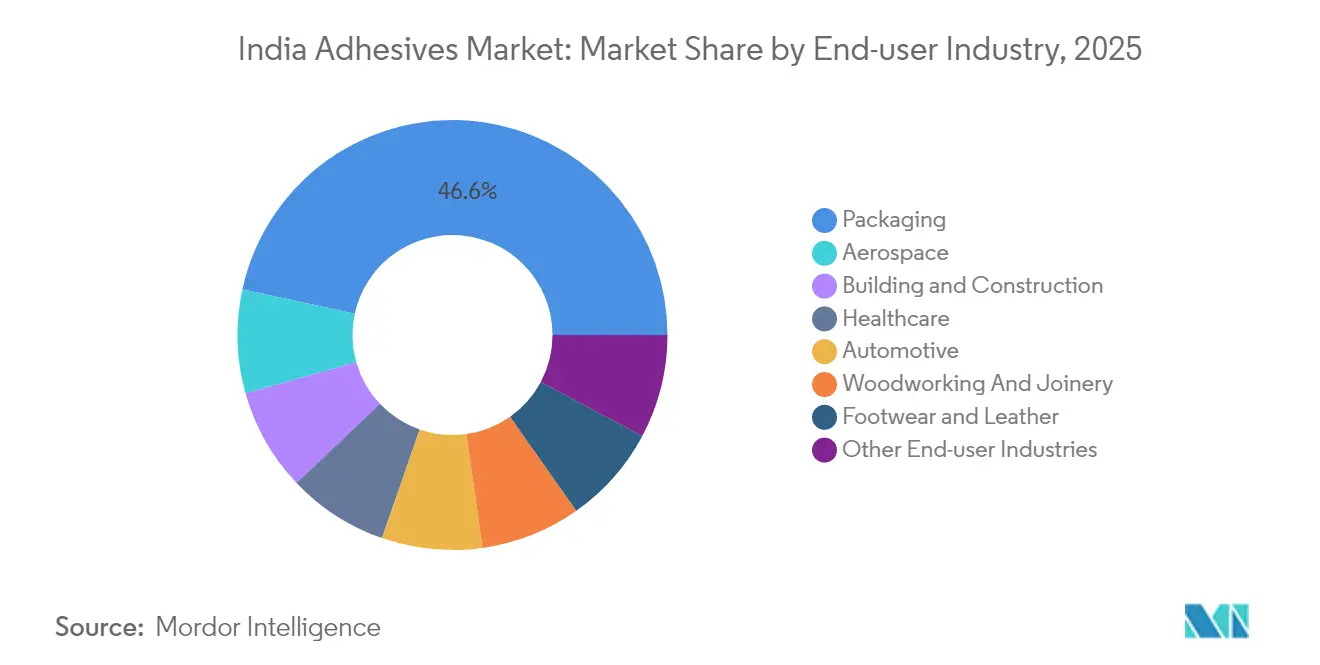
- By end-user, packaging accounted for 46.58% share of the India adhesives market size in 2025, whereas aerospace is forecast to advance at a 7.22% CAGR through 2031.
Note: Market size and forecast figures in this report are generated using Mordor Intelligence’s proprietary estimation framework, updated with the latest available data and insights as of 2026.
India Adhesives Market Trends and Insights
Drivers Impact Analysis*
| Drivers | (~) % Impact on CAGR Forecast | Geographic Relevance | Impact Timeline |
|---|---|---|---|
| Government mega-infrastructure push fuels construction adhesive demand | +1.8% | National, with concentration in Maharashtra, Gujarat, Karnataka, Tamil Nadu | Medium term (2-4 years) |
| Rapid e-commerce growth drives sustainable packaging adhesives | +1.5% | National, with early gains in Mumbai, Delhi, Bengaluru, Chennai | Short term (≤ 2 years) |
| Auto-EV localisation needs lightweight and battery-grade adhesives | +1.2% | Western and Southern India automotive clusters | Medium term (2-4 years) |
| PLI-led electronics manufacturing boosts high-performance adhesives | +1.0% | Tamil Nadu, Karnataka, Uttar Pradesh, Gujarat | Medium term (2-4 years) |
| Bio-/water-based shift under VOC norms spurs research and development investment | +0.8% | National, with regulatory focus in industrial zones | Long term (≥ 4 years) |
| Source: Mordor Intelligence | |||


Government Mega-Infrastructure Push Fuels Construction Adhesive Demand
Record public capital outlays lift demand for structural bonding products across metro rail, expressway, and airport packages. Cement consumption targets above 485 million tons by FY26 mirror rising use of tile adhesives and waterproofing compounds in precast and high-performance concrete systems. Bharatmala and freight-corridor alignments require chemical-resistant sealants for bridge bearings and tunnel linings, opening niches for high-temperature epoxy and polyurethane grades. Market demand clusters in Maharashtra, Gujarat, and Karnataka, where industrial corridors amplify building activity. Suppliers scale localized production to minimize freight costs and meet stringent on-site curing timelines.
Rapid E-Commerce Growth Drives Sustainable Packaging Adhesives
Online retail peaks surpass 1.5 billion monthly parcels, intensifying the use of hot-melt, laminating, and pressure-sensitive technologies that allow high-speed carton sealing. Extended Producer Responsibility rules set rising recycled-content thresholds that favor solvent-free laminating adhesives compatible with mono-material films. Brand owners pilot bio-based sticks sourced from starch and cellulose to align with circular-economy pledges. Adhesive formulators upgrade pilot plants to test bond integrity on PCR substrates and meet migrating-substance limits.
Auto-EV Localisation Needs Lightweight and Battery-Grade Adhesives
Electric-vehicle penetration is growing, and domestic value-addition targets of 50% intensify sourcing of thermally conductive gap fillers, cell-module sealants, and low-density structural acrylics. Battery production incentives stimulate demand for polyurethane potting and silicone gasketing that manage heat and vibration. Lightweight body designs drive aluminum-steel hybrid joining, replacing welding with crash-durable epoxy adhesives. Tier-1 suppliers establish validation labs near Pune and Chennai to qualify materials under UNECE R-100 and AIS-156 standards. Domestic formulators cooperate with OEMs to build pilot lines for battery-grade dispenser systems[1]Ministry of Commerce & Industry, “Revolutionizing Mobility: The Make in India Auto Story,” pib.gov.in.
PLI-Led Electronics Manufacturing Boosts High-Performance Adhesives
Smartphone and display fabs in Tamil Nadu and Uttar Pradesh require UV-curable and optically clear materials for bezel-less screens and camera modules. India’s USD 300 billion electronic-exports target depends on adhesives that pass JEDEC thermal-cycling and IPC-TM-650 reliability tests. The semiconductor mission opens opportunities for die-attach epoxies and underfills tailored for 28-nm and 40-nm nodes. Local contract manufacturers seek RoHS-compliant alternatives to tin-lead solders, accelerating the adoption of conductive adhesives with silver and graphene fillers. Supply-chain diversification from China brings global vendors to license technology to Indian partners[2]Economic and Political Weekly, “Making Production-linked Incentive Scheme Work,” epw.in.
Restraints Impact Analysis*
| Restraints | (~) % Impact on CAGR Forecast | Geographic Relevance | Impact Timeline |
|---|---|---|---|
| Crude-linked raw-material price volatility squeezes margins | -1.2% | National, with higher impact on import-dependent manufacturers | Short term (≤ 2 years) |
| BIS and CPCB compliance raises formulation cost and time-to-market | -0.8% | National, with stricter enforcement in industrial zones | Medium term (2-4 years) |
| Fragmented SME supply base limits quality and scale economics | -0.5% | National, with concentration in traditional manufacturing clusters | Long term (≥ 4 years) |
| Source: Mordor Intelligence | |||
BIS and CPCB Compliance Raises Formulation Cost and Time-to-Market
Mandatory BIS certification obliges foreign and domestic plants to undergo audits and extensive performance testing that can delay launches by up to a year. CPCB rules on recycled-content marking impose costs estimated at INR 7,900 per t for multilayer packaging, eroding margins in low-price segments. Volatile-organic-compound caps force reformulation of solvent-borne systems, demanding investments in pilot coaters and accelerated-aging chambers. Smaller players struggle with documentation, pushing customers toward large incumbents and fostering market consolidation.
Fragmented SME Supply Base Limits Quality and Scale Economics
Around 60% of adhesive units operate below INR 500 crore revenue, lacking automated QC, accelerated-aging ovens, and in-house rheology labs. Quality inconsistency compels large FMCG and automotive buyers to dual-source and conduct repeat incoming tests, raising procurement overheads. Limited scale means higher per-unit energy and logistics costs, widening price gaps versus integrated multinationals. Restricted access to capital constrains SME investments in sustainability certification, blocking entry to premium export segments. The India adhesives market therefore sees clustering of high-value contracts with major incumbents while SMEs remain in commoditized niches.
*Our forecasts treat driver/restraint impacts as directional, not additive. The impact forecasts reflect baseline growth, mix effects, and variable interactions.
Segment Analysis
By Resin: Polyurethane Versatility Anchors Leadership
Polyurethane captured 21.92% of revenue in 2025, driven by flexible, chemical-resistant bonds that outperform in automotive assembly, façade panels, and electronics encapsulation. The category benefits from scalable local polyol production that stabilizes supply. VAE/EVA emerges as the pace-setter with 7.70% CAGR thanks to recyclable-friendly hot-melt sticks popular in e-commerce packaging. Bio-based initiatives spur longer-term substitution using PLA and lignin derivatives, though commercial volumes will remain modest through 2031. Epoxies retain niche strength in aerospace composite bonding and rail infrastructure, where shear resistance above 25 MPa is mandatory. Acrylic systems grow steadily in window glazing and truck body assembly, capitalizing on superior UV stability.
Polyurethane producers invest in moisture-cure prepolymers that achieve tack-free times under 10 minutes, supporting faster construction cycles. VAE vendors deploy melt-index optimizations to improve machinability on high-speed case-erectors. Epoxy formulators develop nano-silica toughened grades to raise impact resistance for CFRP joints. Silicone adhesive demand grows with electronics thermal-management requirements, while cyanoacrylate sales track rising DIY and medical-device usage.


By Technology: Hot-Melt Dominates Processing Economics
Hot-melt held a 36.62% share in 2025 and continues to widen its lead because solvent-free, fast-setting profiles deliver high throughput at low energy consumption. Automated packaging lines in Mumbai and Bengaluru can reach 600 cartons per minute using metallocene-based sticks that cut consumption by 15%. Water-borne dispersion demand advances in furniture and building finishing, where VOC limits tighten. Reactive urethane hot-melts climb in automotive headlamp and composite nests where green strength and final cohesion are critical. UV-cure technology gains share in smartphones, wearables, and optical fiber connectors, where instant processing offsets higher resin cost.
Equipment manufacturers introduce closed-loop melters that lower char formation, extending nozzle life. Solvent-borne volumes erode 4% annually except in niche footwear and automotive retrofit, where surface tolerance and penetration trump sustainability. Hybrid chemistries, mixing moisture-cure silicones with acrylic dispersions, emerge for façade panels requiring both flexibility and adhesion to coated aluminum.
By End-User Industry: Packaging Leads, Aerospace Accelerates
Packaging dominated with 46.58% revenue in 2025, propelled by parcel growth and food-safe laminate adoption. Order volumes from quick-commerce warehouses drive demand for low-application-temperature sticks that cut downtime. The India adhesives market continues to rely on packaging to anchor baseline consumption. Aerospace accelerates at a 7.22% CAGR as aircraft OEMs localize nacelle and interior parts. Construction remains a pillar through widespread metro-rail expansion that specifies tile adhesive classes C2 TES1 and C2 TES2 for elevated stations.
Automotive pivots toward battery and lightweight assemblies. Healthcare consumption grows in transdermal patches, catheter assembly, and diagnostic strip lamination, emphasizing ISO 10993 compliance. Woodworking demand tracks affordable housing and ready-to-assemble furniture trends, favoring polyurethane dispersions that eliminate formaldehyde.
Geography Analysis
Maharashtra is a major consumption hub, riding packaging clusters near Mumbai, pharmaceutical exports from Thane, and automotive assembly in Pune. Government infrastructure budgets fund the Mumbai Coastal Road and Nagpur-Mumbai expressway, boosting construction-grade purchases. Gujarat is underpinned by integrated petrochemical availability in Dahej and Jamnagar and diversified downstream industries spanning textiles to automotive. The state’s plug-and-play zones at Dholera attract greenfield electronics assemblers that specify high-reliability UV-cure products.
Tamil Nadu is growing as PLI-supported smartphone, EV, and solar component plants mushroom around Chennai and Hosur. Karnataka's consumption is based on aerospace assemblies in Bengaluru and rapid e-commerce warehousing along the Bengaluru-Hyderabad corridor. However, Uttar Pradesh and Haryana, with Noida electronics parks and Gurugram automotive testing centers, experience moderate growth due to intermittent policy incentives.
Competitive Landscape
The Indian adhesives market is moderately fragmented. Pidilite Industries commands strong brand affinity in consumer and carpenter channels through Fevicol, FeviKwik, and Dr. Fixit families. Strategies concentrate on bio-based portfolio launches, low-temperature hot-melt grades, and adhesive-as-a-service platforms offering on-site audits and training. Digital ordering portals and QR-code product tracing improve supply visibility. BIS certification and CPCB waste audits act as compliance barriers, guarding incumbents from low-cost entrants. White-space growth lies in aerospace structural epoxy, battery pack encapsulation, and medical device assembly, where specialized testing and regulatory hoops restrict new competitors.
India Adhesives Industry Leaders
3M
H.B. Fuller Company
Henkel AG & Co. KGaA
Pidilite Industries Ltd.
Arkema
- *Disclaimer: Major Players sorted in no particular order

Recent Industry Developments
- February 2025: Henkel unveiled a new Application Engineering Center in Chennai, Tamil Nadu, bolstering its Adhesive Technologies division's leadership in the electronics arena.
- July 2024: Henkel inaugurated a Loctite factory at Kurkumbh, Maharashtra with automated storage and LEED Gold design to localize high-performance grades.


India Adhesives Market Report Scope
Aerospace, Automotive, Building and Construction, Footwear and Leather, Healthcare, Packaging, Woodworking and Joinery are covered as segments by End User Industry. Hot Melt, Reactive, Solvent-borne, UV Cured Adhesives, Water-borne are covered as segments by Technology. Acrylic, Cyanoacrylate, Epoxy, Polyurethane, Silicone, VAE/EVA are covered as segments by Resin.By Resin
| Polyurethane |
| Epoxy |
| Acrylic |
| Silicone |
| Cyanoacrylate |
| VAE / EVA |
| Other Resins |
By Technology
| Water-borne |
| Solvent-borne |
| Reactive |
| Hot-Melt |
| UV Cured |
By End-user Industry
| Aerospace |
| Automotive |
| Building and Construction |
| Footwear and Leather |
| Healthcare |
| Packaging |
| Woodworking And Joinery |
| Other End-user Industries |
| By Resin | Polyurethane |
| Epoxy | |
| Acrylic | |
| Silicone | |
| Cyanoacrylate | |
| VAE / EVA | |
| Other Resins | |
| By Technology | Water-borne |
| Solvent-borne | |
| Reactive | |
| Hot-Melt | |
| UV Cured | |
| By End-user Industry | Aerospace |
| Automotive | |
| Building and Construction | |
| Footwear and Leather | |
| Healthcare | |
| Packaging | |
| Woodworking And Joinery | |
| Other End-user Industries |


Market Definition
- End-user Industry - Building & Construction, Packaging, Automotive, Aerospace, Woodworking & Joinery, Footwear & Leather, Healthcare, and Others are the end-user industries considered under the adhesives market.
- Product - All adhesive products are considered in the market studied
- Resin - Under the scope of the study, resins like Polyurethane, Epoxy, Acrylic, Cyanoacrylate, VAE/EVA, and Silicone are considered
- Technology - For the purpose of this study, Water-borne, Solvent-borne, Reactive, Hot Melt, and UV Cured adhesive technologies are taken into consideration.
| Keyword | Definition |
|---|---|
| Hot-melt Adhesive | Hot melt adhesives are generally 100% solid formulations, based on thermoplastic polymers. They are solid at room temperature and are activated upon heating above their softening point, at which stage they are liquid, and hence, can be processed. |
| Reactive Adhesive | A reactive adhesive is made up of monomers that react in the adhesive curing process and do not evaporate from the film during use. Instead, these volatile components become chemically incorporated into the adhesive. |
| Solvent-borne Adhesive | Solvent-borne adhesives are mixtures of solvents and thermoplastic, or slightly cross-linked polymers, such as polychloroprene, polyurethane, acrylic, silicone, and natural and synthetic rubbers (elastomers). |
| Water-borne Adhesive | Water-borne adhesives use water as a carrier or diluting medium to disperse a resin. They are set by allowing the water to evaporate or be absorbed by the substrate. These adhesives are compounded with water as a diluent, rather than a volatile organic solvent. |
| UV Cured Adhesive | UV curing adhesives induce curing and create a permanent bond without heating by using ultraviolet (UV) light or other radiation sources. An aggregation of monomers and oligomers is cured or polymerized by ultraviolet (UV) or visible light in a UV adhesive. Because UV is a radiating energy source, UV adhesives are often referred to as radiation curing or rad-cure adhesives. |
| Heat-resistant Adhesive | Heat-resistant Adhesives refer to those that do not break down under high temperatures. One aspect of a complicated system of circumstances is the adhesive's capacity to withstand disintegration brought on by high temperatures. As the temperature rises, adhesives may liquefy. They can withstand stresses resulting from differing coefficients of expansion and contraction, which might be an additional advantage. |
| Reshoring | Reshoring is the practice of moving commodity production and manufacturing back to the nation where the business was founded. Onshoring, inshoring, and back shoring are further terms used. Offshoring, the practice of producing items abroad to lower labor and manufacturing costs, is the opposite of this. |
| Oleochemicals | Oleochemicals are compounds produced from biological oils or fats. They resemble petrochemicals, which are substances made from petroleum. The oleochemical business is built on the hydrolysis of oils or fats. |
| Nonporous Materials | Nonporous materials are substances that do not permit the passage of liquid or air. Nonporous materials are those that are not porous, such as glass, plastic, metal, and varnished wood. Since no air can get through, less airflow is required to raise these materials, negating the requirement for high airflow. |
| EU-Vietnam Free Trade Agreement | A trade agreement and an investment protection agreement were concluded between the European Union and Vietnam on June 30, 2019. |
| VOC content | Compounds with limited solubility in water and high vapor pressure are known as Volatile Organic Compounds (VOCs). Many VOCs are human-made chemicals that are used and produced in the manufacture of paints, pharmaceuticals, and refrigerants. |
| Emulsion Polymerization | Emulsion polymerization is a method of producing polymers or connected groups of smaller chemical chains known as monomers, in a water solution. The method is often used to make water-based paints, adhesives, and varnishes, in which the water stays with the polymer and is marketed as a liquid product. |
| 2025 National Packaging Targets | In 2018, the Australian Environment Ministry set the following 2025 National Packaging Targets: 100% of the packaging must be reusable, recyclable, or compostable by 2025, 70% of plastic packaging must be recycled or composted by 2025, 50% of average recycled content must be included in packaging by 2025, and problematic and unnecessary single-use plastic packaging must be phased out by 2025. |
| Russian Government’s Import Substitution Policy | The Western sanctions suspended the distribution of several high-tech items to Russia, including those required by the raw material export sectors and the military-industrial complex. In response, the government launched an "import substitution" scheme, appointing a special commission to oversee its implementation in early 2015. |
| Paper Substrate | Paper substrates are paper sheets, reels, or boards with a base weight of up to 400 g/m2 that has not been converted, printed or otherwise altered. |
| Insulation Material | A material that inhibits or blocks heat, sound, or electrical transmission is known as Insulation Material. The variety of insulation materials includes thick fibers like fiberglass, rock and slag wool, cellulose, and natural fibers as well as stiff foam boards and sleek foils. |
| Thermal Shock | A temperature change known as thermal shock generates stress in a material. It commonly results in material breakdown and is especially prevalent in brittle materials like ceramics. When there is a quick temperature change, either from hot to cold or vice versa, this process occurs abruptly. It occurs more frequently in materials with poor heat conductivity and insufficient structural integrity. |


Research Methodology
Mordor Intelligence follows a four-step methodology in all our reports.
- Step-1: Identify Key Variables: The quantifiable key variables (industry and extraneous) pertaining to the specific product segment and country are selected from a group of relevant variables & factors based on desk research & literature review; along with primary expert inputs. These variables are further confirmed through regression modeling (wherever required).
- Step-2: Build a Market Model: In order to build a robust forecasting methodology, the variables and factors identified in Step-1 are tested against available historical market numbers. Through an iterative process, the variables required for market forecast are set and the model is built on the basis of these variables.
- Step-3: Validate and Finalize: In this important step, all market numbers, variables and analyst calls are validated through an extensive network of primary research experts from the market studied. The respondents are selected across levels and functions to generate a holistic picture of the market studied.
- Step-4: Research Outputs: Syndicated Reports, Custom Consulting Assignments, Databases & Subscription Platforms


