In Vivo CRO Market Size and Share
Market Overview
| Study Period | 2019 - 2030 |
|---|---|
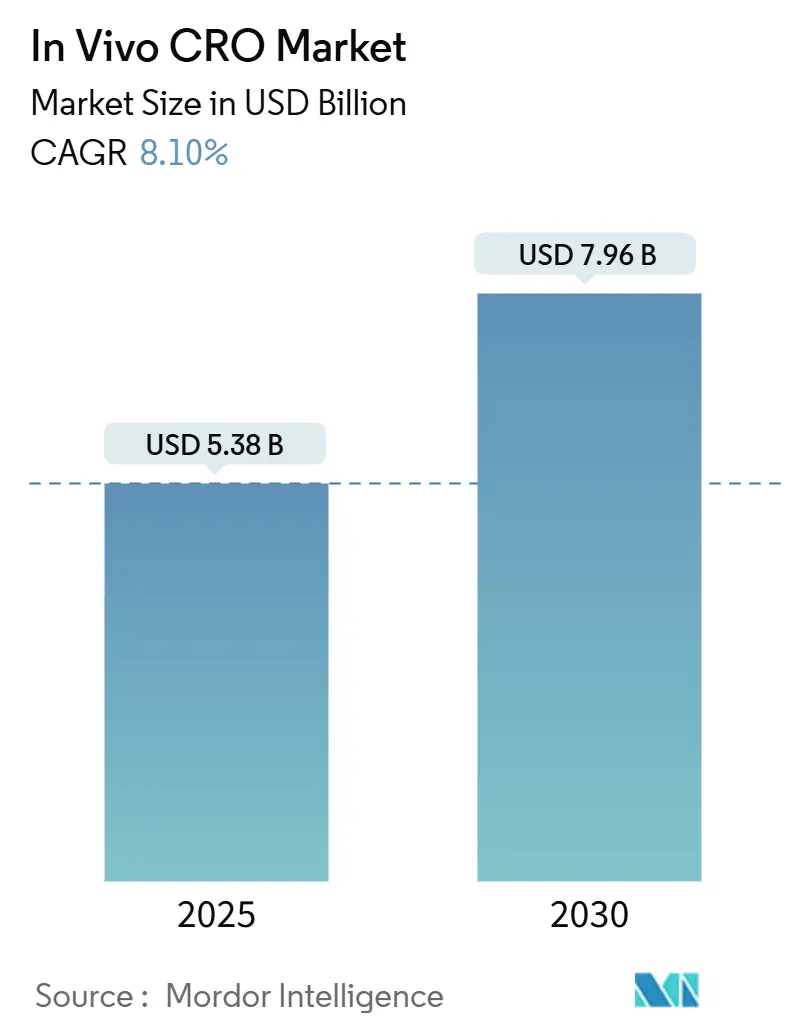
| Market Size (2025) | USD 5.38 Billion |
| Market Size (2030) | USD 7.96 Billion |
| Growth Rate (2025 - 2030) | 8.10% CAGR |
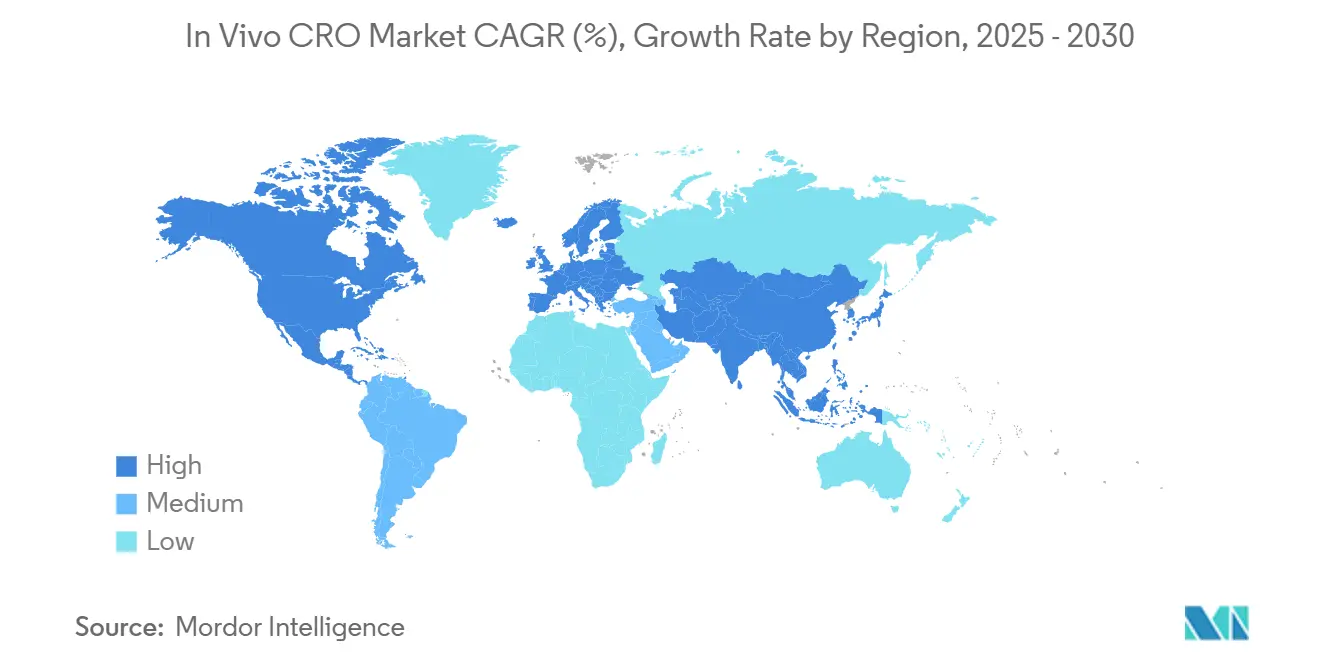
| Fastest Growing Market | Asia Pacific |
| Largest Market | North America |
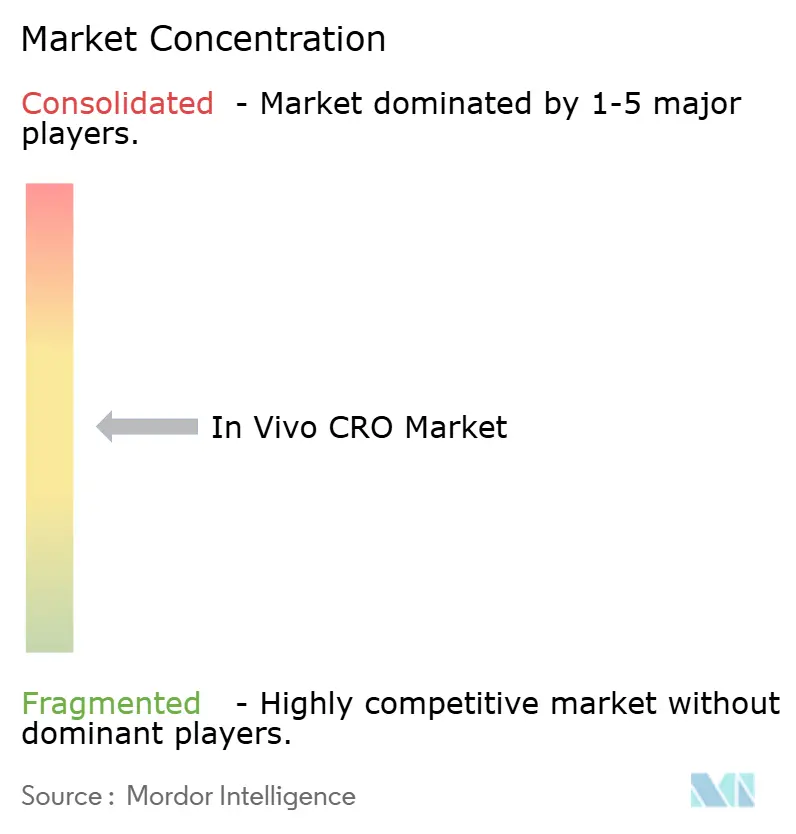
| Market Concentration | Medium |
Major Players *Disclaimer: Major Players sorted in no particular order Image © Mordor Intelligence. Reuse requires attribution under CC BY 4.0. | |
In Vivo CRO Market Analysis by Mordor Intelligence
The in vivo CRO market size is valued at USD 5.38 billion in 2025 and is projected to reach USD 7.96 billion by 2030, advancing at an 8.1% CAGR over the forecast period. Climbing R&D intensity among biopharma companies, which devoted more than USD 800 billion to research during the past decade, underpins steady demand for outsourced safety and efficacy studies. Sponsors continue shifting work to contract research partners to shorten discovery-to-IND timelines that can otherwise stretch 10-15 years and cost USD 2.6 billion per approved therapy. North American drug makers retain a first-mover edge thanks to mature GLP infrastructure, yet Asian providers capture momentum through cost advantages and rapid facility additions. Parallel advances in AI-guided study design, virtual control groups, and humanized disease models are helping contract labs compress cycle times, contain animal use, and win repeat business from pipeline-rich oncology developers.
Key Report Takeaways
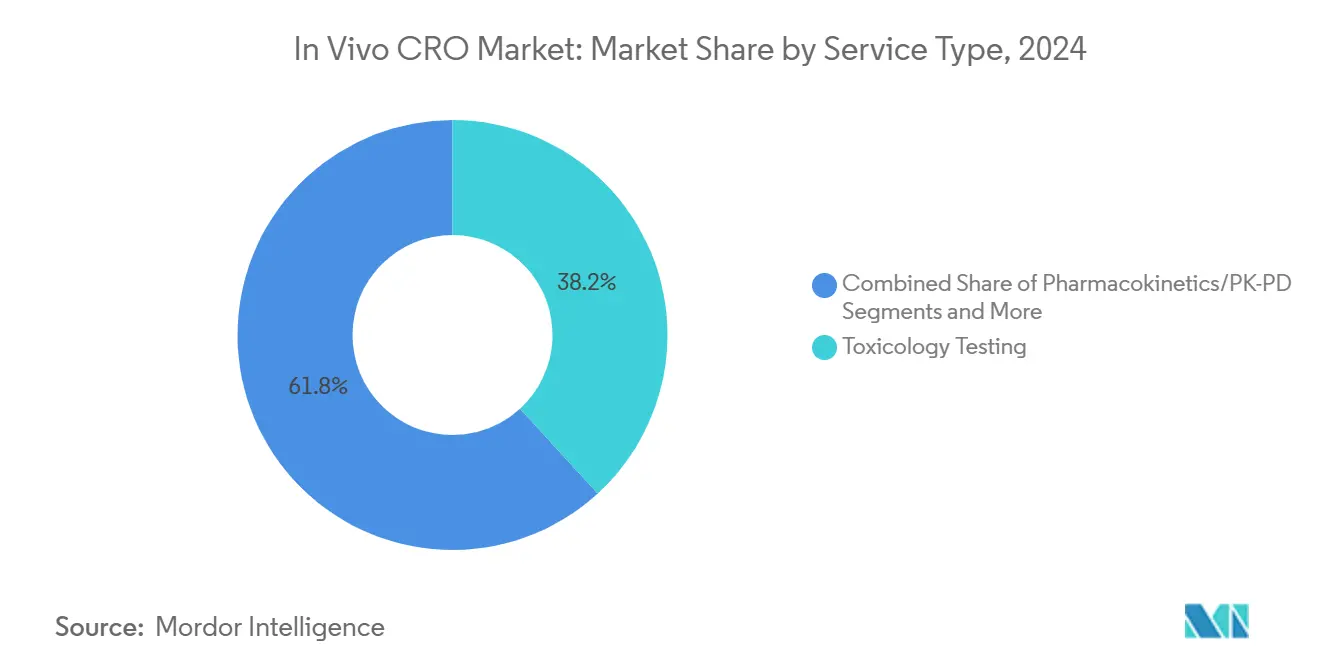
- By service type, toxicology testing led with 38.2% revenue share in 2024; bioanalysis and biomarkers are forecast to expand at an 11.8% CAGR to 2030.
- By animal model, rodents accounted for 64.8% share of the in vivo CRO market size in 2024, and humanized models are advancing at a 10.5% CAGR through 2030
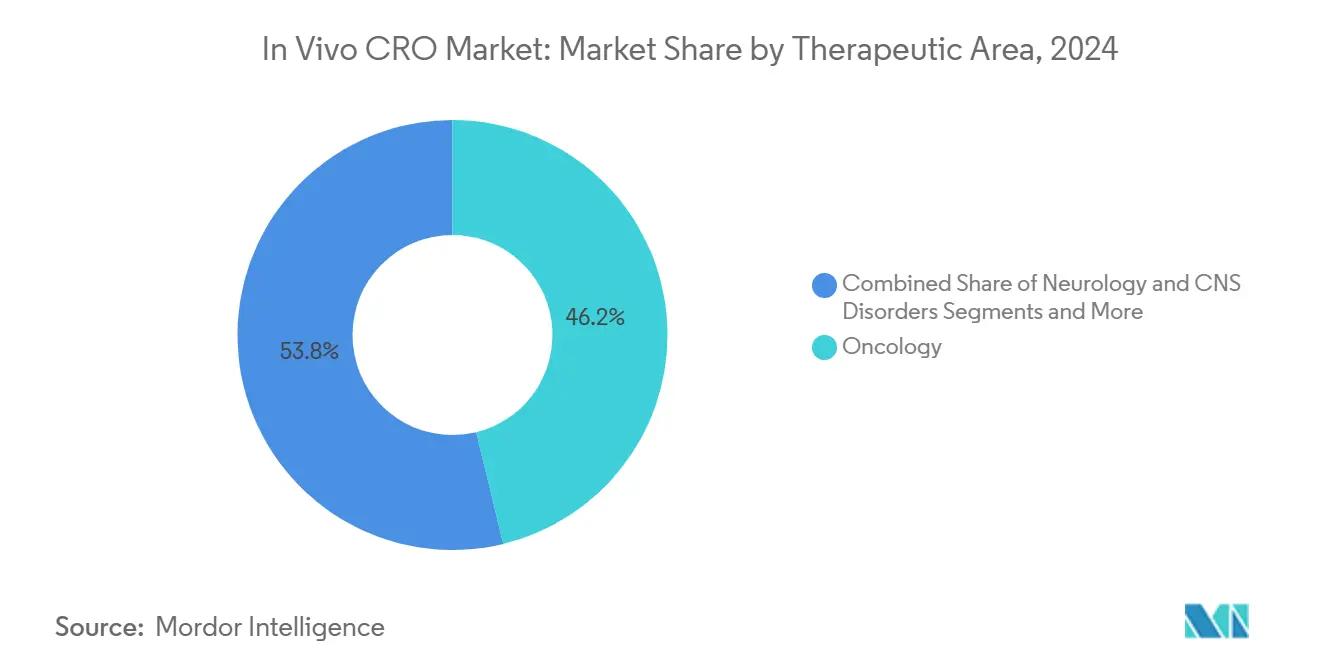
- By therapeutic area, oncology held 46.2% of the in vivo CRO market share in 2024, while it is set to grow at a 12.6% CAGR to 2030.
- By end user, pharmaceutical and biotech companies dominated, with a 72.9% share in 2024, while contract vivarium startups are poised for a 13.2% CAGR to 2030.
- By geography, North America captured 42.1% revenue share in 2024; Asia Pacific is projected to register an 8.3% CAGR through 2030.
Global In Vivo CRO Market Trends and Insights
Drivers Impact Analysis*
| Driver | (~) % Impact on CAGR Forecast | Geographic Relevance | Impact Timeline |
|---|---|---|---|
| Escalating Biopharma R&D Spend & Pipeline Expansion | +2.10% | Global, with concentration in North America & Europe | Long term (≥ 4 years) |
| Shift Toward Outsourced Preclinical Toxicology To Cut Cycle-Times | +1.80% | Global, particularly strong in APAC | Medium term (2-4 years) |
| Stricter Global Safety Regulations Mandating GLP In-Vivo Studies | +1.50% | Global, led by FDA, EMA regulatory frameworks | Long term (≥ 4 years) |
| Oncology Dominance Driving Demand For Complex Disease Models | +1.30% | North America & Europe, expanding to APAC | Medium term (2-4 years) |
| AI-Guided Study-Design Platforms Reducing Repeat In-Vivo Experiments | +0.90% | North America & Europe early adopters | Short term (≤ 2 years) |
| Emergence Of Contract-Vivarium (CV) Facilities For Flexible Capacity | +0.40% | North America biohubs, expanding globally | Medium term (2-4 years) |
| Source: Mordor Intelligence | |||
Escalating Biopharma R&D Spend & Pipeline Expansion
R&D investment across the global pharmaceutical sector continues to outpace broader corporate spending, with more than 8,000 active clinical candidates feeding a deep preclinical funnel.[1]Pharmaceutical Research and Manufacturers of America, “2025 Pharmaceutical R&D Facts,” phrma.org High-value modalities such as cell and gene therapies, antibody drug conjugates, and RNA therapeutics demand layered toxicology and pharmacology packages that lift utilization rates at specialized CROs. The sustained double-digit rise in IND filings forces sponsors to reserve capacity years in advance, helping full-service providers lock in multi-year master service agreements. At the same time, regulatory expectations for mechanistic understanding and translational relevance push demand toward sophisticated animal models able to mirror human disease biology. These dynamics solidify a long-run growth premium for the in vivo CRO market.
Shift Toward Outsourced Preclinical Toxicology to Cut Cycle Times
Facing average development outlays of USD 2.3 billion per NCE, drug makers seek leaner fixed-asset footprints and more variable cost structures.[2]U.S. Food and Drug Administration, “Potential Approaches to Drive Future Integration of New Alternative Methods,” fda.gov Outsourcing enables rapid access to non-human primate suites, surgical suites, and bioanalytical platforms without multiyear buildouts. Sponsor surveys show more than 80% of R&D leaders plan double-digit percentage increases in externalized spend through 2030, a trend that disproportionately benefits CROs offering harmonized global quality systems. Contract labs leverage economies of scale and centralized digital infrastructure to deliver 15-20% faster turnaround on repeat-dose toxicity studies relative to in-house groups, translating into earlier clinical readouts and longer commercial exclusivity windows. These efficiencies reinforce the appeal of the in vivo CRO market to pipeline-heavy biotech firms.
Stricter Global Safety Regulations Mandating GLP In-Vivo Studies
Authorities in the United States, European Union, Japan, and China require rigorous GLP compliance covering facility qualifications, staff training, and archival integrity. Recent FDA guidances that align biocompatibility testing with ISO 10993-1 have expanded the scope of mandatory large-animal and chronic toxicity work. Harmonization initiatives under ICH M3 continue to formalize study designs, prompting multinational sponsors to favor CROs with proven cross-jurisdictional audit records. Compliance burdens raise barriers to entry and accelerate consolidation, yet they also provide predictable demand visibility for labs already operating at GLP maturity. Providers that invest in real-time digital QA systems and remote regulatory inspections further differentiate in this quality-driven environment.
Oncology Dominance Driving Demand for Complex Disease Models
Oncology represented 46.2% of study volume in 2024 and maintains a pipeline CAGR of 12.6% through 2030, powered by immune-oncology combinations and next-generation radioligand therapies. These candidates rely on patient-derived xenografts, humanized immune-system mice, and advanced imaging endpoints to satisfy regulators’ translational expectations. Demand for multiplex biomarker analytics and longitudinal tumor burden assessment further lifts companion bioanalysis services. The oncology surge therefore multiplies revenue opportunities across both core toxicology and specialized efficacy segments in the in vivo CRO industry.
Restraints Impact Analysis*
| Restraint | (~) % Impact on CAGR Forecast | Geographic Relevance | Impact Timeline |
|---|---|---|---|
| Intensifying Activism & 3R Rules Limiting Animal Usage Quotas | -1.20% | Europe & North America, spreading globally | Long term (≥ 4 years) |
| Cyclical Slowdown In Big-Pharma R&D Budgets 2024-26 | -0.80% | Global, particularly North America & Europe | Short term (≤ 2 years) |
| Talent Shortage Of Certified In-Vivo Pathologists & Veterinarians | -0.70% | Global, most acute in North America & Europe | Medium term (2-4 years) |
| CRO Consolidation Creating Temporary Capacity Bottlenecks | -0.50% | Global, concentrated in major pharma hubs | Short term (≤ 2 years) |
| Source: Mordor Intelligence | |||
Intensifying Activism & 3R Rules Limiting Animal Usage Quotas
European Directive 2010/63/EU and the FDA’s alternative-methods roadmap compel justification of every animal used and encourage in-silico or in-vitro replacements. Public pressure, amplified by litigation and media coverage of welfare violations, forces sponsors to scrutinize supplier records and impose stricter sourcing audits. CROs lacking investment in organ-on-chip, microphysiological systems, or computational toxicology face long-term volume erosion as testing paradigms evolve. Yet the slow regulatory validation of NAMs means animal models will remain indispensable for systemic toxicity for at least another decade, creating a managed decline rather than a sudden falloff in demand.
Cyclical Slowdown in Big-Pharma R&D Budgets 2024-26
Patent cliffs wiping USD 95 billion from U.S. drug sales by 2029 trigger cost containment that temporarily stalls non-critical discovery programs. Some leading CROs reported mid-single-digit revenue dips in early 2025, echoing wider sentiment among publicly traded peers. While late-stage assets stay funded, exploratory projects and platform screens see pushouts, unevenly affecting small toxicology shops reliant on volume throughput. The lull is expected to ease post-2026 as biologics and specialty approvals recover top-line growth, restoring outsourced-testing momentum.
*Our forecasts treat driver/restraint impacts as directional, not additive. The impact forecasts reflect baseline growth, mix effects, and variable interactions.
Segment Analysis
By Service Type: Toxicology Testing Retains Primacy while Biomarkers Accelerate
Toxicology accounted for 38.2% of 2024 revenue, cementing its role as the regulatory gatekeeper for first-in-human authorization. Within this arena, chronic rodent studies and reproductive toxicity packages make up the largest sub-blocks, fueled by oncology and metabolic pipelines that require long-duration dosing. Sponsors increasingly bundle safety pharmacology and bioanalysis under single work orders, deepening wallet share for full-service CROs. Despite its scale, the segment faces moderate pricing pressure as NAMs nibble at acute and local-tolerance assays.
Bioanalysis and biomarkers, though smaller, is projected to post 11.8% annual growth as precision medicine drives demand for LC-MS/MS, immunoassays, and multi-omic profiling. Companion-diagnostic codevelopment requires early validation of predictive markers, feeding revenue into both regulated and discovery bioanalysis streams. The segment’s fast climb means its contribution to the in vivo CRO market size is expected to exceed USD 1 billion by 2030. Integration of AI bioinformatics and cloud-based LIMS further differentiates providers and cements long-term client stickiness.


By Animal Model: Rodent Supremacy Endures amid Humanized Upswing
Rodents collectively captured 64.8% of service demand in 2024 thanks to decades of historical control data, amenability to genetic manipulation, and cost efficiency.[3]Nature Editors, “Humanized Mouse Models of Drug Metabolism,” nature.com Standard mouse and rat strains underpin routine regulatory toxicity, while knockout and CRISPR-edited lines deliver mechanistic insights in oncology and metabolic studies. Volume density yields utilization economies that keep rodent-based pricing stable, supporting predictable cash flow for vivarium operators.
Humanized models deliver the fastest unit growth at a 10.5% CAGR, reflecting rising immuno-oncology and infectious-disease workloads that require human-relevant pharmacodynamic readouts. Platforms replacing murine CYP enzymes with human orthologs improve ADME predictability. Although unit prices run three-to-six times higher than standard strains, better clinical translatability offsets cost, encouraging broader adoption. Consequently, humanized systems are set to comprise more than 15% of the in vivo CRO market share by 2030.
By Therapeutic Area: Oncology Stays the Growth Engine
The oncology vertical generated 46.2% of 2024 spending and is forecast to compound 12.6% annually through 2030, buoyed by more than 1,500 active solid-tumor and hematology trials. Patient-derived xenografts, radiography-based tumor tracking, and humanized immune-system avatars command project premiums that elevate revenue per study. Regulatory focus on mechanism-based safety, such as cytokine release and on-target off-tumor effects, further expands ancillary assay needs.
Neurology and CNS research, the second-largest bucket, benefits from breakthroughs in blood–brain-barrier modulation and gene therapy vectors. Eleven agents targeting barrier repair mechanisms reached IND submission in 2025, doubling preclinical demand for microdialysis and neurobehavioral testing. Cardiovascular and metabolic programs maintain solid mid-single-digit growth, while vaccine and anti-infective work hold steady post-pandemic, sustaining a diversified in vivo CRO industry revenue mix.
By End User: Pharma Commands but Startups Gain Pace
Pharmaceutical and biotech sponsors generated 72.9% of contract volume in 2024, underlining their dominance as funding engines for advanced therapeutics. Large caps prefer multi-year strategic sourcing agreements that bundle discovery and IND-enabling spans, locking in price visibility and capacity. Meanwhile, venture-backed biotechs increasingly leverage modular outsourcing to stretch runway without heavy infrastructure spend.
Contract vivarium startups book the highest projected CAGR at 13.2% owing to surging demand for turnkey GLP-compliant space near academic and industrial clusters. These facilities supplement classical CRO offerings with self-directed study execution under sponsor oversight, appealing to hybrid virtual-lab operating models. Medical device, academic, and government users collectively fill remaining capacity, providing steady baseline volumes that buffer cyclical shifts in drug development.
Geography Analysis
North America retained 42.1% revenue in 2024, backed by the densest concentration of Big Pharma headquarters, robust NIH grant flows, and stringent FDA oversight that favors experienced GLP providers. Regional players leverage deep toxicology pedigrees and access to a mature pool of certified pathologists, underpinning premium pricing yet sustaining high utilization. Government incentives for reshoring critical drug production also encourage domestic preclinical outsourcing.
Europe follows as a mature but steady contributor, shaped by EU Directive 2010/63/EU and progressive 3R agendas. Sponsors here emphasize ethically optimized study designs, pushing CROs to integrate organ-on-chip assays and virtual control groups. Brexit-related regulatory divergence adds procedural friction but has not materially shifted demand away from legacy U.K. toxicology hubs. Sustained Horizon Europe funding keeps academic–industry consortia active, ensuring a reliable workflow for specialized disease models.
Asia Pacific delivers the fastest trajectory at 8.3% CAGR to 2030 as China, South Korea, and Singapore expand cGMP and GLP footprints. Chinese sites now host 10% of global clinical trials, reflecting a broader strategic pivot toward end-to-end drug development capabilities. However, U.S. legislative scrutiny of Chinese CROs under the BIOSECURE Act drives some sponsors to diversify into India and Southeast Asia, spreading volume across multiple APAC jurisdictions. Local governments support the shift through tax incentives and streamlined facility licensing, ensuring the region’s rising weight in the in vivo CRO market.

Competitive Landscape
The market shows moderate fragmentation, with the top five providers controlling roughly 55% of global revenue. Leading players anchor the leadership group by operating multi-continent facility networks, offering cradle-to-approval service menus, and maintaining long-term master service agreements with Big Pharma clients. Large CRADL networks highlight the scale advantage needed to absorb surge projects and cross-train staff across modalities. Strong revenue bases underscore the buying power these companies wield in acquiring specialty capabilities and negotiating reagent supply.
Mid-tier players focus on niche disease areas or regional proximity advantages, while contract-vivarium specialists cater to startups seeking hybrid outsourcing. Competitive differentiation is shifting toward adoption of AI study-design engines, digital pathology, and in-vitro alternatives. Partnerships to build nonclinical virtual control groups exemplify incumbent efforts to stay ahead of efficiency and ethical curves. Cloud-native laboratory information systems enable real-time sponsor access to study data, positioning firms for paperless regulatory submissions.
Regulatory compliance and audit readiness remain key entry hurdles. Zero-observation inspections at leading CRO facilities reinforce sponsor confidence despite geopolitical noise. Simultaneously, well-publicized welfare lapses and fines at smaller operators highlight reputational and financial risks of under-investing in quality oversight. Overall, sustained consolidation and technology spending point toward a gradually rising concentration ratio over the next decade.
In Vivo CRO Industry Leaders
Charles River Laboratories
WuXi AppTec
Labcorp Drug Development (Covance)
Eurofins Scientific
Envigo
- *Disclaimer: Major Players sorted in no particular order

Recent Industry Developments
- July 2025: Charles River and Autobahn Labs agreed to accelerate academic drug discovery programs.
- March 2025: WuXi AppTec's Changzhou and Taixing API manufacturing sites passed FDA inspections .
- April 2024: Charles River Laboratories expanded its Contract Research Animal Diagnostic Laboratory (CRADL) network, boosting Cambridge's capacity from 15,000 to 45,000 square feet and adding five new West Coast locations, each spanning 45,000 square feet. This expansion underscores the rising demand for flexible vivarium solutions in the preclinical market.


Global In Vivo CRO Market Report Scope
| Toxicology Testing |
| Pharmacokinetics / PK-PD |
| Efficacy & Disease Modeling |
| Bioanalysis & Biomarkers |
| Other Pre-clinical Services |
| Rodents (Mice & Rats) |
| Non-Human Primates |
| Canine / Porcine & Other Large Models |
| Zebrafish & Alternative Species |
| Genetically-Engineered / Humanized Models |
| Oncology |
| Neurology & CNS Disorders |
| Cardiovascular & Metabolic Diseases |
| Infectious & Respiratory Diseases |
| Others (Dermatology, Rare Diseases) |
| Pharmaceutical & Biotech Companies |
| Medical Device Manufacturers |
| Academic & Government Institutes |
| Contract Vivarium-based Start-ups |
| Others (Generic / Nutraceutical Firms) |
| North America | United States |
| Canada | |
| Mexico | |
| Europe | Germany |
| United Kingdom | |
| France | |
| Italy | |
| Spain | |
| Rest of Europe | |
| Asia Pacific | China |
| Japan | |
| India | |
| South Korea | |
| Australia | |
| Rest of Asia Pacific | |
| Middle East & Africa | GCC |
| South Africa | |
| Rest of Middle East & Africa | |
| South America | Brazil |
| Argentina | |
| Rest of South America |
| By Service Type | Toxicology Testing | |
| Pharmacokinetics / PK-PD | ||
| Efficacy & Disease Modeling | ||
| Bioanalysis & Biomarkers | ||
| Other Pre-clinical Services | ||
| By Animal Model | Rodents (Mice & Rats) | |
| Non-Human Primates | ||
| Canine / Porcine & Other Large Models | ||
| Zebrafish & Alternative Species | ||
| Genetically-Engineered / Humanized Models | ||
| By Therapeutic Area | Oncology | |
| Neurology & CNS Disorders | ||
| Cardiovascular & Metabolic Diseases | ||
| Infectious & Respiratory Diseases | ||
| Others (Dermatology, Rare Diseases) | ||
| By End User | Pharmaceutical & Biotech Companies | |
| Medical Device Manufacturers | ||
| Academic & Government Institutes | ||
| Contract Vivarium-based Start-ups | ||
| Others (Generic / Nutraceutical Firms) | ||
| By Geography | North America | United States |
| Canada | ||
| Mexico | ||
| Europe | Germany | |
| United Kingdom | ||
| France | ||
| Italy | ||
| Spain | ||
| Rest of Europe | ||
| Asia Pacific | China | |
| Japan | ||
| India | ||
| South Korea | ||
| Australia | ||
| Rest of Asia Pacific | ||
| Middle East & Africa | GCC | |
| South Africa | ||
| Rest of Middle East & Africa | ||
| South America | Brazil | |
| Argentina | ||
| Rest of South America | ||


Key Questions Answered in the Report
How large is the in vivo CRO market in 2025?
It is valued at USD 5.38 billion, with an 8.1% CAGR projected through 2030.
Which service category grows fastest through 2030?
Bioanalysis and biomarkers is expected to advance at an 11.8% CAGR as precision-medicine pipelines expand.
What region offers the highest growth rate?
Asia Pacific is forecast to post an 8.3% CAGR thanks to rising biopharma capacity and cost advantages.
Why are humanized models gaining traction?
They provide more clinically relevant pharmacodynamic data, driving a 10.5% CAGR within the animal-model segment.
How are CROs reducing animal usage?
Firms are deploying AI-driven study-design tools and virtual control groups, cutting control-arm animal numbers by up to 25%.
Which players lead the competitive landscape?
Charles River Laboratories, WuXi AppTec, and Eurofins Scientific head the market due to global facility networks and broad service portfolios.
Page last updated on:


