Biopharmaceutical CMO And CRO Market Size and Share
Market Overview
| Study Period | 2020 - 2031 |
|---|---|
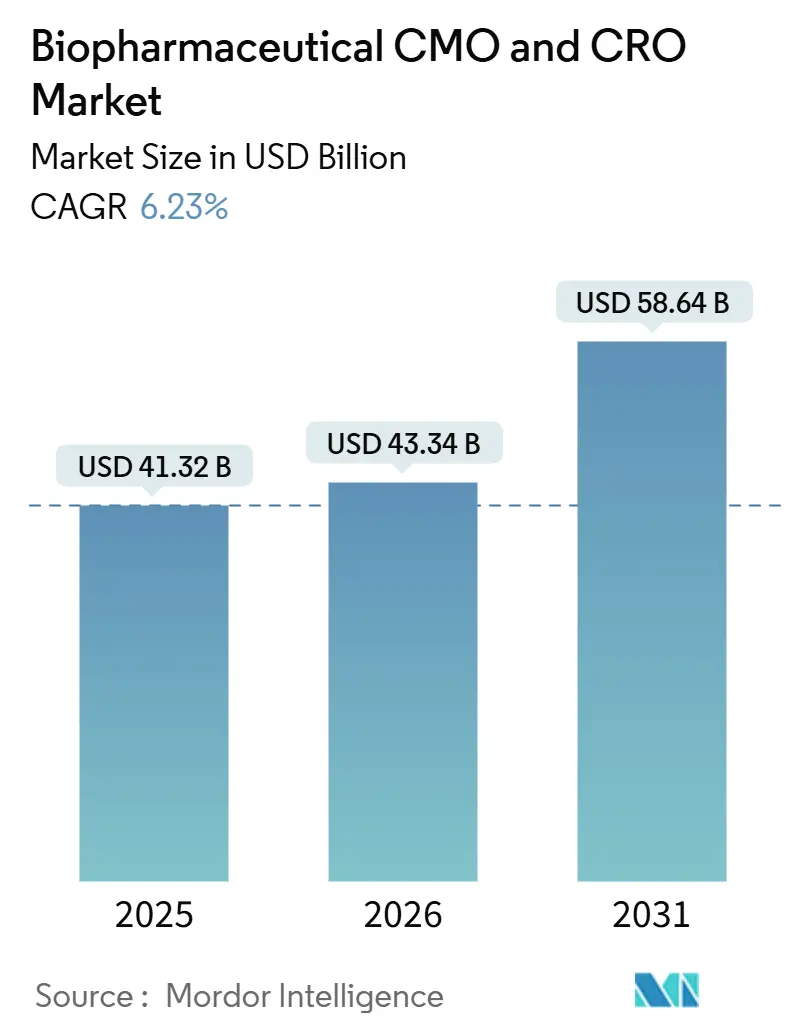
| Market Size (2026) | USD 43.34 Billion |
| Market Size (2031) | USD 58.64 Billion |
| Growth Rate (2026 - 2031) | 6.23% CAGR |
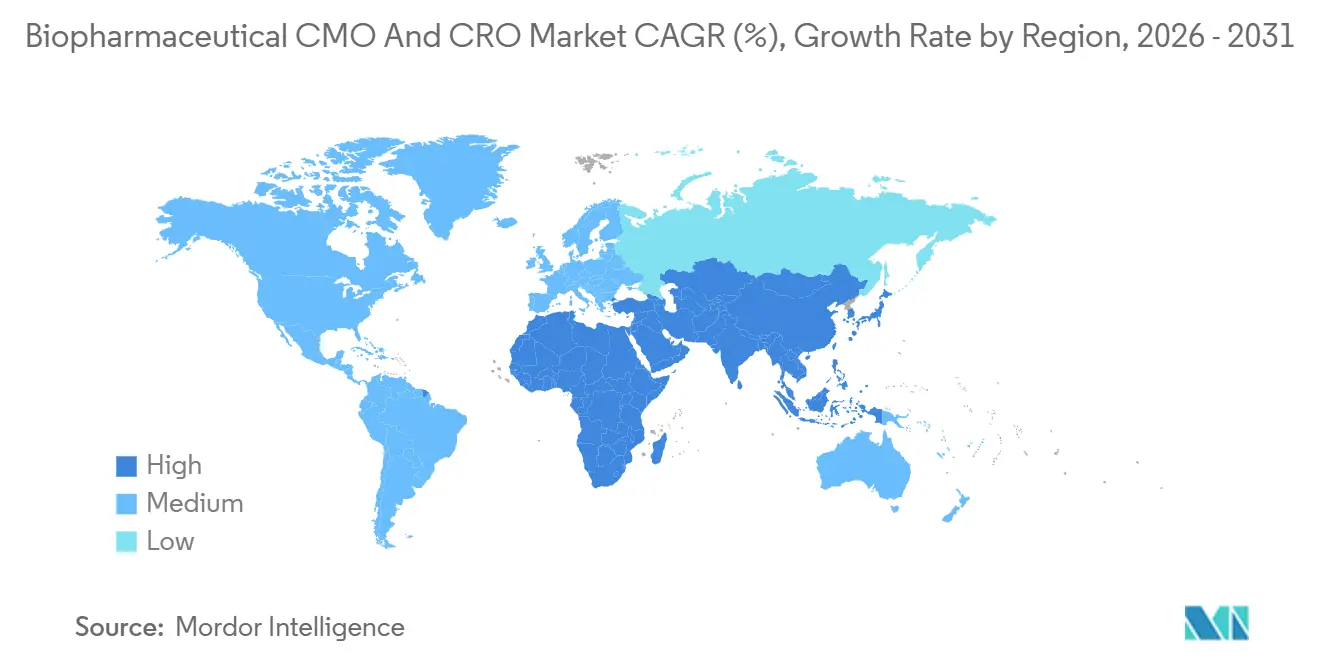
| Fastest Growing Market | Asia Pacific |
| Largest Market | North America |
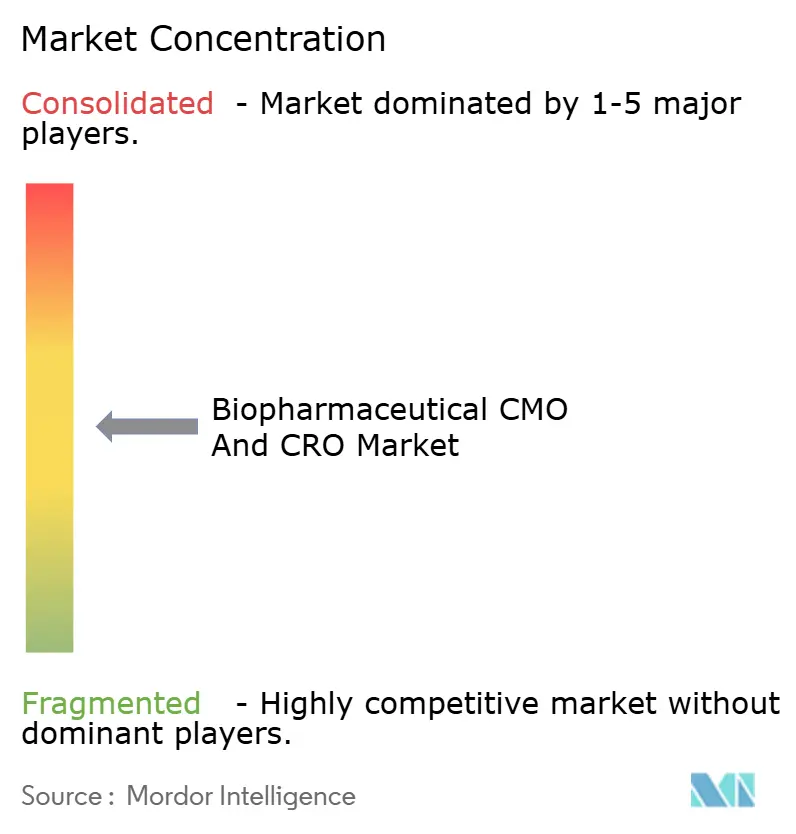
| Market Concentration | Medium |
Major Players *Disclaimer: Major Players sorted in no particular order Image © Mordor Intelligence. Reuse requires attribution under CC BY 4.0. | |
Biopharmaceutical CMO And CRO Market Analysis by Mordor Intelligence
The Biopharmaceutical CMO And CRO Market size is projected to be USD 41.32 billion in 2025, USD 43.34 billion in 2026, and reach USD 58.64 billion by 2031, growing at a CAGR of 6.23% from 2026 to 2031.
Demand is rising as sponsors redeploy capital away from bricks-and-mortar plants toward asset-light development models, lifting outsourcing penetration for APIs to 74% in 2024 and for biologics APIs to 61% despite their structural complexity. Contract manufacturing organisations (CMOs) captured more than half of 2025 service revenue, yet contract research organisations (CROs) are expanding faster because innovators must compress Phase II-III timelines while trial protocols grow ever more intricate. Pipeline mix is also shifting; monoclonal antibodies remain the volume anchor, but cell and gene therapies are moving from academic benches to GMP suites, spurring demand for viral-vector capacity even as mammalian CHO and HEK platforms dominate commercial production.[1]Center for Drug Evaluation and Research, “Biologic License Application and Biosimilar Approvals, 2024-2025,” U.S. Food and Drug Administration, fda.gov Venture-backed “virtual biotechs” raised USD 75 billion in 2024, driving a parallel boom in early-stage outsourcing, while private-equity–fueled consolidation, exemplified by the USD 16.5 billion Catalent deal, pushes the competitive landscape toward fewer but larger full-service providers.
Key Report Takeaways
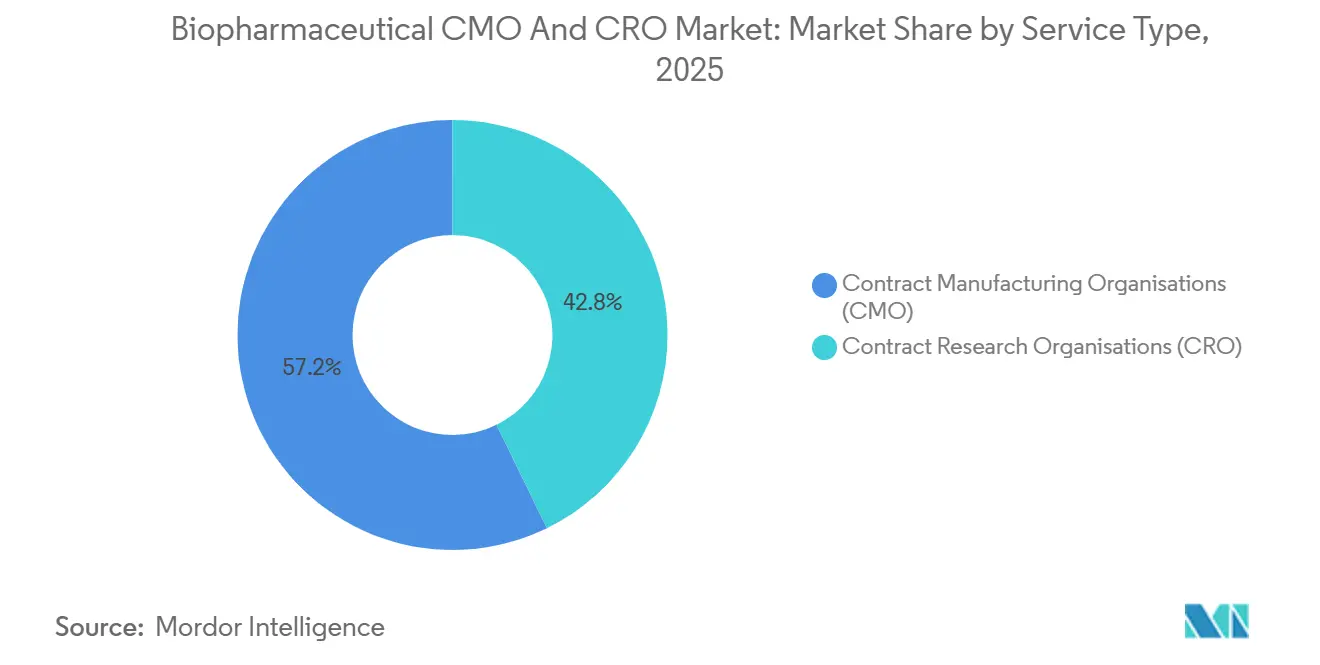
- By service type, CMOs led with 57.24% of 2025 revenue, while CROs posted the fastest 10.42% CAGR through 2031.
- By biologic type, monoclonal antibodies commanded 44.57% share in 2025; cell and gene therapies are expanding at 9.37% CAGR to 2031.
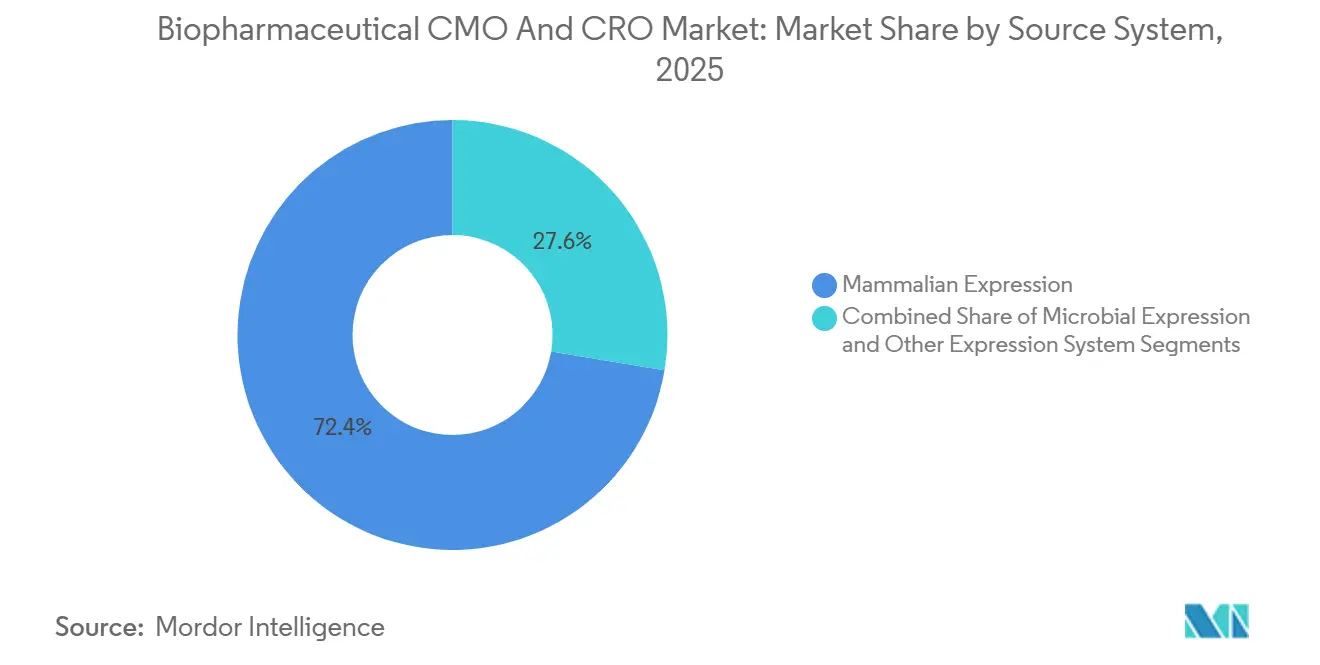
- By source system, mammalian expression held 72.38% of 2025 revenue and will grow at 8.31% CAGR through 2031.
- By scale, commercial operations accounted for 61.39% of 2025 revenue, whereas pre-clinical and clinical services will rise 10.64% annually.
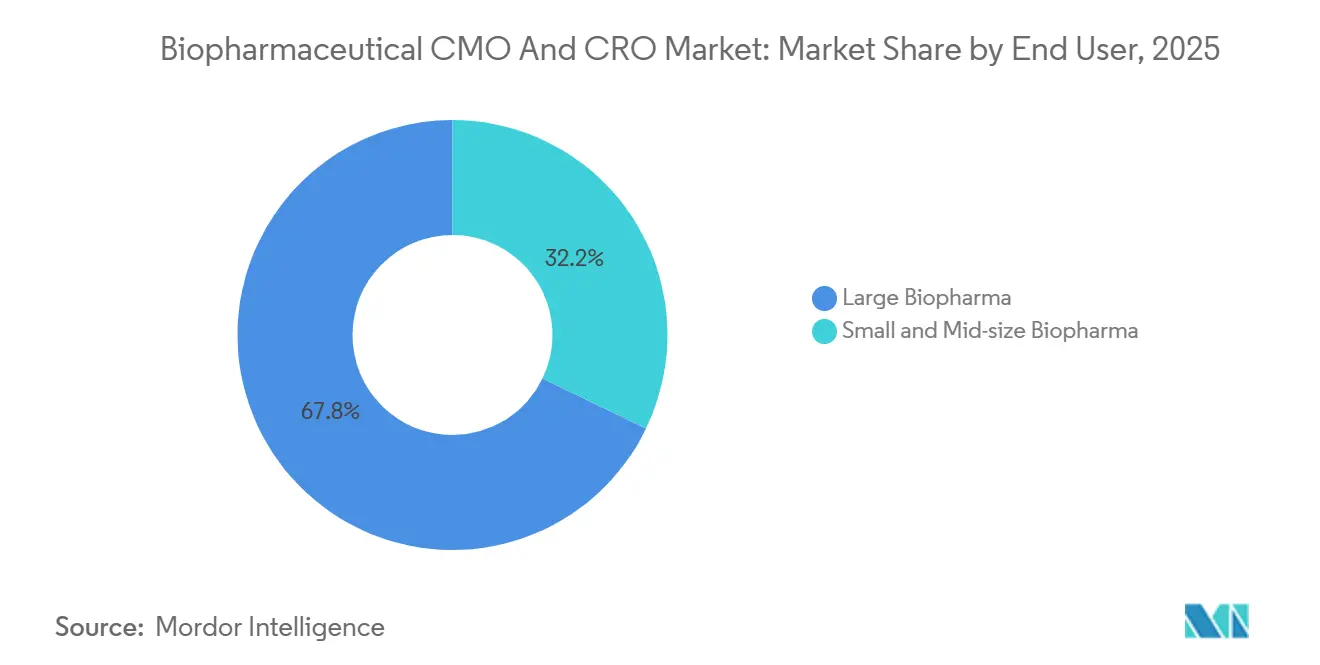
- By end user, large biopharma generated 67.83% of 2025 demand; small and mid-size sponsors accelerate at 10.94% CAGR.
- By geography, North America led with 37.81% of 2025 revenue, but Asia-Pacific records the strongest 8.33% CAGR through 2031.
Note: Market size and forecast figures in this report are generated using Mordor Intelligence’s proprietary estimation framework, updated with the latest available data and insights as of January 2026.
Global Biopharmaceutical CMO And CRO Market Trends and Insights
Drivers Impact Analysis*
| Driver | (~) % Impact on CAGR Forecast | Geographic Relevance | Impact Timeline |
|---|---|---|---|
| Expanding Biologics and Biosimilars Pipeline | 1.2% | Global, with North America and Europe leading approvals; Asia-Pacific gaining share in biosimilar manufacturing | Medium term (2-4 years) |
| Increasing Small-Molecule to Large-Molecule Outsourcing Shift | 1.4% | Global, particularly North America and Europe where innovators concentrate R&D; Asia-Pacific captures cost-sensitive production | Long term (≥ 4 years) |
| Cost & Time Pressures on Late-Stage Clinical Programs | 1.1% | Global, with acute pressure in North America and Europe due to high trial costs; emerging in Asia-Pacific as trial complexity rises | Short term (≤ 2 years) |
| Single-Use Bioprocessing Economics | 0.9% | Global, with fastest adoption in North America and Europe; Asia-Pacific CDMOs retrofitting legacy stainless-steel capacity | Medium term (2-4 years) |
| Demand for Rapid Surge Capacity (Pandemic Readiness) | 0.7% | Global, with government-backed contracts concentrated in North America and Europe; Asia-Pacific building regional hubs | Short term (≤ 2 years) |
| Venture-Backed "Virtual Biotech" Operating Model Growth | 1.0% | North America and Europe where venture capital is concentrated; spillover to Asia-Pacific as funding diversifies | Medium term (2-4 years) |
| Source: Mordor Intelligence | |||
Expanding Biologics And Biosimilars Pipeline
The FDA cleared 59 novel drugs in 2024 and another 18 biosimilars in 2025 under streamlined interchangeability rules, pulling analytical and process-development work toward external partners. Monoclonal-antibody pipelines climbed 18% year-on-year, extending into rare-disease combinations that require co-formulation know-how. Cell and gene therapy programs surpassed 2,000 globally, with roughly 80% already contracting CDMOs for early process optimisation to secure late-stage slots. WHO now lists 34 national authorities at Maturity Level 3 or higher, broadening where pivotal biosimilar studies can run.[2]Dr. Soumya Swaminathan, “Global Benchmarking Tool: List of Maturity-Level-3 National Regulatory Authorities,” World Health Organization, who.int India’s vaccine self-sufficiency hit 99%, and China reached roughly 90%, enabling local CDMOs to compete on both cost and speed for biosimilar tech-transfer projects.[3]Dr. Renu Swarup, “India and China Reach Near Self-Sufficiency in Vaccine Manufacturing,” World Health Organization, who.int
Outsourcing Shift From Small To Large Molecules
Small-molecule API outsourcing hit 87% in 2024, essentially topping out, whereas biologics API outsourcing lagged at 61%, pointing to a structural headroom sponsors are rushing to close. Finished-dose outsourcing reached 61% versus a decade average of 50% as innovators reuse in-house lines for high-margin modalities. Large biopharma pledged USD 370 billion in U.S. plants yet earmarked most of that spend for proprietary drug-substance assets, leaving drug-product and clinical supplies to external partners. Facilities such as Lilly’s USD 3.5 billion Pennsylvania site and Novo Nordisk’s USD 4.1 billion Clayton plant show innovators keeping high-volume commercial assets internal while outsourcing early and niche programs. Single-use technology now allows CDMOs to flip between products within days, making large-molecule contract production economical at sub-large-batch volumes.
Cost & Time Pressure On Late-Stage Trials
Half of global clinical development spend increases as outsourcing approaches 70% penetration. ICON plc reported a USD 15.5 billion backlog with 51% executable inside 12 months, and hit more than 90% of milestones early or on time. Sponsors now pay premiums for predictability because Phase III study timelines exceed 24 months across many indications. IQVIA’s alliance with Duke Clinical Research Institute, formed in 2026, targets obesity and cardiometabolic trials, underscoring CRO expansion into data-rich therapeutic areas. Functional-service outsourcing embeds CRO talent within sponsor teams, accelerating protocol amendments and compressing cycle times.
Single-Use Bioprocessing Economics
Single-use bioreactors topped 70% of CMO installations in 2024 and should hold that level through 2028 due to capex savings that exceed 40% versus stainless steel. Fujifilm Diosynth’s USD 928 million Denmark expansion doubles capacity and layers in fill-finish lines designed for disposable upstream trains. WuXi Biologics' USD 1.4 billion Singapore site completed Asia’s first commercial three-by-5,000 L single-use PPQ run in 2025, validating the scale potential of disposable technology. Modular cleanrooms and pre-validated skids shrink build-outs from 36 months to under 24, vital as expedited approvals advance launch dates by up to 18 months. Life-cycle analyses now show lower total carbon versus steam-cleaned stainless lines once energy and water savings.
Restraints Impact Analysis*
| Restraint | (~) % Impact on CAGR Forecast | Geographic Relevance | Impact Timeline |
|---|---|---|---|
| Capacity Bottlenecks for Viral-Vector Manufacturing | -0.8% | Global, with acute shortages in North America and Europe where CGT pipelines are concentrated; Asia-Pacific building capacity but lagging in GMP certification | Short term (≤ 2 years) |
| Regulatory Harmonisation Gaps Across Regions | -0.6% | Global, with divergence most pronounced between FDA, EMA, and Asia-Pacific agencies; impacts multi-regional launch strategies | Medium term (2-4 years) |
| Rising Energy-Input Costs for Large-Scale Biologics Plants | -0.5% | Europe most exposed due to natural-gas dependence; North America and Asia-Pacific moderating through renewable investments | Medium term (2-4 years) |
| Talent Scarcity in Advanced Therapy Manufacturing | -0.7% | Global, with North America and Europe facing highest wage inflation; Asia-Pacific experiencing rapid demand growth outpacing training programs | Long term (≥ 4 years) |
| Source: Mordor Intelligence | |||
Viral-Vector Capacity Bottlenecks
Lead times run 12-18 months for GMP AAV slots, forcing sponsors to pre-book during Phase I and absorb cancellation penalties if programs falter. EU GMP Annex 1, in force since 2023, mandates isolator-based aseptic processing and real-time particulate tracking, raising capex hurdles. Lotte Biologics’ USD 3.3 billion Songdo antibody-drug conjugate site shows the capital shift, yet vector suites need bespoke air handling and waste neutralisation that cannot be retrofitted easily. More than 2,000 CGT programs were active in 2024, but only a handful of plants can scale autologous CAR-T therapies, creating a structural mismatch. FDA issued 561 Form 483s in 2024 and over 600 in 2025, many tied to aseptic deviations, underscoring quality barriers that slow capacity growth.
Regulatory Harmonisation Gaps
ICH guidelines exist, yet biosimilar bridging study demands diverge, adding 6-12 months to launches. FDA’s 2024 pathway trims trial loads for interchangeables, while EMA still insists on head-to-head immunogenicity work for some classes. Japan’s PMDA requires local pharmacokinetics irrespective of U.S./EU data, and China’s reforms cut IND timelines by up to 70% but leave data-integrity rules opaque. Africa hosts just 34 regulators at WHO Maturity Level 3 or higher, limiting sites for pivotal biosimilar studies. Latin America scores 59% on FIFARMA’s 2025 research-climate index, with trial density below 30 per million residents, far behind South Korea’s 300-plus.
*Our forecasts treat driver/restraint impacts as directional, not additive. The impact forecasts reflect baseline growth, mix effects, and variable interactions.
Segment Analysis
By Service Type: CMOs Hold The Revenue Anchor While CROs Scale Faster
CMOs captured 57.24% of 2025 turnover, underscoring sponsor preference to outsource asset-heavy drug-substance work instead of funding depreciating capacity in-house. The biopharmaceutical CMO and CRO market share advantage nevertheless shifts when growth is considered: CRO revenue is set to climb 10.42% through 2031 as late-phase protocol complexity drives decentralised-trial adoption. Over the same horizon, the biopharmaceutical CMO and CRO market size tied to manufacturing expands steadily but cedes relative growth to data-rich study services. ICON’s USD 15.5 billion backlog, with half deliverable in 12 months, signals stable outsource budgets, while IQVIA’s 2026 collaboration with Boehringer Ingelheim shows CROs moving into real-world evidence and regulatory strategy.
Sponsors still rely on CMOs for capacity insurance: global mammalian-cell capacity is forecast to rise from about 6,750 kL in 2024 to close to 9,000 kL by 2028, and CMO share climbs from 28% to roughly 40%. Single-site giants such as Samsung Biologics’ 784 kL Incheon campus provide both drug-substance and fill-finish, reducing tech-transfer friction. Industry watchers expect CMOs to keep majority revenue, yet CROs will outpace them in percentage terms, driven by AI-enabled patient matching and real-time data capture that trims enrolment timelines by double digits.


By Biologic Type: Monoclonal Antibodies Dominate, But CGTs Lead Growth
Monoclonal antibodies held 44.57% of 2025 revenue as innovators expand into rare diseases and combination regimens needing co-formulation finesse. The segment’s absolute expansion secures the biopharmaceutical CMO and CRO market size floor; however, cell and gene therapies clock the fastest 9.37% CAGR, buoyed by over 2,000 active programs and widespread CDMO engagement during preclinical optimisation. Vaccine volumes normalised post-pandemic, but oligopolistic share keeps margins attractive: the top 10 producers controlled 85% of 2023 value.
Recombinant proteins surge on the back of GLP-1 combinations such as CagriSema, forecast for USD 15 billion sales by 2029, pressuring fill-finish lines tailored to prefilled syringes. Antibody-drug conjugates grow near 20% CAGR, yet capacity shortages endure, prompting Samsung and Lotte to earmark over USD 4 billion for dedicated suites. Sponsors view CGT outsourcing as risk mitigation; lead times, regulatory scrutiny, and bespoke analytics challenge internal build-or-buy economics, handing CDMOs a durable growth lever.
By Source System: Mammalian Platforms Retain The Lion’s Share
Mammalian expression accounted for 72.38% of 2025 revenue and should rise 8.31% annually through 2031 as CHO and HEK cells remain gold standards for glycosylated proteins. The biopharmaceutical CMO and CRO market size tied to mammalian culture is projected to swell alongside capacity build-outs such as Lonza’s six 20,000 L bioreactors that went live at Visp in 2025. Microbial platforms, while holding a smaller slice, remain indispensable for insulin and enzyme biosimilars thanks to faster batch cycles and lower media costs.
Single-use adoption favors mammalian systems: more than 70% of CMO installs in 2024 involved disposable bioreactors, sustaining turnover as tech lowers cleaning downtime. Emerging insect and plant systems stay niche, hindered by scant GMP capacity and unfamiliar regulatory paths.

By Scale Of Operation: Commercial Volumes Lead, Clinical Services Expand Quickly
Commercial manufacturing drove 61.39% of 2025 revenue as blockbuster antibodies and GLP-1 agonists require multi-ton output. Yet pre-clinical and clinical outsourcing is growing faster at 10.64% CAGR to 2031, a pattern evident in Aragen’s Bangalore site aimed at early-stage programs. Sponsors lock slots years ahead to dodge the 12-18-month queue now common for commercial bioreactors, pushing the biopharmaceutical CMO and CRO market share for clinical services higher by decade end.
Samsung Biologics’ Plant 5 added 180,000 L in 2025, elevating single-site capacity leadership while offering cradle-to-commercial continuity. Changeover-light single-use systems dominate clinical supply, letting CMOs pivot between client products in days.
By End User: Large Pharma Anchors Demand While Virtual Biotechs Accelerate
Large biopharma generated 67.83% of 2025 turnover through multi-year supply guarantees that finance CDMO expansions. Conversely, small and mid-size companies will grow 10.94% yearly as venture money fuels pipeline creation without parallel bricks-and-mortar investment. Lonza reports 500-plus clients leveraging its intellectual property, highlighting how CDMOs capture upside beyond fee-for-service.
Virtual biotechs may lack bargaining muscle on price, yet they entice CDMOs with novel modalities, mRNA, base editing, that can yield milestone royalties. Large-pharma onshoring investments largely focus on proprietary drug-substance assets, keeping ancillary services outsourced and sustaining dual-track growth across end-user buckets.
Geography Analysis
North America held 37.81% of 2025 revenue, anchored by the United States’ dense innovator pipelines and rapid IND processing. More than USD 370 billion in announced plant spend underlines the region’s biomanufacturing primacy, from Lilly’s USD 3.5 billion Pennsylvania build to Novo Nordisk’s USD 4.1 billion GLP-1 facility. Samsung Biologics’ USD 280 million acquisition of GSK’s Rockville plant granted 60,000 L of capacity and 500 staff, exemplifying Asian CDMOs entering the U.S. for proximity to clients. Canada and Mexico contribute niche fill-finish and near-shore supply roles under free-trade frameworks.
Europe combines deep biosimilar know-how with mid-tier CDMOs specialising in ADCs and autologous cells. Annex 1 compliance raises cost bars but also forms a quality moat. Investments include Fujifilm Diosynth’s USD 928 million Denmark expansion and BioNTech’s EUR 1.8 billion Mainz mRNA hub. The biopharmaceutical CMO and CRO market size in Europe benefits from balanced demand across incumbent big pharma and specialty biotechs.
Asia-Pacific is the fastest-growing region at 8.33% CAGR through 2031. Samsung Biologics’ 784 kL campus and WuXi Biologics’ USD 1.4 billion Singapore site evidence technical parity with Western peers. China accounts for 40% of global clinical trials, yet data-integrity questions keep some pivotal studies abroad. India’s 99% vaccine self-sufficiency and Aragen’s 2025 Bangalore launch illustrate rising domestic capability. Australia and South Korea round out regional momentum with streamlined early-phase pathways.
Middle East & Africa and South America remain emerging. Africa imports over 70% of its medicines and runs production lines at 30-60% utilisation mainly due to fragmented regulation. Latin America scores 59% on research-climate metrics; Chile and Costa Rica lead but still trail Asian benchmarks by orders of magnitude. Near-term uplift hinges on harmonised regulation and targeted workforce development.

Competitive Landscape
The key CMOs include Lonza, Samsung Biologics, and WuXi Biologics, tightening price leverage . Parallel CRO space is similarly consolidated; IQVIA, ICON, and Thermo Fisher/PPD together near 50% of the USD 60 billion clinical market. Recent megadeals include Novo Holdings’ USD 16.5 billion Catalent acquisition and the USD 7.1 billion Syneos Health take-private, signalling private-equity appetite for integrated drug-substance/drug-product platforms.
Strategic playbooks emphasise vertical integration: CMOs bolt on fill-finish, analytical, and even clinical packaging to become one-stop shops. Geographical hedging is another theme—Asian giants buying Western sites, and Western players adding Singapore or Shanghai footprints to mute geopolitical risk. Technology adoption rounds out strategy; single-use bioreactors already exceed 70% of installs, and continuous processing pilots suggest 30-50% cost-of-goods savings although regulatory comfort remains in flux.
White-space persists. Viral-vector lead-time pain and decentralised-trial demand both welcome specialised entrants. BCG estimates AI-based patient-matching tools could disrupt USD 18 billion of current CRO value pools, and modular cleanroom builders slice facility timelines by roughly one-third, lowering barriers for mid-tier regional CDMOs. Compliance moats grow deeper as Annex 1 mandates continuous environmental monitoring, favouring incumbents with entrenched quality cultures.
Biopharmaceutical CMO And CRO Industry Leaders
Lonza Group AG
Samsung Biologics Co., Ltd.
WuXi Biologics
Catalent Inc.
Thermo Fisher Scientific Inc.
- *Disclaimer: Major Players sorted in no particular order

Recent Industry Developments
- February 2026: VivaMed BioPharma formed a strategic partnership with Syngene International to expand AI-driven drug-repurposing programs.
- January 2026: CHA Biotech’s Matica BioLabs signed a CMO agreement with Ingenium Therapeutics focused on NK-cell–based regenerative therapies.
- September 2026: Avance Clinical acquired oncology-specialist CRO LumaBridge, widening its U.S. footprint and therapeutic depth.


Global Biopharmaceutical CMO And CRO Market Report Scope
As per the scope of the report, Biopharmaceutical Contract Research Organizations (CROs) manage preclinical research, clinical trials, and regulatory submissions, while Contract Manufacturing Organizations (CMOs) handle drug production, scaling, and packaging with GMP compliance. These entities enable outsourcing of drug development and manufacturing.
The Biopharmaceutical CMO and CRO Market Report is segmented by Service Type, Biologic Type, Source System, Scale of Operation, End User, and Geography. By Service Type, the market is segmented into Contract Manufacturing Organisations and Contract Research Organisations. By Biologic Type, the market is segmented into Monoclonal Antibodies, Vaccines, Cell & Gene Therapies, Recombinant Proteins, and Others. By Source System, the market is segmented into Mammalian Expression, Microbial Expression, and Other Expression Systems. By Scale of Operation, the market is segmented into Pre‑clinical & Clinical and Commercial. By End User, the market is segmented into Small & Mid‑size Biopharma and Large Biopharma. By Geography, the market is segmented into North America, Europe, Asia‑Pacific, Middle East & Africa, and South America.The report also covers the estimated market sizes and trends for 17 countries across major global regions. The report offers the value (in USD) for the above segments.
| Contract Manufacturing Organisations (CMO) |
| Contract Research Organisations (CRO) |
| Monoclonal Antibodies |
| Vaccines |
| Cell & Gene Therapies |
| Recombinant Proteins |
| Others |
| Mammalian Expression |
| Microbial Expression |
| Other Expression Systems |
| Pre-clinical & Clinical |
| Commercial |
| Small & Mid-size Biopharma |
| Large Biopharma |
| North America | United States |
| Canada | |
| Mexico | |
| Europe | Germany |
| France | |
| United Kingdom | |
| Italy | |
| Spain | |
| Rest of Europe | |
| Asia-Pacific | China |
| Japan | |
| India | |
| South Korea | |
| Australia | |
| Rest of Asia-Pacific | |
| Middle East & Africa | GCC |
| South Africa | |
| Rest of Middle East & Africa | |
| South America | Brazil |
| Argentina | |
| Rest of South America |
| By Service Type | Contract Manufacturing Organisations (CMO) | |
| Contract Research Organisations (CRO) | ||
| By Biologic Type | Monoclonal Antibodies | |
| Vaccines | ||
| Cell & Gene Therapies | ||
| Recombinant Proteins | ||
| Others | ||
| By Source System | Mammalian Expression | |
| Microbial Expression | ||
| Other Expression Systems | ||
| By Scale of Operation | Pre-clinical & Clinical | |
| Commercial | ||
| By End User | Small & Mid-size Biopharma | |
| Large Biopharma | ||
| By Geography | North America | United States |
| Canada | ||
| Mexico | ||
| Europe | Germany | |
| France | ||
| United Kingdom | ||
| Italy | ||
| Spain | ||
| Rest of Europe | ||
| Asia-Pacific | China | |
| Japan | ||
| India | ||
| South Korea | ||
| Australia | ||
| Rest of Asia-Pacific | ||
| Middle East & Africa | GCC | |
| South Africa | ||
| Rest of Middle East & Africa | ||
| South America | Brazil | |
| Argentina | ||
| Rest of South America | ||


Key Questions Answered in the Report
What will be the size of the global biopharmaceutical CMO and CRO market in 2031?
By 2031, the global biopharmaceutical CMO and CRO market is projected to hit USD 58.64 billion, growing at a rate of 6.23% from 2026 to 2031.
Which service segment is growing fastest?
CRO services grow at 10.42% a year as sponsors outsource complex late-phase trials.
Why are cell and gene therapies important for manufacturers?
They post the highest 9.37% CAGR and require specialised viral-vector capacity that most sponsors lack in-house.
Which region will expand most quickly through 2031?
Asia-Pacific leads regional growth at an 8.33% CAGR as new capacity and regulatory maturity converge.
Page last updated on:


