Market Overview
| Study Period | 2020 - 2031 |
|---|---|
| Market Size (2026) | USD 7.6 Billion |
| Market Size (2031) | USD 11.09 Billion |
| Growth Rate (2026 - 2031) | 7.85% CAGR |
| Fastest Growing Market | Asia Pacific |
| Largest Market | North America |
| Market Concentration | Medium |
Major Players *Disclaimer: Major Players sorted in no particular order Image © Mordor Intelligence. Reuse requires attribution under CC BY 4.0. | |
Commercial Aircraft In-Flight Entertainment And Connectivity System Market Analysis by Mordor Intelligence
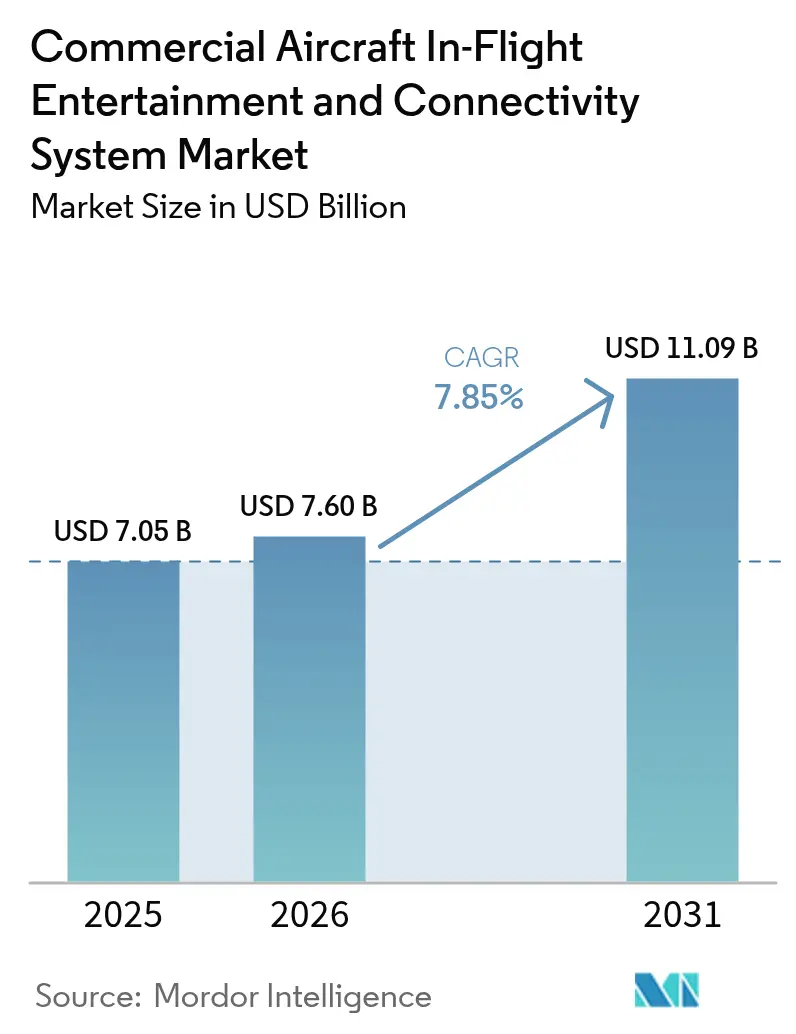
The commercial aircraft in-flight entertainment and connectivity (IFEC) system market size was valued at USD 7.05 billion in 2025 and estimated to grow from USD 7.6 billion in 2026 to reach USD 11.09 billion by 2031, at a CAGR of 7.85% during the forecast period (2026-2031). Demand escalates as airlines shift their competitive focus from fares to differentiated onboard experiences that boost Net Promoter Scores and repeat-booking rates. Lower connectivity costs from low-earth orbit (LEO) constellations, large Asia-Pacific fleet renewal programs, and growing recognition of IFE-driven ancillary revenue are the structural tailwinds behind this momentum. Seat-back systems still anchor most widebody cabins, yet bandwidth-rich Wi-Fi and streaming servers are winning incremental linefit orders as operators weigh the total cost of ownership against passenger tech expectations. Vendors able to pair modular hardware with cloud-native software are best positioned, as airlines increasingly insist on faster upgrade cycles and data monetization features that mirror those of ground-based e-commerce.
Key Report Takeaways
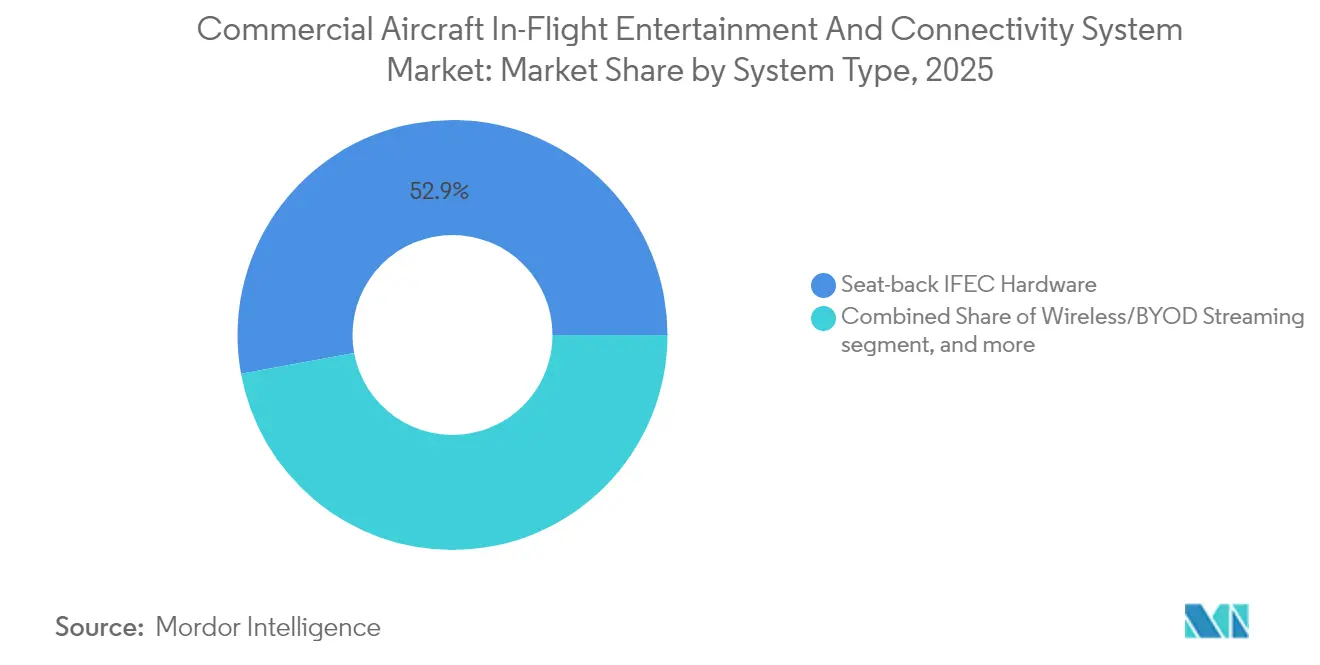
- By system type, seat-back hardware led the commercial aircraft IFEC market with a 52.88% share in 2025; cabin connectivity system is expected to pace the field at a 10.41% CAGR through 2031.
- By aircraft type, narrowbody installations accounted for 49.35% of the commercial aircraft IFEC market size in 2025, while regional-jet deployments are expanding at an 10.92% CAGR.
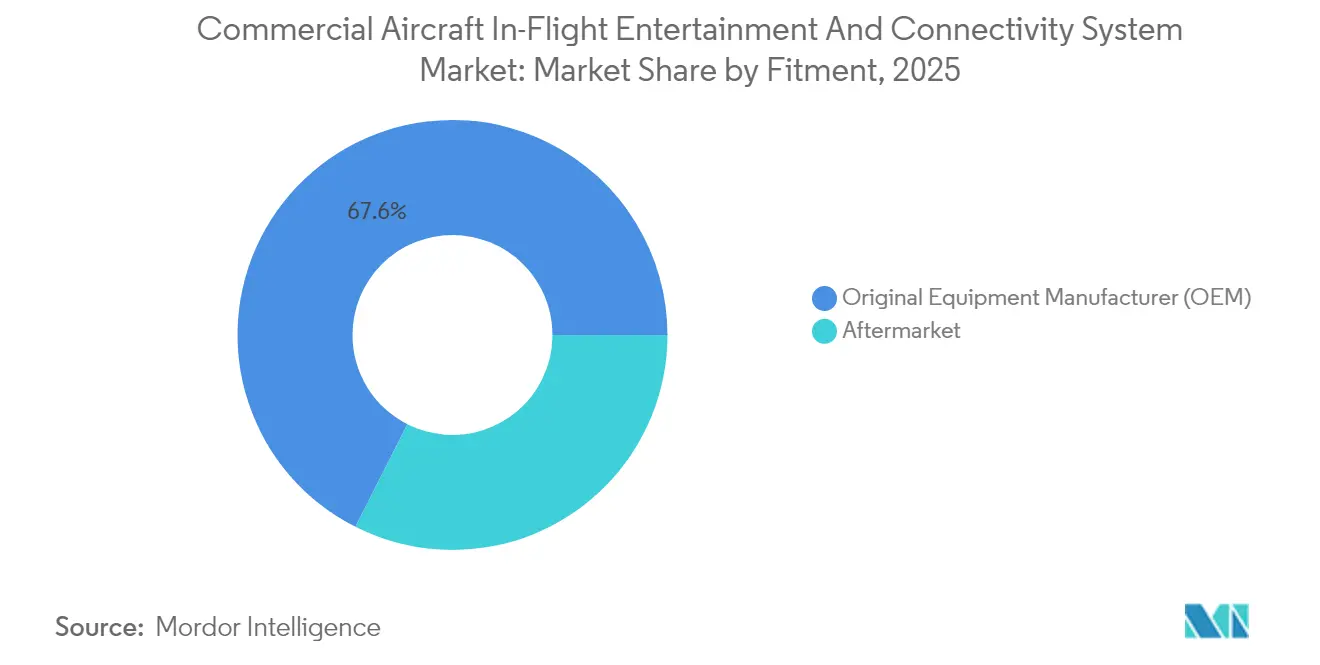
- By fit type, linefit retained 67.55% of the commercial aircraft IFEC market share in 2025, whereas retrofit activity is accelerating at a 9.02% CAGR.
- By cabin class, Economy class commanded 70.62% of cabin installations in 2025, whereas Premium Economy class is expanding at a 12.05% CAGR.
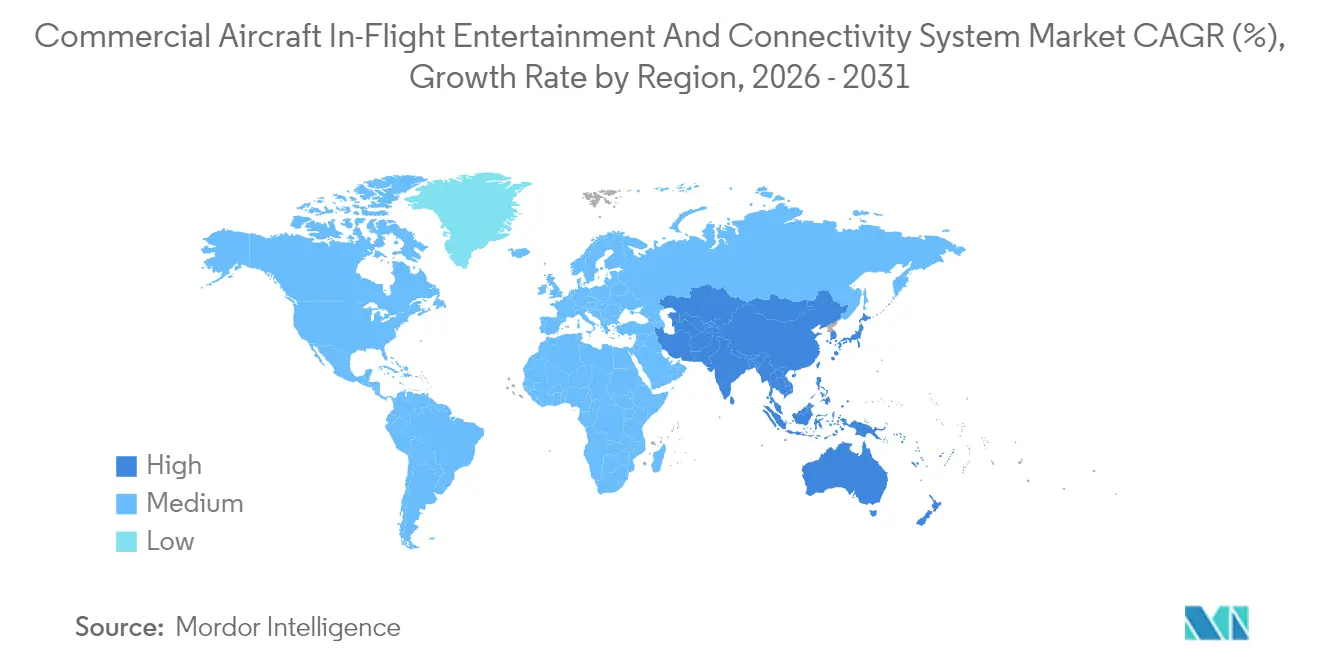
- By geography, North America held 30.88% of the commercial aircraft IFEC market in 2025; the Asia-Pacific region is set to outpace all other regions at a 10.34% CAGR.
Note: Market size and forecast figures in this report are generated using Mordor Intelligence’s proprietary estimation framework, updated with the latest available data and insights as of 2026.
Global Commercial Aircraft In-Flight Entertainment And Connectivity System Market Trends and Insights
Driver Impact Analysis*
| Driver | (%) Impact on CAGR Forecast | Geographic Relevance | Impact Timeline |
|---|---|---|---|
| Passenger-experience driven cabin differentiation | 2.10% | Global with premium focus in North America and Europe | Medium term (2-4 years) |
| Asia-Pacific fleet and passenger boom | 1.80% | Asia-Pacific core, spill-over to Middle East | Long term (≥ 4 years) |
| High-speed satcom enabling streaming-grade bandwidth | 1.50% | Global, led by North America and Europe | Medium term (2-4 years) |
| Bring Your Own Device (BYOD) retrofit cost advantage | 1.20% | Global, concentrated in Asia-Pacific and Europe LCCs | Short term (≤ 2 years) |
| Low Earth Orbit (LEO) satellite bandwidth cost collapse | 1.00% | Global | Long term (≥ 4 years) |
| IFE-enabled onboard e-commerce revenue | 0.70% | North America and Europe premium routes | Medium term (2-4 years) |
| Source: Mordor Intelligence | |||


Passenger-Experience Driven Cabin Differentiation
Commercial scheduled airlines now treat IFEC as a primary branding lever rather than a discretionary amenity. Flag carriers are specifying 4K OLED panels, spatial audio, and Bluetooth pairing that replicate living-room entertainment quality. Panasonic’s Astrova platform, already in use on Icelandair’s A321neo LR fleet, exemplifies this shift with HDR10+ displays and fast-charge USB-C outlets that reduce maintenance downtimes by 20% thanks to its modular components.[1]Panasonic Avionics, “Astrova – Elevating the In-Flight Experience,” Premium roll-outs, such as Swiss International Air Lines’ “SWISS Senses” A350 program, integrate lighting, climate, and seat controls through a single interface, transforming the screen into a comprehensive cabin-management node. Carriers see measurable payoffs: internal surveys at Cathay Pacific revealed a higher willingness to pay for short-haul upgrades after 4K screens debuted on A321neo aircraft.[2]Cathay Pacific Airways, “Cathay Pacific Elevates Short-Haul Experience with 4K IFE,” Competitive pressure ensures these enhancements cascade quickly into narrowbody fleets, making high-definition (HD) seat-back experiences the new baseline even on flights under four hours.
Asia-Pacific Fleet and Passenger Boom
Revenue passenger kilometers across Asia-Pacific rebounded to 87.30% of pre-2020 levels by April 2024, and regional airlines are linking IFE fitment to brand ascension as they add narrowbody aircraft at a record pace. Fleet pipelines in China, India, and Vietnam collectively exceed 2,500 new single-aisle aircraft scheduled for delivery before 2030, almost all of which are specified with linefit wireless streaming servers or hybrid seat-back systems. Low-cost carriers (LCCs), such as Vietjet Thailand, have adopted Bluebox Aviation’s cloud-managed portal to unlock advertising and retail margins without a heavy capital outlay, proving that sophisticated digital cabins are no longer confined to full-service airlines.[3]Bluebox Aviation Systems, “Blueview Chosen by Vietjet Thailand,” blueboxaviation.com Tight slot availability at hub airports further prompts airlines to focus on yield rather than sheer volume, and cabin technology that converts dwell time into revenue-generating screen time has become a persuasive differentiator.
High-Speed Satcom Enabling Streaming-Grade Bandwidth
The rapid roll-out of high-throughput Ka-band and Ku-band payloads transforms aircraft cabins into true broadband spaces. DIRECTV IN FLIGHT’s IPTV feed now delivers live international sports over satellite to both seat-back monitors and personal devices, a capability unthinkable under the previous generation of Ku-band services. Wider pipes also enable airlines to push real-time content updates, eliminating the logistical challenge of manual media swaps. The same connectivity backhaul supports crew productivity apps and predictive maintenance data, strengthening the business case beyond passenger leisure. Carriers that install scalable antennas early gain a future-proof path to monetize bandwidth through tiered packages, loyalty integration, and ad-supported models. Nonetheless, power-draw approval and electromagnetic-compatibility testing still add six to nine months to most programs, tempering immediate adoption rates.
BYOD Retrofit Cost Advantage
Bring-your-own-device (BYOD) streaming reduces both capital costs and fuel consumption. Eliminating 13-lb seat-back screens across a 180-seat narrowbody aircraft removes roughly one ton of weight, trimming annual fuel expense by around USD 50,000 at today’s jet-A pricing. TUI Airlines’ decision to deploy Immfly’s antenna-agnostic platform across the B737-8 aircraft shows how retrofit-light solutions can modernize cabins in weeks rather than months. Software-defined portals permit content refreshes overnight and make future connectivity swaps, such as migrating from geostationary equatorial orbit (GEO) to LEO links, painless. Passenger acceptance remains contingent on fast charging and reliable streaming, compelling operators to invest in next-gen Wi-Fi 6 access points and high-density antenna arrays. Once connectivity performance matches expectations, the BYOD model offers a direct path to lower total cost of ownership while preserving upsell opportunities through targeted digital storefronts.
LEO Satellite Bandwidth Cost Collapse
Telesat’s buyer guide indicated that bandwidth prices are falling by 30–40% compared with legacy geostationary links, while latency improves fivefold. A cheaper gigabit service enables airlines to market free basic Wi-Fi as a loyalty perk without sacrificing their margins. Abundant capacity also supports crew applications, such as predictive maintenance and electronic flight bag updates. Greater redundancy and gate-to-gate coverage reduce service outages that previously frustrated passengers. Cost curves are expected to decline further as more satellites launch, embedding long-term savings in carrier financial models.
IFEC-Enabled Onboard E-Commerce Revenue
TUI integrated the Musement marketplace into its Immfly portal, letting flyers book excursions before landing and generating commission income throughout the journey. British Airways is adopting the Amadeus Nevio suite to deliver dynamic offers that combine seat upgrades, meals, and destination services in a single transaction. Transaction conversion rates on captive cabin screens exceed those of traditional retail catalogs, resulting in increased revenue per passenger. Rich data captured in flight feeds post-trip marketing and loyalty analytics. Strong ancillary performance helps justify further investment in bandwidth and user-interface upgrades.
Restraints Impact Analysis*
| Restraint | (%) Impact on CAGR Forecast | Geographic Relevance | Impact Timeline |
|---|---|---|---|
| Capex and weight penalty of seat-back systems | -1.50% | Global, acute for LCCs and regional operators | Medium term (2-4 years) |
| Certification hurdles for EMI/EMC | -0.80% | Global, with stricter EU and US rules | Long term (≥ 4 years) |
| Cross-border content licensing complexity | -0.60% | Global, chiefly on international routes | Short term (≤ 2 years) |
| Cyber-security risks in open Wi-Fi architectures | -0.40% | Global, heightened in security-sensitive regions | Medium term (2-4 years) |
| Source: Mordor Intelligence | |||
CAPEX and Weight Penalty of Seat-Back Systems
At an installed price of up to USD 10,000 per seat, traditional hard-wired screens pose capital hurdles that many LCCs view as prohibitive. Weight penalties add a fuel-burn surcharge that compounds over the aircraft life cycle, eroding margins on routes where yields already hover near break-even. Collins Aerospace now markets a three-tier Pinnacle cabin upgrade kit that reuses existing seat structures, reducing retrofit costs by approximately 40% while still delivering touchscreen capability and fast-charging ports. Operators choosing to remove legacy IFEC completely in favor of streaming portals must still manage passenger perceptions on long-haul flights, where large displays remain closely tied to comfort metrics. The resulting trade-off forces airline planners to model revenue uplift, fuel savings, and customer-loyalty impacts in an integrated financial framework before approving significant cabin investments.
Certification Hurdles for EMI/EMC
New antennas, servers, and displays must pass rigorous electromagnetic interference and compatibility tests to ensure they don't disrupt commercial aircraft avionics. Protocols set by the Federal Aviation Administration (FAA) and the European Union Aviation Safety Agency (EASA) can lengthen development cycles by 12 to 18 months, often necessitating multiple tests across various aircraft types. Universal Avionics recently secured approval for a Wi-Fi-enabled flight-management system, highlighting the challenges even established avionics suppliers face. Many smaller in-flight entertainment (IFE) start-ups lack dedicated regulatory teams, relying instead on approvals from larger integrators. This dependency diminishes their speed-to-market advantage. For airlines, these certification delays can result in reduced seat capacity. Aircraft awaiting cabin modifications remain grounded until they achieve compliance, resulting in significant hidden opportunity costs for the IFEC businesses.
Cross-Border Content-Licensing Complexity
Copyright holders segment catalogs by territory, forcing airlines on multi-leg routes to negotiate separate licenses or geo-lock libraries. This drives up administrative costs and can leave passengers with limited selections on specific sectors, eroding user satisfaction. Airlines must strike a balance between cultural relevance and legal compliance, particularly when catering to Hollywood and sports channels. Content gaps challenge carriers promoting continuous binge-watching experiences. Complexity increases as streaming rights become fragmented across multiple platforms, resulting in higher negotiation overhead.
Cyber-Security Risks in Open Wi-Fi Architectures
Expanded bandwidth and BYOD adoption expose aircraft networks to new threat vectors. Pen-testing reveals that improperly segmented cabin networks can provide pathways to operational domains if misconfigured. Regulatory bodies now require robust encryption, intrusion-detection systems, and periodic vulnerability assessments, which add to ongoing costs. Cyber breaches can cause reputational damage and lead to potential liability under data protection laws. Airlines must invest in firewalls, patch management, and crew training to safeguard passenger data and maintain certification approvals.
*Our forecasts treat driver/restraint impacts as directional, not additive. The impact forecasts reflect baseline growth, mix effects, and variable interactions.
Segment Analysis
By System Type: Hardware Dominance Faces Connectivity Challenge
Seat-back devices captured 52.88% of the commercial aircraft in-flight entertainment and connectivity system market share in 2025, a testament to their proven reliability and consistent user experience across passenger demographics. Yet, cabin connectivity servers are accelerating at a 10.41% CAGR as airlines chase the flexibility of software-driven upgrades and the monetization opportunities of high-bandwidth retail channels. The commercial aircraft IFEC system market size for wireless streaming hardware is expected to expand sharply once LEO capacity becomes ubiquitous on narrow-body routes. Airlines that maintain seat-back screens often specify modular designs, such as those from Panasonic Astrova, so that future component swaps can avoid full recertification costs, underscoring the new emphasis on lifecycle agility.
Over the medium term, hybrid layouts that mix lightweight tablets in economy with HD seat-backs in premium cabins are expected to proliferate. In-seat power demand is also rising; Astronics’ UltraLite Gen 2 delivers 800 W in half the former footprint, demonstrating that ancillary hardware growth closely mirrors the surge in personal device usage. Vendors that deliver software-defined content management across both screen types stand to gain share, because airlines want unified analytics and targeted-advertising engines. These non-siloed platforms drive integration spending.


By Aircraft Type: Narrowbody Leadership Challenged by Regional Growth
Narrowbody jets accounted for 49.35% of commercial aircraft IFEC system market installations in 2025. They remain the workhorses of global point-to-point networks and benefit from more linefit slots at OEM assembly lines. The aircraft IFE market size within regional jet fleets is projected to grow the fastest, posting an 10.92% CAGR, as LCCs expand their services into secondary cities, where brand loyalty is increasingly tied to digital touchpoints rather than lounge access or meal service. Widebody operators continue to view full-feature seat-back packages as essential on flights exceeding six hours. Yet, they too are layering in personal-device streaming to cater to multi-screen behaviors.
Regionals create design opportunities for low-weight, low-capex streaming racks that can be installed overnight without re-routing aircraft. Vietjet’s adoption of Bluebox’s Blueview portal on A320-family frames illustrates how regional carriers can deploy ad-supported models to offset connectivity costs while elevating brand perception. Conversely, the A321neo and B737-9 MAX set new IFE expectations in narrowbody programs by introducing 4K displays and Bluetooth pairing, which were once exclusive to twin-aisle jets, thereby compressing the technology gap between aircraft classes.
By Fit Type: OEM Linefit Advantage Erodes as Aftermarket Retrofit Accelerates
OEM fitment maintained a 67.55% share in 2025, as OEM-embedded wiring harnesses and structural provisions simplify certification and reduce overall installation costs. Even so, aftermarket programs are projected to trend at a 9.02% CAGR through 2031 as carriers defer new-build orders, extend aircraft life by 5–7 years, and incorporate modern digital features during heavy checks. Airlines such as Icelandair demonstrate how mid-life narrowbody fleets can adopt Astrova seat-backs with minimal cabin downtime, while unlocking new advertising inventory immediately. The commercial aircraft IFEC market size associated with retrofit hardware is thus closely tied to global maintenance, repair, and overhaul (MRO) schedules, which tend to cluster during low-season months.
MRO providers now bundle Wi-Fi access-point upgrades, USB-C outlets, and server refreshes into a single work package, reducing aircraft-on-ground days by 15–20%. That efficiency and the possibility of vendor revenue-share financing make retrofit a strategic lever for network carriers, balancing fleet expansion against balance-sheet constraints. Still, the certification cost of structural seat-back additions means pure streaming retrofits remain the go-to path for LCCs seeking the fastest payback.
By Cabin Class: Premium Economy Drives Innovation
Economy class commanded 70.62% of cabin installations in 2025, whereas premium economy class is expanding at a 12.05% CAGR, as airlines broaden this mid-tier product to capture incremental yield. Upgraded IFE, featuring 15.6-inch 4K displays, Bluetooth audio, and curated premium content, helps justify fare differentials without the full costs of business-class service. Economy remains dominant by seat count, but revenue per square foot in premium economy is rising faster, incentivizing airlines to invest in visible technology differentiators.
Business and first-class cabins continue to pilot new features, such as OLED panels and predictive personalization AI, yet their share of aggregate seats remains limited. Consequently, the commercial aircraft in-flight entertainment market will see the most pronounced infusion of technology in premium economy, where cost-return ratios are most favorable.
Geography Analysis
North America led the commercial aircraft IFEC system market with a 30.88% share in 2025, buoyed by digitally mature consumer bases and aggressive airline connectivity roll-outs. United Airlines and Hawaiian Airlines are pioneering gate-to-gate Starlink service, which offers streaming-grade speeds, creating pressure for incumbents to match or exceed these experience benchmarks. Delta’s free high-speed Wi-Fi, sponsored by T-Mobile, already covers transatlantic sectors, underscoring how connectivity has become integral to frequent flyer engagement strategies. The regulatory ecosystem is supportive, yet market growth is modest. Most mainline fleets are already equipped, so incremental demand centers on upgrades and software-rich monetization layers rather than greenfield installs.
The Asia-Pacific region is projected to register a 10.34% CAGR, the fastest growth rate worldwide. Fleet counts in China, India, Indonesia, and Vietnam continue to surge, and passenger segments in these markets skew younger and more digitally native. Airlines, therefore, perceive IFE not just as a comfort feature but also as a channel to extend mobile app ecosystems into the cabin. Bluebox Aviation’s portal on Vietjet showcases the appeal of ad-financed models, which keep fares low while boosting ancillary revenue per passenger. Likewise, Cathay Pacific’s decision to embed 4K screens in A321neo cabins signals that even short-haul operations in the region must match widebody entertainment standards to defend yield against growing LCC competition. Europe sits in a middle ground, with legacy carriers deploying premium seat-back solutions to maintain service differentials and climate objectives, prompting a pivot to lighter screens or BYOD where feasible. Swiss International Air Lines’ A350 program, featuring the latest seat-back suites aligned with its SWISS Senses brand, underpins the narrative that European flyers remain willing to pay for a superior onboard experience. Meanwhile, TUI’s adoption of Immfly streaming on B737s shows how charter and leisure operators leverage digital storefronts to sell destination activities during the flight, integrating IFE strategy with tour-operator business lines. In the Middle East and Africa, hub-based airlines like Saudia are upgrading widebody cabins with next-gen systems to capture connecting traffic. Still, overall market penetration remains lower, leaving substantial upside for vendors willing to localize content catalogs and conform to regional cultural guidelines.

Competitive Landscape
Innovation and Customer Relations Drive Success
Success in the market increasingly depends on developing lightweight, power-efficient systems that help airlines reduce operational costs while enhancing passenger experience. Incumbent IFEC system companies are focusing on expanding their product portfolios to include solutions for different aircraft types and cabin classes while investing in after-sales support and maintenance networks. Providing integrated solutions that combine hardware, content management, and connectivity services is becoming increasingly crucial for maintaining competitive advantage. Companies are also emphasizing the development of customizable solutions that can be adapted to different airline business models and route structures.
For contenders looking to gain market share, focusing on specific market segments or regional opportunities while developing innovative solutions for emerging needs presents a viable strategy. The increasing importance of content management and connectivity solutions offers opportunities for technology-focused companies to enter the market through partnerships or specialized offerings. Success factors also include navigating regulatory requirements across different regions and developing strong relationships with aircraft manufacturers and airlines. The market's future will be shaped by the growing emphasis on personalizing the passenger experience and integrating entertainment systems with other cabin technologies, requiring companies to maintain strong innovation capabilities and adaptable business models. Additionally, IFE and connectivity are becoming increasingly crucial as airlines seek to enhance the passenger experience.
Commercial Aircraft In-Flight Entertainment And Connectivity System Industry Leaders
RTX Corporation
Burrana Pty Ltd.
Safran SA
Thales Group
Panasonic Holdings Corporation
- *Disclaimer: Major Players sorted in no particular order

Recent Industry Developments
- September 2025: In a move set to redefine in-flight audio standards, Linstol teamed up with Meridian Audio to unveil an exclusive headset. The Meridian headset is specifically designed for cabin use and features a custom design optimized for in-flight conditions. Meticulously fine-tuned, it promises unparalleled clarity, depth, and detail, regardless of altitude.
- September 2025: DIRECTV IN FLIGHT, a US-based provider, initiated offering live programming on international flights. This new service boasts many popular channels, ensuring passengers can relish the same top-notch entertainment they enjoy at home, even while soaring through the skies.
- July 2025: Vietjet Thailand introduced the IFE service driven by the Blueview digital platform and showcased through the acclaimed Bluebox Wow system. The system debuted on the airline's fleet of 18 Airbus narrowbody aircraft and is also set to be installed on its upcoming fleet of B737 MAX aircraft.


Global Commercial Aircraft In-Flight Entertainment And Connectivity System Market Report Scope
Narrowbody, Widebody are covered as segments by Aircraft Type. Asia-Pacific, Europe, Middle East, North America are covered as segments by Region.
By System Type
| Seat-back IFEC |
| Wireless and BYOD IFE |
| In-seat Power and Peripherals |
By Aircraft Type
| Narrowbody Aircraft |
| Widebody Aircraft |
| Regional Jets |
By Fit Type
| Original Equipment Manufacturer (OEM) |
| Aftermarket |
By Cabin Class
| First Class |
| Business Class |
| Premium Economy Class |
| Economy Class |
By Geography
| North America | United States | |
| Canada | ||
| Mexico | ||
| Europe | United Kingdom | |
| France | ||
| Germany | ||
| Spain | ||
| Italy | ||
| Russia | ||
| Rest of Europe | ||
| Asia-Pacific | China | |
| India | ||
| Japan | ||
| South Korea | ||
| Indonesia | ||
| Singapore | ||
| Rest of Asia-Pacific | ||
| South America | Brazil | |
| Argentina | ||
| Chile | ||
| Rest of South America | ||
| Middle East and Africa | Middle East | United Arab Emirates |
| Saudi Arabia | ||
| Turkey | ||
| Qatar | ||
| Rest of Middle East | ||
| Africa | South Africa | |
| Nigeria | ||
| Kenya | ||
| Rest of Africa | ||
| By System Type | Seat-back IFEC | ||
| Wireless and BYOD IFE | |||
| In-seat Power and Peripherals | |||
| By Aircraft Type | Narrowbody Aircraft | ||
| Widebody Aircraft | |||
| Regional Jets | |||
| By Fit Type | Original Equipment Manufacturer (OEM) | ||
| Aftermarket | |||
| By Cabin Class | First Class | ||
| Business Class | |||
| Premium Economy Class | |||
| Economy Class | |||
| By Geography | North America | United States | |
| Canada | |||
| Mexico | |||
| Europe | United Kingdom | ||
| France | |||
| Germany | |||
| Spain | |||
| Italy | |||
| Russia | |||
| Rest of Europe | |||
| Asia-Pacific | China | ||
| India | |||
| Japan | |||
| South Korea | |||
| Indonesia | |||
| Singapore | |||
| Rest of Asia-Pacific | |||
| South America | Brazil | ||
| Argentina | |||
| Chile | |||
| Rest of South America | |||
| Middle East and Africa | Middle East | United Arab Emirates | |
| Saudi Arabia | |||
| Turkey | |||
| Qatar | |||
| Rest of Middle East | |||
| Africa | South Africa | ||
| Nigeria | |||
| Kenya | |||
| Rest of Africa | |||


Market Definition
- Product Type - Entertainment provided to aircraft passengers during a flight refers to In-flight entertainment. The seatback screens which are used to provide entertainment are included under the IFE system product type.
- Aircraft Type - All the passenger aircraft such as narrowbody and widebody which are single-aisle and twin-aisle are included in this study.
- Cabin Class - Business and First Class, economy and premium economy are classes of air travel provided by the airlines that offer various services to the passengers.
| Keyword | Definition |
|---|---|
| Gross domestic product (GDP) | Gross domestic product (GDP) is a monetary measure of the market value of all the final goods and services produced in a specific time period by countries. |
| Original Equipment Manufacturer (OEM) | An original equipment manufacturer (OEM) traditionally is defined as a company whose goods are used as components in the products of another company, which then sells the finished item to users. |
| High Dynamic Range (HDR) | Dynamic range describes the ratio between the brightest and darkest parts of an image. HDR is used to capture a greater dynamic range than SDR. |
| Federal Aviation Administration (FAA) | The division of the Department of Transportation is concerned with aviation. It operates Air Traffic Control and regulates everything from aircraft manufacturing to pilot training to airport operations in the United States. |
| European Aviation Safety Agency (EASA) | The European Aviation Safety Agency is a European Union agency established in 2002 with the task of overseeing civil aviation safety and regulation. |
| 4K Display | 4K resolution refers to a horizontal display resolution of approximately 4,000 pixels. |
| Organic Light Emitting Diode (OLED) | It is the light-emitting diode (LED) in which the emissive electroluminescent layer is a film of organic compound that emits light in response to an electric current. |
| Mean Time Between Failures (MTBF) | The mean time between failures is the predicted elapsed time between inherent failures of a mechanical or electronic system, during normal system operation. |
| (Low-Cost Carrier (LCCs) | It is an airline that is operated with an especially high emphasis on minimizing operating costs and without some of the traditional services and amenities provided in the fare |
| Electronically Dimmable Windows (EDW) | It is a type of window that blocks up to 99.96% of all visible light and provide full opacity, integrated into the window cassette of the sidewall panel. |


Research Methodology
Mordor Intelligence follows a four-step methodology in all our reports.
- Step 1: Identify Key Variables: In order to build a robust forecasting methodology, the variables and factors identified in Step-1 are tested against available historical market numbers. Through an iterative process, the variables required for market forecast are set and the model is built on the basis of these variables.
- Step 2: Build a Market Model: Market-size estimations for the historical and forecast years have been provided in revenue terms. For sales conversion to volume, the average selling price (ASP) is kept constant throughout the forecast period for each country, and inflation is not a part of the pricing.
- Step 3: Validate and Finalize: In this important step, all market numbers, variables and analyst calls are validated through an extensive network of primary research experts from the market studied. The respondents are selected across levels and functions to generate a holistic picture of the market studied.
- Step 4: Research Outputs: Syndicated Reports, Custom Consulting Assignments, Databases & Subscription Platforms


