High Content Screening Market Size and Share
Market Overview
| Study Period | 2020 - 2031 |
|---|---|
| Market Size (2026) | USD 2.14 Billion |
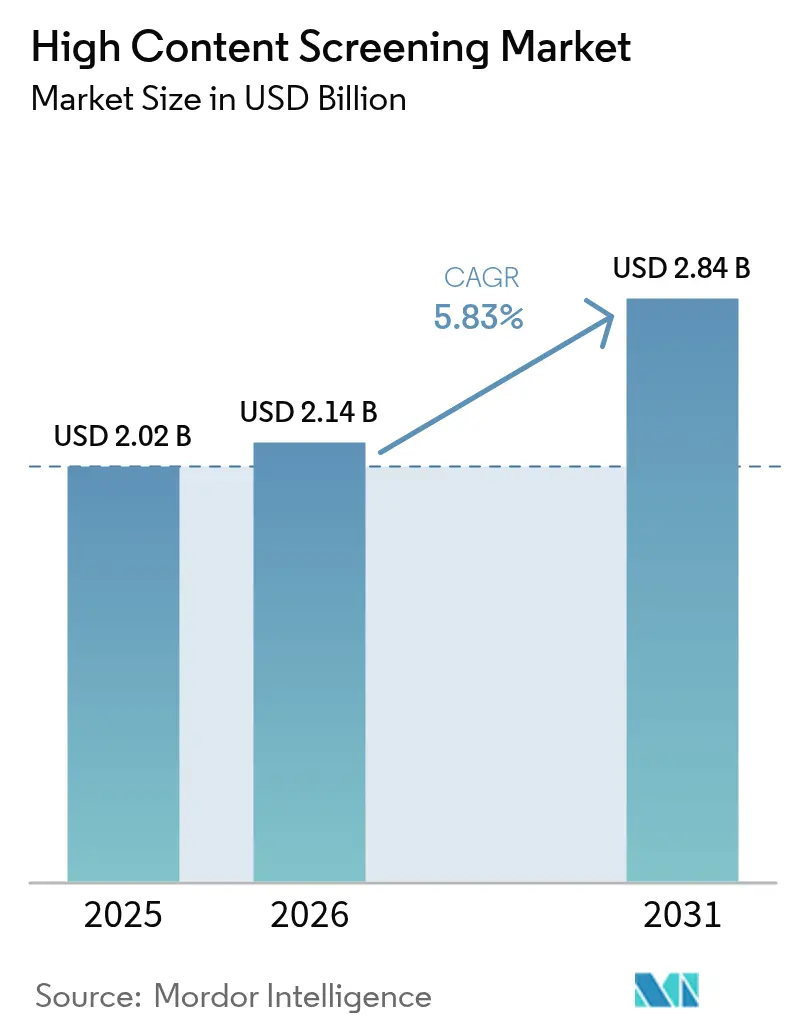
| Market Size (2031) | USD 2.84 Billion |
| Growth Rate (2026 - 2031) | 5.83% CAGR |
| Fastest Growing Market | Asia-Pacific |
| Largest Market | North America |
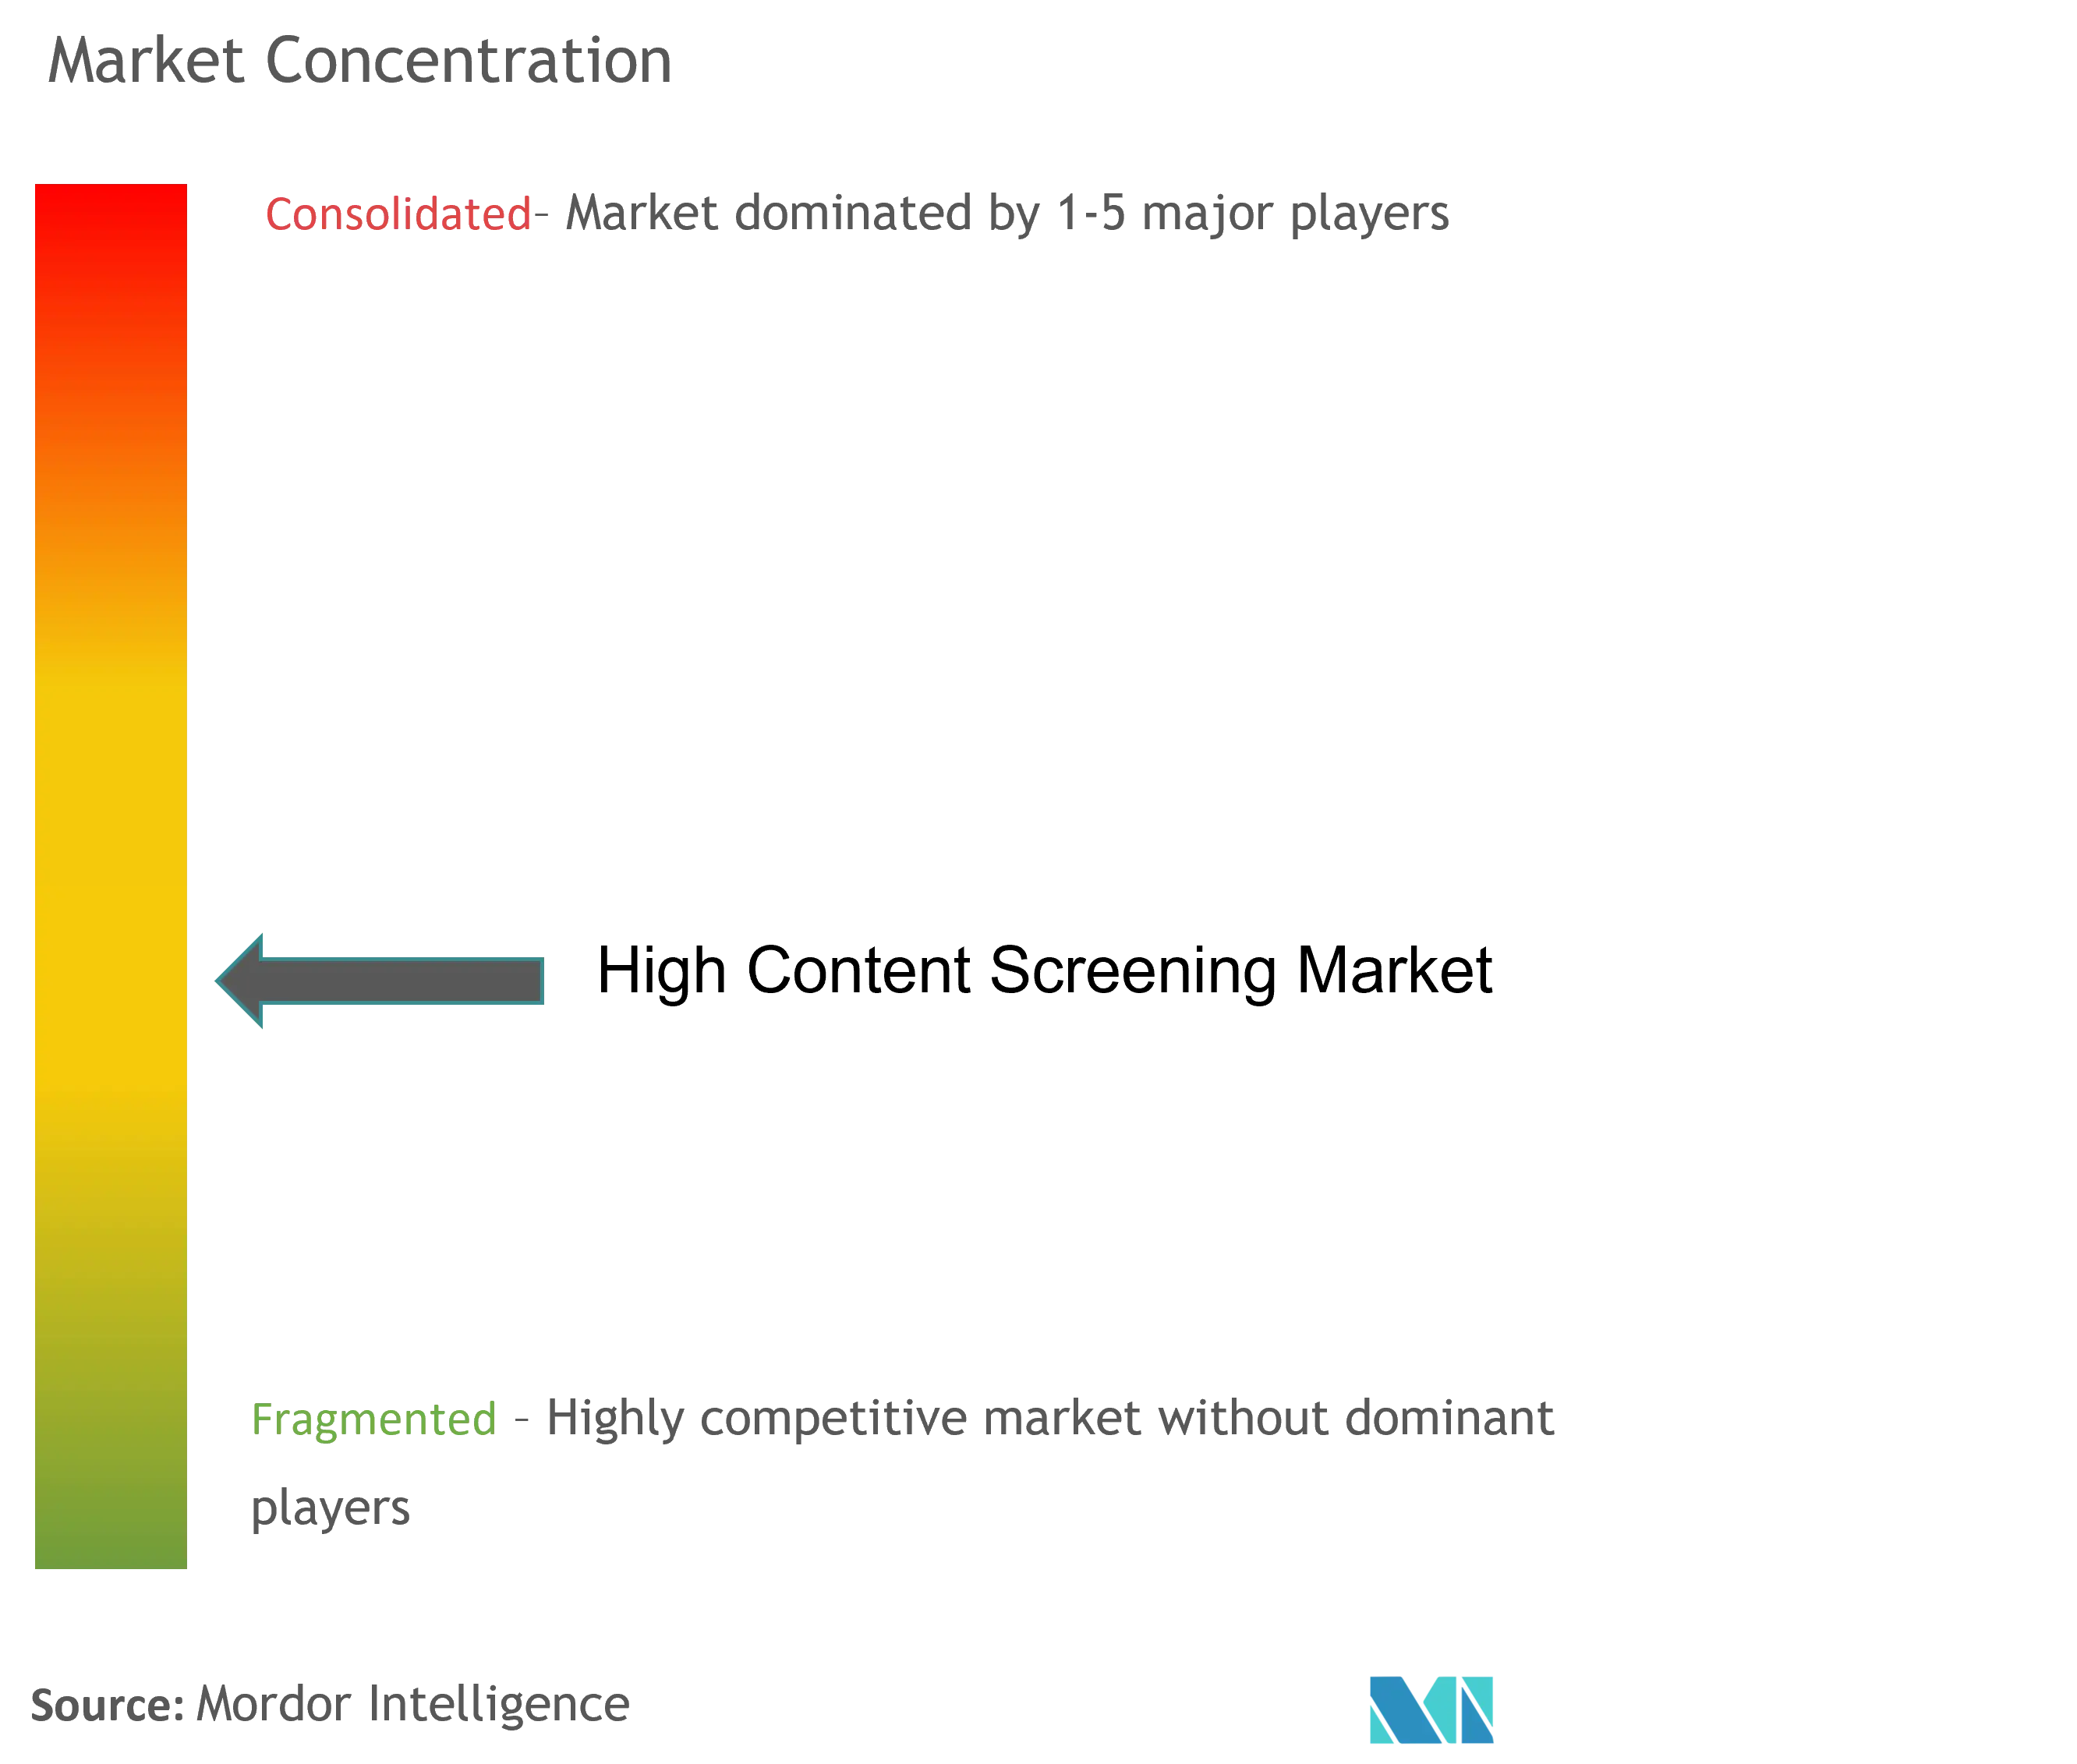
| Market Concentration | Medium |
Major Players*Disclaimer: Major Players sorted in no particular order Image © Mordor Intelligence. Reuse requires attribution under CC BY 4.0. | |
High Content Screening Market Analysis by Mordor Intelligence
The High Content Screening market size is expected to grow from USD 2.02 billion in 2025 to USD 2.14 billion in 2026 and is forecast to reach USD 2.84 billion by 2031 at 5.83% CAGR over 2026-2031. This expansion is underpinned by rapid AI integration, automated imaging innovations, and the need to accelerate drug-candidate triage while curbing R&D expenses. Pharmaceutical companies now deploy scalable cloud-connected instruments that analyze millions of phenotypic images daily, unlocking deeper insights from existing compound libraries and shortening pre-clinical timelines. Competitive dynamics favor vendors capable of combining robust optics with containerized AI pipelines, while regional growth increasingly shifts to Asia-Pacific as local regulators streamline IND approvals and multinational sponsors broaden trial footprints. Instruments still account for the largest revenue block, yet software subscriptions eclipse all other categories in velocity as laboratories migrate analytics to elastic computing environments. End-user outsourcing to contract research organizations (CROs) intensifies, granting smaller biotechs turnkey access to high-throughput phenotypic data and supporting the rise of virtual R&D models.
Key Report Takeaways
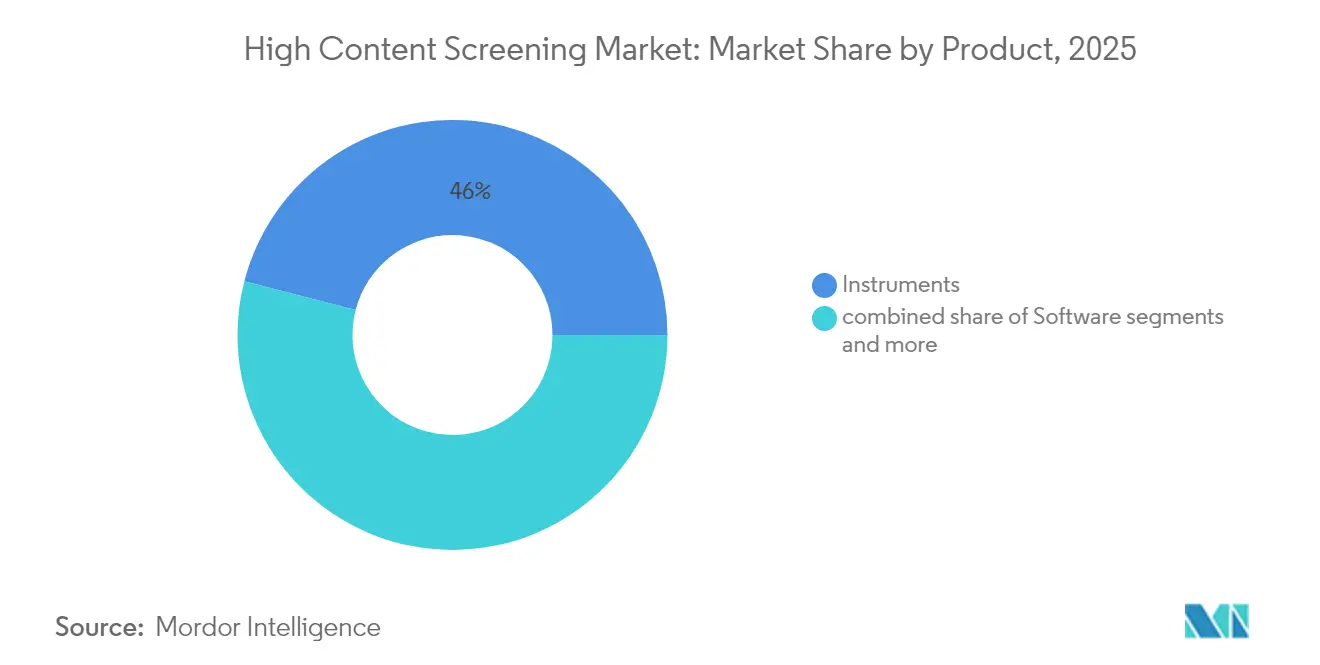
- By product category, instruments held 45.98% of the High Content Screening market share in 2025; software is projected to expand at a 5.93% CAGR through 2031.
- By application, primary and secondary screening captured 38.62% of the High Content Screening market size in 2025 and phenotypic screening for 3D organoids is advancing at a 6.02% CAGR through 2031.
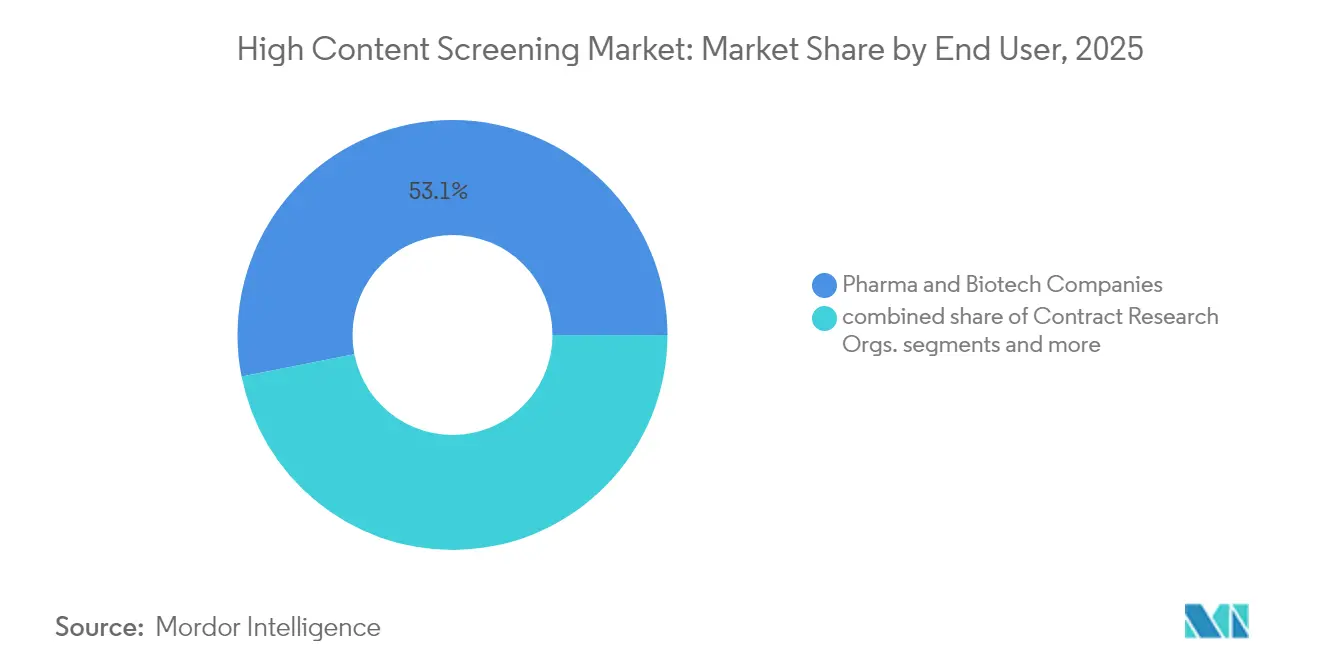
- By end-user, pharmaceutical and biotechnology companies controlled 53.10% of the High Content Screening market share in 2025, while CROs register the highest projected CAGR at 6.74% to 2031.
- By geography, North America led with 41.78% revenue share in 2025; Asia-Pacific posts the fastest regional CAGR at 6.17% through 2031.
Note: Market size and forecast figures in this report are generated using Mordor Intelligence’s proprietary estimation framework, updated with the latest available data and insights as of 2026.
Global High Content Screening Market Trends and Insights
Driver Impact Analysis*
| Driver | (~) % Impact on CAGR Forecast | Geographic Relevance | Impact Timeline |
|---|---|---|---|
| Cost-effective drug discovery imperatives | +1.2% | North America, EU dominant; global relevance | Medium term (2-4 years) |
| AI-powered image-analysis advancements | +0.9% | North America lead, APAC rapidly scaling | Short term (≤2 years) |
| Oncology-focused funding surge | +0.8% | North America and EU; APAC emerging | Medium term (2-4 years) |
| Phenotypic screening adoption for 3D organoids | +0.7% | Early adoption in developed markets; global spread | Long term (≥4 years) |
| Cloud-connected instruments | +0.5% | Broad global uptake | Short term (≤2 years) |
| Source: Mordor Intelligence | |||
Cost-effective Drug Discovery Imperatives
Escalating R&D outlays and persistent late-stage attrition compel drug makers to embrace High Content Screening market solutions that streamline hit-to-lead decision making. Cloud labs drastically lower capital barriers by shifting image acquisition and analysis workloads to pay-as-you-go infrastructures, allowing smaller firms to interrogate large libraries without owning microscopes or robotics. Multinational sponsors reallocate budgets from brick-and-mortar buildouts toward flexible AI subscriptions that scale with portfolio needs, and CROs respond by bundling phenotypic profiling with medicinal chemistry to deliver turnkey asset incubation. Collectively, these shifts reinforce sustainable demand growth across mature and emerging economies.
AI-powered Image-analysis Advancements
Deep convolutional networks now extract subtle morphological signatures from multiplexed fluorescent images, lifting hit-identification rates to 23.8% within the top 1% of ranked compounds. Vendors launch platforms that embed pre-trained models and secure on-prem inference to satisfy data-residency mandates. Pharmaceutical teams leverage these engines to map compound-response trajectories, revealing pathway cross-talk and mechanistic liabilities earlier than legacy pipelines allowed. The net result is faster cycle times, optimized reagent usage, and enriched lead diversity.
Oncology-focused Funding Surge for Cell-based Research
Cancer programs dominate phenotypic screening demand as precision medicine shifts toward patient-specific models. Patient-derived tumor organoids display 87.5% successful culture establishment, supporting relevant drug-response readouts. Venture and partnership capital flows intensify, exemplified by Orionis Biosciences securing USD 105 million upfront and milestone gates above USD 2 billion with Genentech to unlock molecular glues that exploit synthetic lethality. The FDA initiative to curtail animal models further accelerates human-relevant assays, cementing oncology as a long-run growth pillar.
Phenotypic Screening Adoption for 3D Organoids
Three-dimensional cultures replicate extracellular matrices and vascular gradients, enabling more predictive efficacy-toxicity correlations than flat monolayers. Instrument makers integrate dual spinning-disk optics, high-sensitivity sCMOS sensors, and adaptive autofocus to capture volumetric stacks at low phototoxicity. High Content Screening market users apply these datasets to uncover resistance mechanisms, optimizing combination regimens before clinical dosing. Over the forecast horizon, organoid libraries evolve into stratified disease atlases that support patient-matched therapeutic selection.
Restraint Impact Analysis*
| Restraint | (~) % Impact on CAGR Forecast | Geographic Relevance | Impact Timeline |
|---|---|---|---|
| High capital expenditure for HCS platforms | -0.8% | Global, most pronounced in emerging markets | Medium term (2-4 years) |
| Shortage of data-science talent for HCS analytics | -0.6% | Global, particularly acute in North America & EU | Long term (≥ 4 years) |
| Massive image-data storage & compliance burdens | -0.5% | Global, with stricter requirements in North America & EU | Medium term (2-4 years) |
| Inter-vendor software interoperability gaps | -0.4% | Global, affecting all markets with multiple vendor ecosystems | Short term (≤ 2 years) |
| Source: Mordor Intelligence | |||
High Capital Expenditure for HCS Platforms
State-of-the-art automated imagers, robotics, and controlled-environment incubators can exceed USD 3 million per suite, deterring adoption among resource-constrained biotechs. U.S. life-science fit-out costs averaged USD 846 per square foot in 2025, climbing 4.3% year over year and squeezing new-build budgets. To mitigate sticker shock, vendors promote lease-to-own plans, modular add-ons, and outcome-based service contracts that spread expenses across multiyear projects. CROs capitalize by offering pay-per-screen options, effectively converting capex to opex for clients needing episodic throughput.
Shortage of Data-science Talent for HCS Analytics
High Content Screening industry stakeholders struggle to recruit professionals adept at Python, R, and advanced imaging pipelines. Bioprocess employers report persistent vacancy rates for algorithm and model-validation roles despite expanding headcounts. Companies respond with in-house academies and joint master’s curricula, yet supply lags demand. Consequently, fully automated analysis suites that abstract coding complexity gain traction, and partnerships with AI startups accelerate algorithm deployment to frontline scientists.
*Our forecasts treat driver/restraint impacts as directional, not additive. The impact forecasts reflect baseline growth, mix effects, and variable interactions.
Segment Analysis
By Product: Instruments Lead Despite Software’s Rapid Ascent
In 2025, instruments accounted for 45.98% of the High Content Screening market share, reflecting entrenched demand for high-resolution optics and integrated liquid-handling. Software subscriptions, however, post a 5.93% CAGR through 2031 as laboratories prioritize AI workflows that extend the productive life of existing hardware. The High Content Screening market size attributed to software is projected to add USD 183 million by 2031, largely through tiered analytics packages and cloud compute credits. Leading launches such as Yokogawa’s CellVoyager CQ3000 pair dual spinning-disk confocal modules with onboard GPUs, while Sartorius’ iQue 5 HTS marries 27-channel cytometry with continuous unattended runs. Accessories and reagents maintain steady mid-single-digit growth, while services expand in tandem with instrument complexity, ensuring lifecycle uptime and regulatory documentation.
As AI pipelines mature, stand-alone analysis suites integrate container orchestration, automated version control, and audit-ready reporting, meeting FDA 21 CFR Part 11 stipulations. Vendors who bundle hardware, analytics, and validation services position themselves as one-stop partners, locking in multi-year annuity streams and elevating switching barriers.


By Application: Primary Screening Dominance Challenged by Organoid Innovation
Primary and secondary assays contributed 38.62% of 2025 revenues, cementing their role as front-line triage tools. Nonetheless, phenotypic screening of 3D organoids accelerates at 6.02% CAGR and could eclipse target-centric assays by the late 2020s. The High Content Screening market size addition from organoid workflows approaches USD 232 million over the forecast interval, underwritten by oncology pipelines and rare-disease programs seeking translational fidelity. AI-enabled models such as PAIRWISE outperform heuristic approaches when ranking combination regimens, fostering uptake in resistant tumor indications.
Toxicity studies ride regulatory shifts away from animal testing, with liver and cardiac organoids delivering earlier safety checkpoints. Target identification and validation screens integrate CRISPR perturbations with phenomic endpoints, compressing timeline from hit discovery to mechanism confirmation. Compound profiling assays further exploit multiplexed staining to map off-target liabilities, reinforcing decision quality before costly scale-up.
By End-User: CRO Growth Outpaces Pharma Expansion
Pharmaceutical and biotech firms retained 53.10% of the High Content Screening market share in 2025 due to inward integration of core discovery tasks. CROs, however, post the fastest 6.74% CAGR as venture-backed biotechs and mid-cap pharmas outsource phenotypic expertise to control burn rates. Chinese service providers benefit from cost arbitrage and streamlined regulatory pathways, capturing an expanding slice of global contracts. Academic and government institutes grow modestly, leveraging grant inflows into oncology and pandemic preparedness, while still contributing pioneering protocols that commercial entities later scale. Diagnostic laboratories and specialized service shops form a long-tail of demand, applying high-content imaging to companion diagnostic and biomarker discovery projects.
Geography Analysis
North America generated 41.78% of 2025 revenues, anchored by entrenched biopharma clusters and robust venture funding. Asia-Pacific grows at 6.17% CAGR through 2031, powered by China’s IND surge from 688 filings in 2019 to 2,298 in 2023 with 83.5% approval. Regional governments invest in GMP-compliant cell-manufacturing suites and digital regulatory portals, reducing approval latency and attracting multinational trial sponsors.
Europe maintains a steady expansion path, with the European Health Data Space fostering interoperable AI projects that integrate clinical, imaging, and molecular datasets. South America and Middle East & Africa collectively contribute a small but rising share as local contract sites expand capacity for multinational phase I–III trials.


Competitive Landscape
High Content Screening market competition is moderate. Top suppliers integrate hardware excellence with cloud-native analytics and regulatory templates, differentiating on total workflow value rather than standalone optics. Thermo Fisher’s USD 4.1 billion purchase of Solventum’s purification and filtration unit broadens its bioproduction ecosystem, bolstering cell-therapy media supply vital for phenotypic assays. Danaher couples imaging platforms with organoid co-development partnerships at academic medical centers, translating clinical hypotheses into validated screens. BD’s agreement with Biosero automates flow-cytometer plate handling, cutting hands-on time and variance.
Emerging challengers emphasize vertical SaaS for image analysis, instrument-agnostic data fabrics, and pay-as-you-screen marketplaces that connect compound owners with laboratory capacity. Barriers to entry include capital intensity, GMP and 21 CFR Part 11 compliance, and the necessity of multidisciplinary teams. Technology roadmaps converge on high-speed objective changers, multi-modality illumination, and low-phototoxicity optics, wrapped by secure APIs that let sponsors ingest results into FAIR-compliant repositories.
High Content Screening Industry Leaders
Perkinelmer Inc.
Danaher Corporation
Thermo Fisher Scientific Inc.
Agilent Technologies
BD (Becton, Dickinson and Company)
- *Disclaimer: Major Players sorted in no particular order

Recent Industry Developments
- July 2025: Becton, Dickinson and Company announced a planned merger of its Biosciences and Diagnostic Solutions business with Waters Corporation in a deal valued at approximately USD 4 billion, with BD shareholders expected to retain 39.2% of the combined entity upon completion
- May 2025: Orionis Biosciences partnered with Genentech on molecular glue medicines, receiving USD 105 million upfront with milestones above USD 2 billion
- May 2025: Roche and Broad Clinical Labs advanced SBX sequencing for neonatal care, blending genomic screening with high-content analytic workflows


Global High Content Screening Market Report Scope
As per the scope of the report, High Content Screening (HCS) is a method that is used in biological research and drug discovery to identify substances, such as small molecules, peptides, or RNAi, that alter the phenotype of a cell in the desired manner. High-content screening includes any method used to analyze whole cells or components of cells with a simultaneous readout of several parameters.
The High Content Screening Market is Segmented by Type of Product (Instruments, Consumables, Software, and Services), Application (Primary and Secondary Screening, Target Identification and Validation, Toxicity Studies, Compound Profiling, and Other Applications), End User (Pharmaceutical and Biotechnology Companies, Academic and Government Institutions, Contract Research Organization), and Geography (North America, Europe, Asia-Pacific, Middle East and Africa, South America). The market report also covers the estimated market sizes and trends for 17 different countries across major regions, globally. The report offers the value (USD million) for the above segments.
| Instruments | Cell Imaging and Analysis Systems |
| Flow Cytometers | |
| Consumables & Reagents | Reagents and Assay Kits |
| Microplates | |
| Other Consumables | |
| Software | |
| Services | |
| Accessories |
| Primary & Secondary Screening |
| Target Identification & Validation |
| Toxicity Studies |
| Compound Profiling |
| Other Emerging Applications |
| Pharmaceutical & Biotechnology Companies |
| Contract Research Organizations (CROs) |
| Academic & Government Institutes |
| Other End-Users |
| North America | United States |
| Canada | |
| Mexico | |
| Europe | Germany |
| United Kingdom | |
| France | |
| Italy | |
| Spain | |
| Rest of Europe | |
| Asia-Pacific | China |
| India | |
| Japan | |
| South Korea | |
| Australia | |
| Rest of Asia-Pacific | |
| South America | Brazil |
| Argentina | |
| Rest of South America | |
| Middle East and Africa | GCC |
| South Africa | |
| Rest of Middle East and Africa |
| By Product | Instruments | Cell Imaging and Analysis Systems |
| Flow Cytometers | ||
| Consumables & Reagents | Reagents and Assay Kits | |
| Microplates | ||
| Other Consumables | ||
| Software | ||
| Services | ||
| Accessories | ||
| By Application | Primary & Secondary Screening | |
| Target Identification & Validation | ||
| Toxicity Studies | ||
| Compound Profiling | ||
| Other Emerging Applications | ||
| By End-User | Pharmaceutical & Biotechnology Companies | |
| Contract Research Organizations (CROs) | ||
| Academic & Government Institutes | ||
| Other End-Users | ||
| By Geography | North America | United States |
| Canada | ||
| Mexico | ||
| Europe | Germany | |
| United Kingdom | ||
| France | ||
| Italy | ||
| Spain | ||
| Rest of Europe | ||
| Asia-Pacific | China | |
| India | ||
| Japan | ||
| South Korea | ||
| Australia | ||
| Rest of Asia-Pacific | ||
| South America | Brazil | |
| Argentina | ||
| Rest of South America | ||
| Middle East and Africa | GCC | |
| South Africa | ||
| Rest of Middle East and Africa | ||


Key Questions Answered in the Report
How big is the High Content Screening Market?
The High Content Screening Market size is expected to reach USD 2.14 billion in 2026 and grow at a CAGR of 5.83% to reach USD 2.84 billion by 2031.
What is the current High Content Screening Market size?
In 2026, the High Content Screening Market size is expected to reach USD 2.14 billion.
Who are the key players in High Content Screening Market?
Perkinelmer Inc., Danaher Corporation, Thermo Fisher Scientific Inc., Agilent Technologies and BD (Becton, Dickinson and Company) are the major companies operating in the High Content Screening Market.
Which is the fastest growing region in High Content Screening Market?
Asia-Pacific is estimated to grow at the highest CAGR over the forecast period (2026-2031).
Which region has the biggest share in High Content Screening Market?
In 2025, the North America accounts for the largest market share in High Content Screening Market.
What years does this High Content Screening Market cover, and what was the market size in 2025?
In 2025, the High Content Screening Market size was estimated at USD 2.14 billion. The report covers the High Content Screening Market historical market size for years: 2019, 2020, 2021, 2022, 2023 and 2024. The report also forecasts the High Content Screening Market size for years: 2026, 2027, 2028, 2029, 2030 and 2031.
Page last updated on:


